[Hernadewita* 5(7): July, 2018] ISSN 2349-4506
Impact Factor: 3.799
G
lobal
J
ournal of
E
ngineering
S
cience and
R
esearch
M
anagement
AN ANALYSIS OF IMPROVING THE ENVIRONMENTAL PERFORMANCE ON
WASTE MINIMIZATION PRODUCED BY OPERATING TURBINE COMPRESSOR
Hernadewita*, Hendra, Waluyo, Cysca Madona, Herlan Idul Saputra Siahaan, Fanny Putu Saputra*Magister of Industrial Engineering, University of Mercubuana, Indonesia Mechanical Engineering Dept., University of Bengkulu, Indonesia
PT Pertamina Gas, Southern Sumatera Area, Indonesia PT Pertamina Gas, Southern Sumatera Area, Indonesia PT Pertamina Gas, Southern Sumatera Area, Indonesia PT Pertamina Gas, Southern Sumatera Area, Indonesia
DOI: 10.5281/zenodo.1314213
KEYWORDS
:
Environmental Improvement. Gas Turbine Compressor, Water Waste.ABSTRACT
The environmental impact such as water waste and waste from processing and production can damage machine and the environment. In addition to environmental aspects, performance of machine is also influenced by the temperature, pressure and supporting components of the machine especially on the oil and gas industry. In this paper the engine used is a gas turbine compressor which is used to process and drain gas for PT Pertamina Gas (Pertagas) Regional South Sumatra. Gas turbine compressor for gas circulation in the Pertagas Company, SKG Cambai consists of compressor, turbine, combustion chamber and others. In this study focused on gas turbine compressor performance associated with waste, emission gas and efficiency. The results found that gas turbine compressor has an efficiency of 95-96% and can work well. Also for environment parameter such as TOD, COD, CO2, NO2 and etc. that produces waste and exhaust gas within the limits are still allowed.
INTRODUCTION
The Program for Pollution Control, Evaluation, and Rating (PROPER) is an innovative attempt to mitigate the problems associated with pollution under the umbrella of the Government of Indonesia’s Environmental Impact Agency (BAPEDAL). PROPER was launched in June 1995, and supported by World Bank, USAEP/USAID, and Canadian and Australian development agencies. The program’s objective is to act as a regulatory mechanism which can promote and enforce compliance with pollution control standards, encourage pollution reduction, introduce the concept of clean technology, and promote an environmental management system through the use of incentives and transparency. PROPER endeavors to raise awareness among people regarding waste management regulations, as well as encouraging business communities to comply with pollution control standards.
The need for such an effort arose from Indonesia’s inability to handle environmental crises because of industrial expansion and BAPEDAL’s limited capacity in terms of monitoring and enforcement abilities. Public disclosure is key to PROPER’s effort to control pollution. Furthermore, a color-coded rating scheme was developed under PROPER to grade factories’ performance against the regulatory standards. The color coding system is based on five colors—gold, green, blue, red, and black.
The public disclosure process incorporates three distinct steps: data collection and verification from different sources at the participating plants, data analysis, and assigning ratings with subsequent public disclosure. The performance rating process includes the following steps:
select the polluters;
[Hernadewita* 5(7): July, 2018] ISSN 2349-4506
Impact Factor: 3.799
G
lobal
J
ournal of
E
ngineering
S
cience and
R
esearch
M
anagement
The environmental damage began to be felt by many people in the world along with the development of industrial sector. Along with the development of the industrial sector is found negative impact caused by human activity. Currently, the company is required not only give priority to the owners and management, but also all relevant parties (stakeholders), such as employees, customers, community and environment (Pargal & Wheeler, 1995). One of them is the support of the environment. Often, the efforts to increase productivity and efficiency resulting in environmental degradation, such as air and water pollution, and the reduction of soil functions. Protecting the environment in addition to the benefit to the community around is also beneficial for the company in the long term.In the era of the movement of the company towards green company, the industry not only required to the extent of sewage treatment, but also the demands of society-consumers for a production process of goods ranging from making raw materials to the disposal of a product when consumed (used) does not damage the environment.
The concept of green environment has developed since the 1970s in Europe, followed by the beginnings of studies related to the issue of green environment in the 1980s (Cohen & Robin, 2011). Green environment is important because the company needs to submit information on social activities and environmental protection to the stakeholders of the company. The company was not only deliver financial information to investors and creditors of existing as well as potential investors or creditors of the company, but also need to consider the social interests in which the company operates.
This paper is driven by concern for the environment and as an effort to increase awareness of company in Indonesia, especially in the oil and gas sector (Pertagas). This paper aims to 1) determine how the environmental role in improving environmental performance; 2) determine how the description of environmental responsibility conducted by the company, especially in oil and gas sectors.
Green Environmental
Shakeb et al (2016) stated that the value are included in the activity of environmental are "off-side waste disposal treatment, process cleanup, litigation, and other related activities". This indicated that green environmental could then be explained that green environmental is in which to identify, measure, present and disclose the costs associated with t he company's activities related to the environment (Pargal and Wheeler 1995).
With this definition, the environmental awareness can be classified into two categories: prevention and detection (Wheeler & Shakeb 1996).
1. Environmental prevention of activities carried out to prevent the production of contaminants and or waste that could cause damage to the environment. Examples of prevention activities include the following: evaluating and selecting suppliers, evaluating and selecting equipment to control pollution, designing processes and products to reduce or Eliminate contaminants, training employees, studying environmental impacts, auditing environmental risks, undertaking environmental research, developing environmental management systems, recycling products, and Obtaining ISO 14001 certification. 2. Environmental detection of activities executed to determine if products, processes, and other activities
within the firm are in compliance with environmental appropriate standards. The environmental standards and procedures that a firm seeks to follow are defined in three ways: (1) regulatory laws of Governments, (2) voluntary standards (ISO 14001) developed by the International Standards Organization, and (3) environmental policies developed by management. As of activities are auditing environmental detection activities, inspecting products and processes (for environmental compliance), developing environmental performance measures, carrying out contamination tests, and measuring levels of contamination of waste have been produced (BOD and COD).
Environmental Performance
[Hernadewita* 5(7): July, 2018] ISSN 2349-4506
Impact Factor: 3.799
G
lobal
J
ournal of
E
ngineering
S
cience and
R
esearch
M
anagement
Table 1 Determination of Value PROPER
No. Color Information
1 Gold Environmental management has more than required and have made efforts 3R (Reuse, Recycle,
Recovery), implemented a system of sustainable environmental management, as well as make efforts that are useful for long-term public interests
2 Green Environmental management has more than required, has had an environmental management system, has a good relationship with the community, including the efforts of 3R (Reuse, Recycle, Recovery)
3 Blue Has made efforts required environmental management in accordance with the provisions or regulations
4 Red Doing environmental management efforts, but only partially achieve results in accordance with the requirements stipulated in the legislation
5 Black Have not done the environmental management means, intentionally not done environmental management efforts as required, as well as the potential to pollute the environment
Source: Ministry of Environment of Indonesia, 2015
Company Performance
Pertamina has a responsibility in managing and processing oil and gas resources in Indonesia from upstream to downstream. Processing of fuel oil and gas is done in several provinces such as PT. Pertamina Gas (Pertagas) Regional South Sumatra Area based in Palembang. Pertagas Regional South Sumatra consists of several SKGs namely Cambai, Benuang and Pendopo. Focused of this study at is SKGs Cambai, as its contributes to waste produced, water consumptions, and waste water pollution.
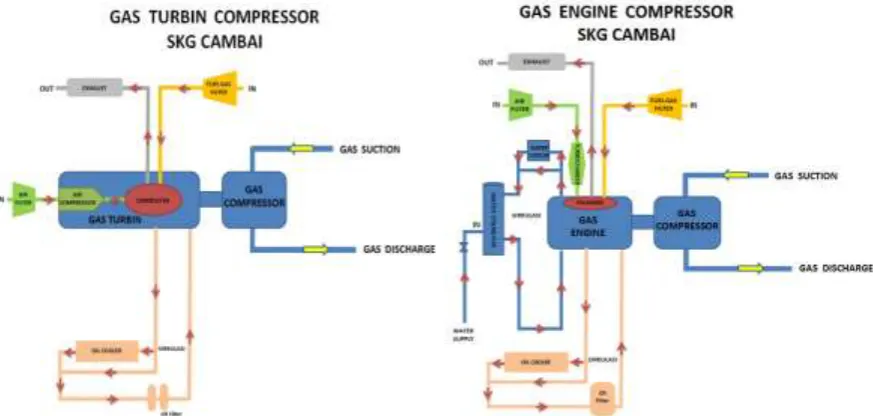
In oil and gas processing, there are several engine components such as gas turbine and gas engine compressors. The gas turbine compressor consists mainly of three components: turbine, compressor, and combustion chamber as shown in Figure 1. Other components such as RH engines, pumps and others also have an important role for the performance of gas turbines. This engine component serves to drain the oil and gas. Turbine produces work from combine the compressed air in the compressor and heated inside the combustion chamber.
As the replacement and re-installment of turbines unit, security of supply gas to customer more efficient and effective while the overhaul of the centaur turbine with the 120MMSCFD capacity has been done.
[Hernadewita* 5(7): July, 2018] ISSN 2349-4506
Impact Factor: 3.799
G
lobal
J
ournal of
E
ngineering
S
cience and
R
esearch
M
anagement
METHOD & MATERIAL
This research use experimental method with set up component consist gas engine compressor and gas turbine compressor (Cohen and Robin, 2011) as shown in Figure 1 and descriptive analysis also describes the figure of spread of measurement of waste on water indicated by BOD and COD. The study was conducted on PT. Pertamina Gas (Pertagas) Southern Sumatra Area at SKG Cambai Area. At SKG Cambai consist for 3 generator, 6 compressor and 2 turbine compressor for circulation gas processing. Schematic of gas circulation can be seen in Figure 1. From Figure 1 as shown the circulation process of water, oil and gas. Water treatment parameter, air emission parameter and water consumption is focus in this paper to analyze.
RESULTS & DISCUSSION
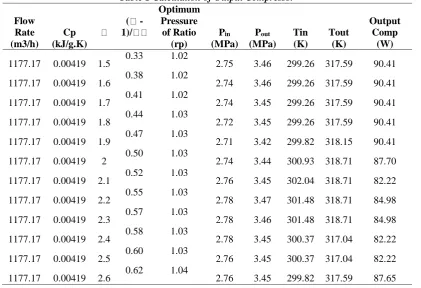
As the test engines are gas turbine compressor 1 until 3 for gas circulation with the same properties and area research at SKG Cambai, Pertagas Regional South Sumatra. The results in this research is efficiency of gas turbine compressor at SKG Cambai, consumption of water, oil and fuel, and environmental treatment for water and other equipment. For efficiency of gas turbine compressor can be seen at Table 1.Table 1 show that the magnitude of the output from the compressor power KW 90.41. Table 1 also shown the larger compression ratio (1.5 to 2.6) then the output power value shrink or enlarged depending on fluctuations in temperature condition in and out.
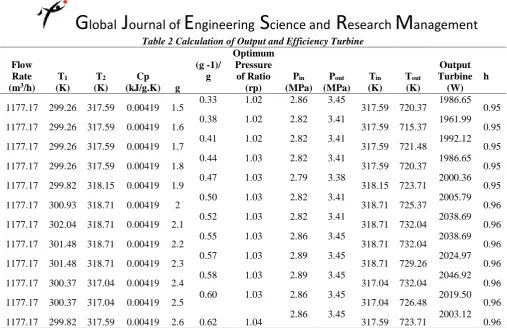
Table 2 shows the magnitude of the value of the power output of the turbine of 1.986 KW. Table 2 has also shown the phenomenon of the power output of the turbine that is similar to the phenomenon of the use of a compressor, which is the greater the compression ratio (1.5 to 2.6) then the value of the output power are increasingly shrinking or enlarged depending on conditions of temperature fluctuations in-out. Turbine efficiency was 0.96% in the compression ratio of 2.6.
Table 1 Calculation of Output Compressor
Flow Rate (m3/h)
Cp (kJ/g.K)
( -1)/
Optimum Pressure
of Ratio (rp)
Pin
(MPa) Pout
(MPa)
Tin (K)
Tout (K)
Output Comp (W)
1177.17 0.00419 1.5 0.33 1.02 2.75 3.46 299.26 317.59 90.41
1177.17 0.00419 1.6 0.38 1.02 2.74 3.46 299.26 317.59 90.41
1177.17 0.00419 1.7 0.41 1.02 2.74 3.45 299.26 317.59 90.41
1177.17 0.00419 1.8 0.44 1.03 2.72 3.45 299.26 317.59 90.41
1177.17 0.00419 1.9 0.47 1.03 2.71 3.42 299.82 318.15 90.41
1177.17 0.00419 2 0.50 1.03 2.74 3.44 300.93 318.71 87.70
1177.17 0.00419 2.1 0.52 1.03 2.76 3.45 302.04 318.71 82.22
1177.17 0.00419 2.2 0.55 1.03 2.78 3.47 301.48 318.71 84.98
1177.17 0.00419 2.3 0.57 1.03 2.78 3.46 301.48 318.71 84.98
1177.17 0.00419 2.4 0.58 1.03 2.78 3.45 300.37 317.04 82.22
1177.17 0.00419 2.5 0.60 1.03 2.76 3.45 300.37 317.04 82.22
[Hernadewita* 5(7): July, 2018] ISSN 2349-4506
Impact Factor: 3.799
G
lobal
J
ournal of
E
ngineering
S
cience and
R
esearch
M
anagement
Table 2 Calculation of Output and Efficiency Turbine
Flow Rate (m3/h)
T1
(K)
T2
(K)
Cp (kJ/g.K) g
(g -1)/ g
Optimum Pressure
of Ratio (rp)
Pin
(MPa) Pout
(MPa) Tin
(K)
Tout
(K)
Output Turbine
(W) h
1177.17 299.26 317.59 0.00419 1.5 0.33 1.02 2.86 3.45 317.59 720.37 1986.65 0.95
1177.17 299.26 317.59 0.00419 1.6 0.38 1.02 2.82 3.41 317.59 715.37 1961.99 0.95
1177.17 299.26 317.59 0.00419 1.7 0.41 1.02 2.82 3.41 317.59 721.48 1992.12 0.95
1177.17 299.26 317.59 0.00419 1.8 0.44 1.03 2.82 3.41 317.59 720.37 1986.65 0.95
1177.17 299.82 318.15 0.00419 1.9 0.47 1.03 2.79 3.38 318.15 723.71 2000.36 0.95
1177.17 300.93 318.71 0.00419 2 0.50 1.03 2.82 3.41 318.71 725.37 2005.79 0.96
1177.17 302.04 318.71 0.00419 2.1 0.52 1.03 2.82 3.41 318.71 732.04 2038.69 0.96
1177.17 301.48 318.71 0.00419 2.2 0.55 1.03 2.86 3.45 318.71 732.04 2038.69 0.96
1177.17 301.48 318.71 0.00419 2.3 0.57 1.03 2.89 3.45 318.71 729.26 2024.97 0.96
1177.17 300.37 317.04 0.00419 2.4 0.58 1.03 2.89 3.45 317.04 732.04 2046.92 0.96
1177.17 300.37 317.04 0.00419 2.5 0.60 1.03 2.86 3.45 317.04 726.48 2019.50 0.96
1177.17 299.82 317.59 0.00419 2.6 0.62 1.04 2.86 3.45 317.59 723.71 2003.12 0.96
For consumption of water for engine can be seen in Figure 2. The water consist from clean water and waste water. Waste water is obtained by treatment water using the special pond to get clean water with check of composition of water. Content of waste water is 6 for inlet and 6.3 for outlet. Unit, for oil and fat is 2.9 inlet and outlet 0.9 mg/L. TOC level for waste water is 81 for inlet and 45.6 for outlet. Other parameter such as BOD, COD, TDS and TSS in this water is 32.6 mg/L, 59,2 mg/l, 112 mg/l and 11.7 mg/L. All this parameter under of quality standard for waste water, its mean this water can be used for environment as shown in Table 3.
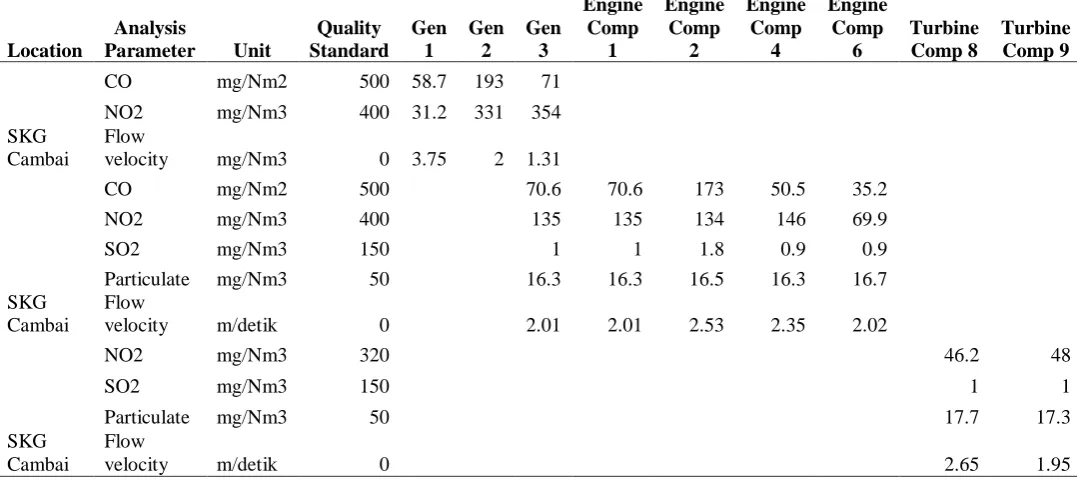
Air emission parameter for engine can be seen at Table 4. As shown in Table 4, the value of parameter air emission for engine such as generator, engine compressor and turbine compressor under the standard of quality by governor. In the generator 1 to 3, the parameter emission is 58.7-193 mg/Nm2, for CO, 31.2-354 mg/Nm3 and flow velocity
1.31-3.75 mg/Nm3. Other parameter such as SO2 and particulate also under the value of quality standard of air
emission. In other words, waste and air emissions gas turbine compressor is still environmentally friendly and can be used for gas circulation.
Water consumption for SKG Cambai can be seen in at Figure 2. Figure 2 shows that the consumption of water for cooling engine, cleaning engine and domestic every years since 2011-2017. Water Consumption water become increase in 2016 about 1433.6m3 for all engine. In the 2017 water consumption decrease about 1332.34 m3. For
cooling engine, water consumption is decrease and for cleaning engine is increase.
Table 3. Parameter of Environment for Component of Machine Water waste)
Location Analysis Parameter Unit
Quality
Standard Location
Inlet Outlet SKG
Cambai
pH Unit 6 - 9 6 6.3
Oil and Fat mg/L 15 2.9 0.9
[Hernadewita* 5(7): July, 2018] ISSN 2349-4506
Impact Factor: 3.799
G
lobal
J
ournal of
E
ngineering
S
cience and
R
esearch
M
anagement
SKGCambai
BOD mg/L 50 32.6
COD mg/L 100 59.2
TDS mg/L 2000 112
TSS mg/L 200 11.7
Table 4. Parameter of Environment for Component of Machine (Air Emission)
Location
Analysis
Parameter Unit
Quality Standard
Gen 1
Gen 2
Gen 3
Engine Comp
1
Engine Comp
2
Engine Comp
4
Engine Comp
6
Turbine Comp 8
Turbine Comp 9
SKG Cambai
CO mg/Nm2 500 58.7 193 71
NO2 mg/Nm3 400 31.2 331 354
Flow
velocity mg/Nm3 0 3.75 2 1.31
SKG Cambai
CO mg/Nm2 500 70.6 70.6 173 50.5 35.2
NO2 mg/Nm3 400 135 135 134 146 69.9
SO2 mg/Nm3 150 1 1 1.8 0.9 0.9
Particulate mg/Nm3 50 16.3 16.3 16.5 16.3 16.7
Flow
velocity m/detik 0 2.01 2.01 2.53 2.35 2.02
SKG Cambai
NO2 mg/Nm3 320 46.2 48
SO2 mg/Nm3 150 1 1
Particulate mg/Nm3 50 17.7 17.3
Flow
velocity m/detik 0 2.65 1.95
Figure 2. Water Consumption for Engine
CONCLUSION
Based on the discussions conducted with the support of the study of literature, as well as empirical and academic research concluded that:
[Hernadewita* 5(7): July, 2018] ISSN 2349-4506
Impact Factor: 3.799
G
lobal
J
ournal of
E
ngineering
S
cience and
R
esearch
M
anagement
2. Waste water and air emissions from the gas turbine compressor are within the limits allowed. In otherwords waste and air emissions gas turbine compressor is still environmentally friendly and can be used for gas circulation.
3. Water consumption for engine is increase at 2016 and become decrease in 2017. For cooling engine the water consumption is low compare the cleaning machine. But for domestic, requirement of water still larger.
REFERENCES
1. Cohen, N., and P. Robbins. (2011). Green Business: An A-to-Z Guide, Thousand Oaks, California: SAGE Publications Inc.pp.190.
2. Indonesia's Ministry of Environment. (2009). The quality standard of waste water for business and / or activity of thermal power plants. The decision of the Environment No. 08 of 2009 on Sea Water Quality Standard. KLH. Jakarta.
3. Japan International Cooperation Agency (JICA), (2016), The PROPER: Indonesian Success Story, URL: http://www.jicaus.org/doc/Annex11-PROPER-su_1AD.doc.
4. Kurz R and Brun, K. “Degradation in Gas Turbine Systems,” ASME Journal of Engineering for Gas Turbines and Power, Vol. 123, No. 1, 2001 pp. 70-77. doi:10.1115/1.1340629
5. P. C. Frith, “The Effect of Compressor Rotor Tip Crops on Turbo- Engine Performance,” ASME Paper 92-GT-83, 1992.
6. Pargal, S, and Wheeler, D., 1995, “Informal Regulation of Industrial Pollution in Developing Countries: Evidence from Indonesia,” Policy Research Department. Environment, Infrastructure, and Agriculture
Division, The World Bank, February. URL:
http://www.worldbank.org/nipr/work_paper/1416/index.htm.
7. Shakeb, A., (1996), PROPER: A Model for Promoting Environmental Compliance and Strengthening Transparency and Community Participation in Developing Countries,” International Resources Group Limited, Washington D.C. URL: http://www.worldbank.org/nipr/work_paper/PROPER2.pdf.
8. Shakeb, A., Benoît L, and Wheeler D, (2016), Controlling Industrial Pollution: A New Paradigm,” Policy Research Working Paper 1672,World Bank, Policy Research Department, Washington, DC, 2016. URL: http://www.vista.gov.vn/moitruong/INFOWEB/ifov61.html.
9. United States-Asia Environmental Partnership (US-AEP), US-AEP Activities in Indonesia. URL: http://www.usaep.org/indonesia/activities.htm#1.
10. Volosin, E. (2008). Environmental Accounting, Norderstedt Germany: GRIN Verlag. Pp.3.
11. Wheeler, D. and Shakeb, A, “Going Public on Polluters in Indonesia: Bapedal’s proper prokasih Program,” Environment, Infrastructure, and Agriculture Division, Policy Research Department, World Bank. URL: http://www.worldbank.org/nipr/work_paper/proper/index.htm.