*
Corresponding author: [email protected]
41
Segregation Patterns of an Equidensity TiO
2Ternary Mixture in a
Conical Fluidized Bed: CFD and Experimental Study
M. Rasteh
Department of Chemical Engineering, Hamedan University of Technology, P. O. Box: 65155-579, Hamedan, Iran
ARTICLE INFO ABSTRACT
Article history:
Received: 2018-08-29 Accepted: 2019-04-08
In this study, an Eulerian-Eulerian multi-fluid model (MFM) was used to simulate the segregation pattern of a conical fluidized bed
containing ternary mixtures of equidensity TiO2 particles.
Experimental 'freeze–sieving' method was employed to determine the axial mass fraction profiles of the different-sized particles and validate the simulation results. The profiles of mass fraction for large-, medium-, and small-sized particles along the bed height during the simulation time indicated that the particles’ segregation could be predicted by CFD model. Effect of superficial gas velocity on segregation pattern was also investigated. It was shown that for U0=1.2Umf, partial segregation of large particles occurred, while for
U0=1.6Umf, small- and medium-sized particles also segregated and full
segregation was achieved. By increasing U0 to 2Umf, mixing of different
sized particles increased and particles segregation reduced. Therefore, it can be concluded that there was a critical velocity below which particles would segregate while above which their mixing increased.
Keywords:
Fluidized Bed, CFD Simulation, Multi Fluid Model, Ternary Mixture, Segregation
1.Introduction
Fluidized beds are among the historically important unit operations that utilize gas-solid flows owing to their excellent mixing of the two phases, uniform concentration/temperature profile within the bed, and favorable heat and mass transfer characteristics [1,2]. In spite of the extensive occurrence of fluidized beds in different industries, some common phenomena such as the influence of polydispersity on system performance remain poorly understood [3,4].
Polydispersity (different particle sizes/densities) not only influences the bulk
behavior of gas-solid fluidized beds, but may also lead to de-mixing of the particles called segregation [1]. In segregation phenomenon, larger/heavier particles behave as ‘jetsam’ and migrate to the bottom of bed, whereas smaller/lighter particles behave as ‘flotsam’ and are preferably accumulated in the top section of the bed [5]. In the cases where smaller particles have a higher density than their larger counterparts, a phenomenon
called “inversion segregation” occurs.
42 Iranian Journal of Chemical Engineering, Vol. 16, No. 2 (Spring 2019) surface as the gas velocity increases [6].
Several competing parameters such as gravity, gas-phase turbulence, drag force, and particle interactions influence the final segregation state of a polydispersed mixture. Van Wachem et al. [7] showed that the predominant forces causing segregation were different depending on the superficial gas velocity. At low velocities, the main force is the drag, whereas increasing the gas velocity brings about increasingly important effects of gradients on granular temperature and pressure.
Segregation is a complex phenomenon that may be profitable or unfavorable depending on the application. For instance, segregation is needed in classifiers [8], while mixing is desired in the pharmaceutical industry to ensure that drug particles do not separate from ingredients before tableting [9]. Therefore, the segregation and mixing behavior in fluidized beds containing polydisperse mixtures should be thoroughly investigated for accurate design, proper operation, and efficient control of such systems.
Different aspects of particle segregation in fluidized beds have been widely investigated experimentally and numerically during the past several decades covering segregation mechanisms, possible incompatibilities and patterns, feasibility analysis, applications, and other associated specifications [10]. The common numerical methods are based on Eulerian-Lagrangian (discrete element model, DEM) and Eulerian-Eulerian (multi-fluid model, MFM) models via computational fluid dynamics (CFD) simulations [11]. The Eulerian–Lagrangian approach has the advantage of accounting for the corpuscular nature of particles by explicitly evaluating their trajectories. The disadvantage, however,
is the high computational cost that increases with the number of particles. The main advantage of the MFM is that it requires a modest computational effort [12]. However, it is well known that its performance depends on the proper description of all possible intra- and inter-phase interactions, such as gas-solid
interactions, collision, and frictional
interactions between particles and also particles and wall [13].
Among the numerous CFD simulations of fluidized beds with polydisperse particles,
binary mixtures have attracted much
Iranian Journal of Chemical Engineering, Vol. 16, No. 2 (Spring 2019) 43 the most appropriate for simulating size,
density, and combined size/density
segregations at lower gas velocities in bubbling fluidized beds. Chao et al. [19] used an MFM to investigate density segregation in a dense, binary fluidized bed. They studied the behavior of two types of particles with the same sizes but differing in density and, then, compared the results with experimental data from Formisani et al. [20]. Parametric studies of various operating and design variables of a bubbling fluidized bed were performed by Geng et al. [21] who studied the impact of important modeling parameters of solid wall boundary conditions, transport equations of granular temperature, particle-particle restitution coefficient, and the packing limit on the MFM results of a pseudo-2D bubbling fluidized bed. It was found that the predicted mixing behavior closely referred to the expression for granular temperature and also the specularity coefficient. Applying DEM, Feng et al. [22] simulated the flow behavior of flotsam and jetsam particles, and showed that the degree and rate of segregation were considerably affected by gas velocity and the final equilibrium states were not affected by the initial packing states for a given gas velocity. Effect of adding fine particles on segregation behavior of binary mixtures in gas-solid fluidized beds was studied by Norouzi et al. [23] through DEM simulation. The results showed that the addition of fines increased segregation of small- and large-sized particles by lowering inter-particle interactions, which resulted in enhanced mobility of larger particles.
In light of the literature survey, it was well understood that although the CFD/DEM and CFD/MFM simulations are commonly used for binary mixtures, there is a lack of CFD simulation for ternary particle mixtures
focused on particle segregation pattern. Therefore, in the present work, a conical fluidized bed containing a ternary mixture of
equidensity TiO2 particles was simulated by
multi-fluid model (MFM) via CFD simulation, and the dynamic and pseudo steady state segregation behavior of different sized particles was analyzed. The axial segregation pattern of ternary particles for different gas velocities was also discussed, and the simulation results of axial segregation profile were compared with the experimental data obtained by 'freeze-sieving' method.
2. Experimental procedure
The experiments were conducted in a conical fluidized bed made out of plexiglass, shown schematically in Fig. 1. Dimensions of the conical fluidized bed are given in Table 1. Gas distributor was a perforated plate with a standard mesh of 170. Air as fluidizing gas was supplied by a compressor (HSS make, model: MICAS-PH-80-1055, 1000 Lit/min) and entered into the bed after drying in two silica gel columns. Two rotameters with ± 2 % FSD accuracy for the lower ranges (0–5
m3/h) and the higher ranges (5–20 m3 /h) were
placed in the air flow path to measure the air flow rates. Two pressure ports at the inlet (above the distributor) and outlet (at the exit section) of the bed were provided for recording the pressure drop along the bed height by a U-tube manometer, which used colored water as manometric fluid. The mass fraction of small-, medium-, and large-sized particles along the bed height was determined by a sieving shaker machine (AS200 control, Retsch GmbH, Germany) with sieves ranging
from 1400 to 63 µm.
A ternary mixture of dried anatase titanium
dioxide (TiO2) particles composed of three
44 Iranian Journal of Chemical Engineering, Vol. 16, No. 2 (Spring 2019) filled in the bed in order to obtain the desired
initial bed height (H0=8 cm). The mixture
with an average particle diameter of 170 micron is composed of three sets of mono-size particles with diameters of 85, 175, and 370 micron and weight fractions of 14 %, 63 %, and 23 %, respectively. The physical
properties of TiO2 particles are given in Table
2. In order to determine minimum fluidization
velocity (Umf), the investigation of
characteristic curves (∆P–U0) as a classical
method for studying hydrodynamics of fluidization process was employed. This method was described in detail in [2] and, therefore, not repeated here for brevity.
Figure 1. Experimental apparatus: 1. Air compressor, 2. Valves, 3. Rotameters, 4. Silica gel
towers, 5. Gas distributor, 6. Conical fluidized bed, 7. Filters, 8. Cyclone, 9. Manometer.
Table 1
Geometry of conical fluidized bed in this study.
Value Dimension
12 cm Bottom bed diameter
24 cm Top bed diameter
12o Cone angle
18 cm Conical section height
30 cm Cylindrical section
height
48 cm Total height of the bed
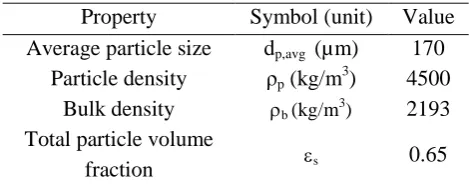
Table 2
Physical properties of TiO2 particles.
Property Symbol (unit) Value Average particle size dp,avg (µm) 170
Particle density ρp (kg/m 3
) 4500 Bulk density ρb (kg/m3) 2193
Total particle volume
fraction εs 0.65
To carry out axial segregation experiments, the bed was fluidized at a relatively high
superficial gas velocity (U0=2.5Umf=0.135
m/s) for a time duration of 10 min to ensure perfect mixing and reproducibility of the initial condition for desired superficial gas velocities. After the end of mixing time, the air supply was shut off and, then, the bed was fluidized at the desired superficial gas
velocities (U0= 0.0648, 0.0864 and 0.108 m/s
corresponding to 1.2Umf, 1.6Umf, and 2Umf,
respectively) for desired time (30 s). After the segregation time, the air flow rate was abruptly shut off to freeze the bed. The frozen bed was then divided into 8 sections along the bed height (1 cm apart), and the particles were vacuumed out of each section for sieve analysis and determining powder mass composition along the axial direction, as described in [3, 24].
3. CFD model description
The governing equations of MFM, simulation conditions, solution procedure, and initial and boundary conditions for hydrodynamic
simulation of ternary mixture of TiO2
particles in a lab-scale conical fluidized bed are explained in this section.
Iranian Journal of Chemical Engineering, Vol. 16, No. 2 (Spring 2019) 45 equations are solved for each phase.
Additional source terms are added to the conservation equations to account for the interactions between the phases. Kinetic theory of granular flow (KTGF), which makes an analogy between the particulate phases and the kinetic theory of gases, is used for evaluating the granular temperature (kinetic energy of particulate phase) and other particulate phase properties. The set of governing equations and consecutive models
of the MFM and KTGF are presented in Appendix A. More detailed discussions about the governing equations may be found in [18,25,26].
Simulations have been performed in a Cartesian coordinate system using the bed geometry given in Table 1. The gas and particulate phase’s specification and also simulation parameters are summarized in Tables 3 and 4.
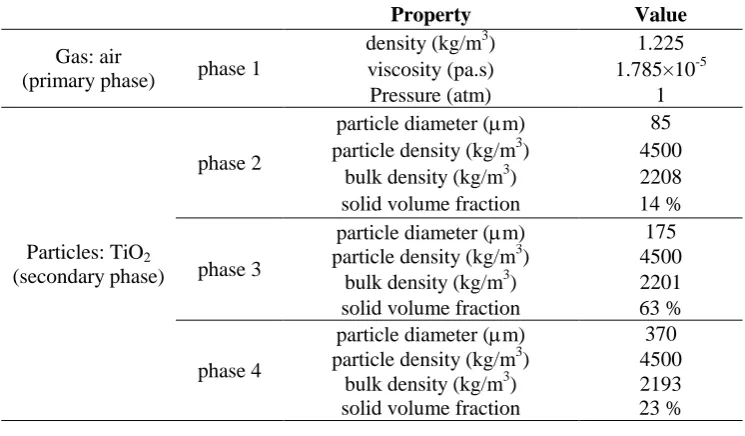
Table 3
Physical properties of four phases used in simulations.
Property Value
Gas: air
(primary phase) phase 1
density (kg/m3) 1.225
viscosity (pa.s) 1.785×10⁻⁵
Pressure (atm) 1
Particles: TiO2
(secondary phase)
phase 2
particle diameter (µm) 85
particle density (kg/m3) 4500
bulk density (kg/m3) 2208
solid volume fraction 14 %
phase 3
particle diameter (µm) 175
particle density (kg/m3) 4500
bulk density (kg/m3) 2201
solid volume fraction 63 %
phase 4
particle diameter (µm) 370
particle density (kg/m3) 4500
bulk density (kg/m3) 2193
solid volume fraction 23 %
Table 4
Simulation parameters.
Hydrodynamic model Eulerian-Eulerian
Viscosity model Standard k-ε
Drag models Gidaspow
Particle–particle restitution Coefficient 0.95
Granular viscosity Gidaspow
Granular bulk viscosity Lun-et-al
Frictional viscosity Schaeffer
Angel of internal friction 30o
Friction packing limit 0.61
Solid pressure Lun-et-al
Radial distribution Lun-et-al
Maximum packaging limit 0.67
Specularity coefficient 0.9
Superficial gas velocities (based on bed bottom diameter)
0.0648 (1.2Umf) , 0.0864 (1.6Umf),
0.108 (2Umf) m/s
46 Iranian Journal of Chemical Engineering, Vol. 16, No. 2 (Spring 2019) 3.2. Solution procedure
The CFD simulations were carried out by the commercial software package FLUENT 15.0.7 (Ansys Inc.) with a double precision option. The phase coupled SIMPLE algorithm was applied to pressure-velocity coupling under the transient condition. Least Squares Cell Based for gradient, Second Order Upwind scheme for momentum, turbulence kinetic energy, and turbulent dissipation rate were used for spatial discretization to obtain more precise results. Fixed option with a
value of 10−4 for time step (after studying
time step dependency) was used for transient simulations, and the value of 50 for maximum iteration per time step was set. To ensure relatively low error between two consecutive
iterations, the convergence criterion of 10−3
was considered for all scaled residuals.
3.3. Boundary conditions
A no-slip boundary condition was applied to the gas phase at the wall, and Johnson and Jackson’s [27] slip wall boundary condition (Appendix B) was used for the solid phase.
The parameter 𝜑𝜑 in Johnson and Jackson
boundary condition is called specularity coefficient, which varies due to roughness and shear at the wall. The value of 0.9 for specularity coefficient, corresponding to partial slip boundary condition, was used for solid phases in these simulations. At the inlet of the conical fluidized bed, the gas enters only in the axial direction (Dirichlet boundary condition), and superficial gas velocities of 0.0648, 0.0864, and 0.108 m/s were set as the inlet gas velocity. At the outlet of the bed, an outflow boundary condition was used, which means that the gas velocity gradient was set to
zero along the axial direction (𝜕𝜕𝑢𝑢𝑦𝑦
𝜕𝜕𝜕𝜕 = 0) and
atmospheric condition for pressure was also imposed.
4. Results and discussion
4.1. Grid-size dependency analysis
Three structured meshes corresponding to the number of nodes equal to 17672 (94×188), 45000 (150×300), and 64800 (180×360) were created in order to study mesh dependence solution, and to ensure that the CFD simulation results are independent of the
mesh size. Total bed pressure drop (∆P) and
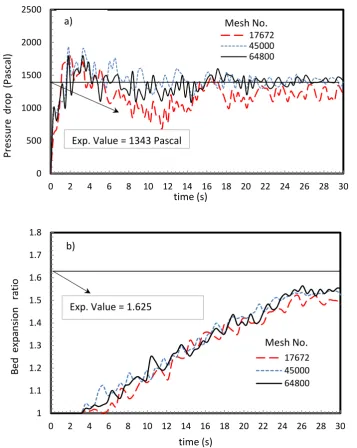
bed expansion ratio (R) were selected as the overall hydrodynamic parameters for performing the grid dependency study, and the simulation results for different meshes were compared with the experimental data for the bed with an initial height of 8 cm and a superficial gas velocity of 0.0864 m/s. Fig. 2 shows that the simulation results for the fine (64800) and medium (45000) grid sizes for
∆P (Fig. 2-a) and R (Fig. 2-b) have no
significant differences, while the results for the coarse grid (17672) show disparity with those of fine and medium grid sizes. The average size of cells in the medium grid size is about 11 times the average particle diameter, which is consistent with 10 to 12.5 times used in the earlier studies [28,29].
Average simulated values for ∆P and R (time
Iranian Journal of Chemical Engineering, Vol. 16, No. 2 (Spring 2019) 47 Figure 2. Total pressure drop (a) and bed expansion ratio (b) versus time for different mesh numbers.
(U0=0.0864 m/s and H0= 8 cm).
Table 5
Average pressure drop, bed expansion ratio and required CPU time for different meshes.
Mesh number
Average of ∆P (Pascal) 20< t <30 sec
Relative error (%)
Average of R 20< t <30 sec
Relative error (%)
Required CPU time for 1 sec simulation (h)
17672 1220 -9.1 1.49 -8.5 4.11
45000 1415 5.4 1.52 -6.3 5.61
64800 1411 5.1 1.53 -5.9 7.25
4.2. Segregation pattern
Solid volume fractions of small-, medium-, and large-sized particles for superficial gas
velocity 0.0864 m/s (1.6Umf) at times=0, 10,
20, and 30s from the beginning of simulation are shown in Fig. 3. At t=0, the particles are 0
500 1000 1500 2000 2500
0 2 4 6 8 10 12 14 16 18 20 22 24 26 28 30
Pre
ss
ure
d
ro
p
(P
as
cal)
time (s)
17672 45000 64800 Mesh No.
Exp. Value = 1343 Pascal a)
1 1.1 1.2 1.3 1.4 1.5 1.6 1.7 1.8
0 2 4 6 8 10 12 14 16 18 20 22 24 26 28 30
Be
d
ex
pan
sio
n
rat
io
time (s)
17672 45000 64800 Mesh No. Exp. Value = 1.625
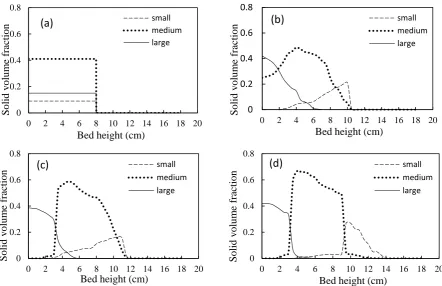
48 Iranian Journal of Chemical Engineering, Vol. 16, No. 2 (Spring 2019) well-mixed; however, with time, the large
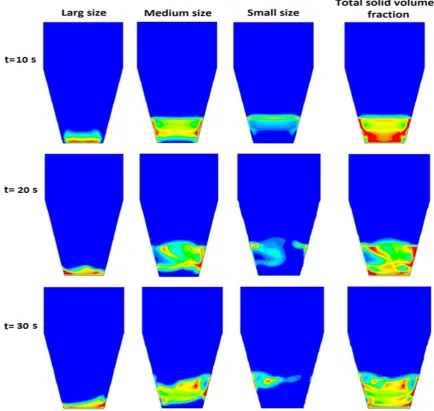
particles are gradually accumulated in the bottom region of the bed, and the small particles are gathered in the top zone, while medium-sized particles appear in the middle region of the bed. This result is in agreement with the observation of Huilin et al. [14] who studied size segregation of binary mixture in bubbling fluidized beds. It is seen from Fig. 3 that at t=20 s, large particles almost segregate, while medium- and small-sized particles are still mixed; however, at t=30 s, the small- and medium-sized particles also separated and the complete segregation occurred. Contour plots of volume fractions of different size particles and also the total solid volume fractions are presented in Fig. 4. Segregation of large particles at t=20 s and full segregation of different size particles at t=30 s are observed from this figure. The observed segregation is consistent with pattern shown in Fig. 3.
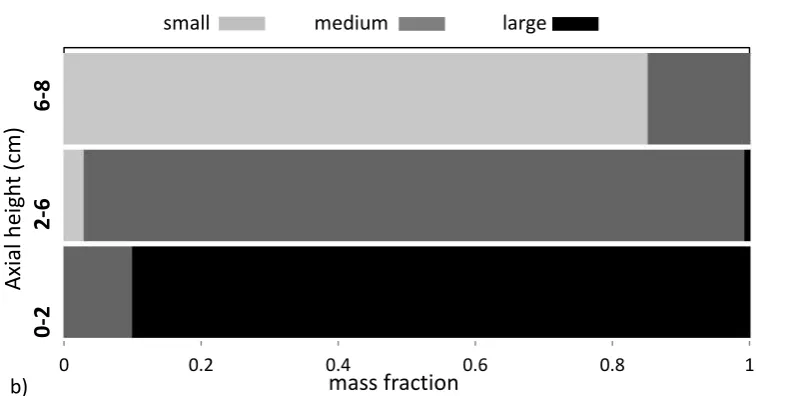
The experimental results of the particles
segregation obtained from the "freeze-sieving" method for a superficial gas velocity of 0.0864 m/s at t=20 and 30s are presented in Fig. 5. In the "freeze-sieving" method [4], the bed is fluidized for specific time duration and, then, is de-fluidized suddenly to "freeze", particles are vacuumed from each section of the bed height to determine the mass fraction of different particle sizes by sieving. As seen from Fig. 5a, at t=20s, the major part of the large particles is accumulated in the lower region of the bed, while the small and medium particles are mixed in the middle and upper parts of the bed. At t=30s (Fig. 5b), the small and medium particles also segregate so that they appear mainly in the upper and middle layers of the bed, respectively. The simulation results of the segregation analysis given in Figs. 3 and 4 are in good agreement with the experimental results presented in Fig. 5.
Figure 3. Segregation patterns of particle mixture at U0=0.0864 m/s; (a: t= 0, b: t=10, c: t=20, and d: t= 30 sec). 0 0.2 0.4 0.6 0.8
0 2 4 6 8 10 12 14 16 18 20
S o lid v o lu m e fr ac tio n
Bed height (cm)
(a) smallmedium large 0 0.2 0.4 0.6 0.8
0 2 4 6 8 10 12 14 16 18 20
S o lid v o lu m e fr ac tio n
Bed height (cm)
(b) small
medium large 0 0.2 0.4 0.6 0.8
0 2 4 6 8 10 12 14 16 18 20
S o lid v o lu m e fr ac tio n
Bed height (cm)
(c) small
medium large 0 0.2 0.4 0.6 0.8
0 2 4 6 8 10 12 14 16 18 20
S o lid v o lu m e fr ac tio n
Bed height (cm)
(d) small
Iranian Journal of Chemical Engineering, Vol. 16, No. 2 (Spring 2019) 49 Figure 4. Contours of volume fractions of large, medium, and small particles and total solid volume
fraction at U0=0.0864 m/s.
0 0.2 0.4 0.6 0.8 1
Ax
ial
he
ig
ht
(c
m)
0-2
2
-6
6
-8
mass fraction
small medium large
50 Iranian Journal of Chemical Engineering, Vol. 16, No. 2 (Spring 2019) Figure 5. Weight fraction of different sized particles along the bed height at Umf= 0.0864 m/s (a: t= 20 and
b: t= 30 sec).
4.3. Effects of gas velocity on particle segregation
Fig. 6 shows the solid volume fraction contours for small-, medium-, and large-sized particles for different superficial gas
velocities in the range of 1.2Umf to 2Umf
(0.0648 to 0.108 m/s) at t=30s. As can be seen
in Fig. 6a, for gas velocity 1.2Umf (0.0648
m/s), large particles segregate and accumulate in the bottom region of the bed, while segregation of small and medium particles
does not occur. For the gas velocity of 1.6Umf
(0.0864 m/s), the segregation of medium and small particles also occurs, leading to the complete segregation of the bed (Fig. 6b). With increasing superficial gas velocity from
1.6Umf to 2Umf (0.0864 to 0.108 m/s), the
mixing of different size particles increases and particle segregation reduces (Fig. 6c). These results are in agreement with the observation of Zhang et al. [30], who studied particle segregation for binary system in a cylindrical fluidized bed. They found that there was a critical value for superficial gas velocity below which particles segregate; however, for high gas velocities, the particles are more mixed.
Simulation results of solid volume fraction profiles of small-, medium-, and large-sized particles along the bed axis for different
superficial gas velocities in the range of
1.2Umf to 2Umf are presented in Fig. 7. It is
seen that, for superficial gas velocity 1.2Umf,
small- and medium-sized particles are distributed in the middle and upper regions (Fig. 7a-b); however, large particles reside only in the bottom region of the bed (Fig. 7c). This shows that, for this gas velocity, only the segregation of large particles occurs, while small and medium particles are still mixed.
For gas velocity 1.6Umf, small, medium, and
large particles are concentrated in the upper, middle, and bottom regions of the bed, respectively, indicating the full segregation of particles. It is observed from Fig. 7 that the solid volume fraction profiles of different size particles have become more uniform for the
higher superficial gas velocities (U0 =2Umf).
Therefore, it can be concluded that the mixing of particles is intensified and particle segregation is reduced for gas velocities
higher than 1.6 Umf. These observations are
consistent with the results shown in Fig. 6.
0 0.2 0.4 0.6 0.8 1
Ax
ial
he
ig
ht
(c
m)
0-2
2
-6
6
-8
mass fraction
small medium large
Iranian Journal of Chemical Engineering, Vol. 16, No. 2 (Spring 2019) 51 Figure 6. Contours of volume fractions of large, medium, and small particles for different superficial gas
velocities.
0 0.05 0.1 0.15 0.2 0.25 0.3 0.35
0 2 4 6 8 10 12 14 16 18 20
Sol
id
v
ol
um
e
fr
ac
tion
Bed height (cm)
Simulation
Simulation
Simulation U0 =1.2Umf
a)
U0 =1.6Umf
52 Iranian Journal of Chemical Engineering, Vol. 16, No. 2 (Spring 2019) Figure 7. Solid volume fraction profiles of a) small, b) medium, and c) large particles versus bed height
for different superficial gas velocities.
5. Conclusions
The segregation behavior of a conical fluidized bed containing ternary mixtures of
equidensity TiO2 particles was investigated
by an MFM/CFD simulation. The
characteristics of segregation were analyzed using the governing equations of multi-fluid model (MFM) and the constitutive correlations obtained from the kinetic theory of granular flow (KTGF).
The MFM model, predictions for the time evolution of solid volume fraction profiles of large-, medium-, and small-sized particles along the bed height were evaluated. The results showed that the partial segregation after t=20s and full segregation after t=30s were predicted by the MFM for the
superficial gas velocity of 1.6Umf, which are
in agreement with experimental results obtained from "freeze-sieving" method. When
full segregation occurred, large particles settled to the bed bottom layers and small particles floated to the bed upper region. These two zones are separated by the third intermediate one, composed of medium-sized particles.
An examination of superficial gas velocity effects on particle segregation revealed that,
for U0=1.2Umf, large particles were
accumulated in the bottom region of the bed; however, small- and medium-sized particles
were still mixed. For U0=1.6Umf, small- and
medium-sized particles also segregated and
full segregation occurred. For U0=2Umf,
mixing of different size particles was increased and particles segregation was reduced. Therefore, it was concluded that different size particles would segregate at lower superficial gas velocities, while their mixing increased above a critical gas velocity. 0
0.1 0.2 0.3 0.4 0.5 0.6 0.7 0.8
0 2 4 6 8 10 12 14 16 18 20
Sol
id
v
ol
um
e
fr
ac
tion
Bed height (cm)
Series2 Series4 Series6 b)
U0 =1.2Umf
U0 =1.6Umf
U0 =2Umf
0 0.1 0.2 0.3 0.4 0.5
0 2 4 6 8 10 12 14 16 18 20
Sol
id
v
ol
um
e
fr
ac
tion
Bed height (cm)
Simulation Simulation Simulation c)
U0 =1.2Umf
U0 =1.6Umf
Iranian Journal of Chemical Engineering, Vol. 16, No. 2 (Spring 2019) 53 Nomenclature
CD drag coefficient.
ds, dp particle diameter [m].
es restitution coefficient of particle-particle.
ew restitution coefficient of wall-particle.
g
�⃗ gravity [m. s−2].
g0 radial distribution function.
I2D second invariant of the deviatoric stress tensor.
𝐶𝐶𝜇𝜇, 𝐶𝐶1𝜖𝜖, 𝐶𝐶2𝜖𝜖,
𝜎𝜎𝑘𝑘, 𝜎𝜎𝜖𝜖 turbulence model coefficients.
𝐺𝐺𝑘𝑘,g turbulence kinetic energy production [kg. m−1. s−3].
𝐼𝐼̿ unit tensor. 𝑁𝑁𝑐𝑐 Courant number.
𝑃𝑃𝑠𝑠 solid pressure [kg. m−1. s−2].
𝑅𝑅𝑅𝑅𝑠𝑠 particle Reynolds number.
𝑢𝑢�⃗ gas velocity vector [m. s−1]. 𝑣𝑣⃗ particle velocity vector [m. s−1]. 𝑣𝑣𝑠𝑠,𝑠𝑠𝑠𝑠𝑠𝑠𝑠𝑠 slip velocity of particle at the wall [m. s−1].
𝑣𝑣𝑠𝑠,𝑤𝑤 tangential velocity of particle at the wall [m. s−1]. N number of particles.
𝐾𝐾 turbulent kinetic energy of gas phase [m2. s−2].
𝑃𝑃 pressure [kg. m−1. s−2]. Greek letters
Θ granular temperature [m2. s−2]. ΠK,𝑔𝑔 , Πϵ,𝑔𝑔 influence of the dispersed phases on
the continuous phase.
µl,𝑔𝑔 gas molecular viscosity
[kg. m−1. s−1].
µs,col collisional viscosity of solid
[kg. m−1. s−1].
µs,fr frictional viscosity of solid
[kg. m−1. s−1].
µs,kin kinetic viscosity of solid
[kg. m−1. s−1].
λs bulk viscosity of solid [kg. m−1. s−1].
µs shear viscosity of solid
[kg. m−1. s−1].
µt,𝑔𝑔 gas turbulent viscosity
[kg. m−1. s−1].
µ𝑔𝑔 gas viscosity [kg. m−1. s−1].
Θ𝑤𝑤 granular temperature at wall
[m2. s−2].
τ�𝑔𝑔 , τ�𝑠𝑠 stress tensor for gas and solid phase respectively [kg. m−1. s−2].
∅𝒈𝒈𝒈𝒈 transfer of kinetic energy between phases [kg. m−1. s−3].
𝑘𝑘Θ𝑠𝑠 diffusion coefficient of granular energy [kg. m−1. s−1].
𝛾𝛾Θ𝑠𝑠 collisional energy dissipation [kg. m−1. s−3].
𝜀𝜀𝑔𝑔,𝜀𝜀𝑠𝑠 volume fraction of gas and solid respectively.
𝜀𝜀𝑠𝑠,𝑚𝑚𝑚𝑚𝑚𝑚 maximum packing limit of solids.
𝜌𝜌𝑔𝑔 , 𝜌𝜌𝑠𝑠 gas and solid density [kg. m−3].
𝛽𝛽 momentum coefficient [kg. minterphase exchange −3. s−1].
𝜑𝜑 specularity coefficient.
𝜖𝜖 turbulence dissipation energy of gas phase [m2. s−3].
Appendix
Table A1
Governing equations of TFM.
Continuity equations of gas and particulate phase (g for gas and s for particulate).
(A1-1) ∂
∂t (ε𝑔𝑔.ρ𝑔𝑔) +�∇.ε𝑔𝑔.ρ𝑔𝑔.𝒖𝒖��⃗�= 0
(A1-2) ∂
∂t (εs.ρs) + (∇.εs.ρs.𝒗𝒗��⃗) = 0
Momentum equations of gas and particulate phase.
(A1-3) ∂
𝜕𝜕𝜕𝜕(ε𝑔𝑔.𝜌𝜌𝑔𝑔.𝒖𝒖��⃗) +�𝛻𝛻.ε𝑔𝑔.𝜌𝜌𝑔𝑔.𝒖𝒖��⃗.𝒖𝒖��⃗�=−ε𝑔𝑔𝛻𝛻𝑃𝑃 −β(𝒖𝒖��⃗ − 𝒗𝒗��⃗) +𝛻𝛻.�ε𝑔𝑔.𝜏𝜏̿𝑔𝑔�+ε𝑔𝑔.𝜌𝜌𝑔𝑔.𝐠𝐠�⃗
(A1-4) ∂
∂t (εs.ρs.𝒗𝒗��⃗) + (∇.εs.ρs.𝒗𝒗��⃗.𝒗𝒗��⃗) =−εs∇P− ∇𝑃𝑃𝑠𝑠−β(𝒖𝒖��⃗ − 𝒗𝒗��⃗) +∇. (εs.τ�s) +εs.ρs.𝐠𝐠�⃗
where
(A1-5) τ�g=µg[∇.𝒖𝒖��⃗+ (∇����⃗.𝒖𝒖)T]−23∇.𝒖𝒖��⃗𝐼𝐼̿
(A1-6) τ�𝑠𝑠=µ𝑠𝑠[∇.𝒗𝒗��⃗+ (∇.𝒗𝒗��⃗)T] +�λ𝑠𝑠−23𝜇𝜇𝑠𝑠� ∇.𝒗𝒗��⃗𝐼𝐼̿
Granular temperature equation.
(A1-7)
3
2�
∂
54 Iranian Journal of Chemical Engineering, Vol. 16, No. 2 (Spring 2019) Table A2
Constitutive correlations of momentum. Solids pressure [31].
(A2-1)
Ps=ρsεsΘ+ 2g0ρsε2sΘ(1 + e𝑠𝑠)
Solids bulk viscosity [14].
(A2-2)
λs=43 εsρsdpg0(1 + e𝑠𝑠)�
Θ π
Solids shear viscosity.
(A2-3) µs=µs,col+µs,kin+µs,fr
Collisional viscosity [15].
(A2-4) µs,𝑐𝑐𝑐𝑐𝑠𝑠=4
5 εs2ρsdpg0(1 + e𝑠𝑠)�
Θ π
Kinetic viscosity [15].
(A2-5) µs,kin=10
96√Θπ
ρsdp
(1 + e𝑠𝑠)g0�1 +
4
5 g0εs(1 + e𝑠𝑠)�
2
Frictional viscosity [32].
(A2-6) µs,𝑓𝑓r=𝑃𝑃s sinφ
�4𝐼𝐼2𝐷𝐷
Diffusion coefficient of granular energy [15].
(A2-7)
𝑘𝑘Θ𝑠𝑠= 2 ε𝑠𝑠2ρsdpg0(1 + e𝑠𝑠)�
Θ π+
150√Θπρsdp
384(1 + e𝑠𝑠)g0�1 +
6
5 g0ε𝑠𝑠(1 + e𝑠𝑠)�
2
Collisional energy dissipation [31].
(A2-8)
𝛾𝛾Θ𝑠𝑠= 12(1−e𝑠𝑠2)
ε𝑠𝑠2ρ sg0
dp√π
Θ32
Radial distribution function [31].
(A2-9)
g0=�1−(
εs εs,max)
1 3�
−1
transfer of kinetic energy between phases [15].
(A2-10) ∅𝒈𝒈𝒈𝒈=−3βΘ
k−εTurbulence model. Gas viscosity.
(A2-11) µ𝑔𝑔 =µl,𝑔𝑔+µt,𝑔𝑔 , µt,𝑔𝑔=𝐶𝐶𝜇𝜇𝜀𝜀𝑔𝑔𝜌𝜌𝑔𝑔𝐾𝐾𝜖𝜖
Turbulance Kinetic energy.
(A2-12) 𝜕𝜕
𝜕𝜕𝜕𝜕 �𝜌𝜌𝑔𝑔𝐾𝐾�+∇. (𝜌𝜌𝑔𝑔𝒖𝒖��⃗𝐾𝐾) =∇.� µt,𝑔𝑔
𝜎𝜎𝑘𝑘 𝐾𝐾�+𝐺𝐺𝑘𝑘,g− 𝜌𝜌𝑔𝑔𝜖𝜖+𝜌𝜌𝑔𝑔Πk,g Turbulance dissipation rate.
(A2-13) 𝜕𝜕
𝜕𝜕𝜕𝜕 �𝜌𝜌𝑔𝑔𝜖𝜖�+∇. (𝜌𝜌𝑔𝑔𝒖𝒖��⃗𝜖𝜖) =∇.�µ𝜎𝜎t,𝑔𝑔 𝜖𝜖 𝜖𝜖�+
𝜖𝜖
𝐾𝐾(𝐶𝐶1𝜖𝜖𝐺𝐺𝑘𝑘,g− 𝐶𝐶2𝜖𝜖𝜌𝜌𝑔𝑔𝜖𝜖) +𝜌𝜌𝑔𝑔Πϵ,g where
(A2-14) 𝐺𝐺𝑘𝑘,g=µt,𝑔𝑔(∇𝒖𝒖��⃗+ (∇𝒖𝒖��⃗)𝑇𝑇):𝛻𝛻𝒖𝒖��⃗
𝐶𝐶𝜇𝜇= 0.09, 𝐶𝐶1𝜖𝜖= 1.44, 𝐶𝐶2𝜖𝜖= 1.92, 𝜎𝜎𝑘𝑘 = 1, 𝜎𝜎𝜖𝜖 = 1.3
References
[1] Dahl, S. R. and Hrenya, C. M., “Size
segregation in gas-solid fluidized beds
with continuous size distributions”,
Chem. Eng. Sci., 60, 6658 (2005).
Iranian Journal of Chemical Engineering, Vol. 16, No. 2 (Spring 2019) 55 A., “Hydrodynamic characteristics of
gas-solid tapered fluidized beds: Experimental studies and empirical
models”, Powder Technol., 283, 355
(2015),(DOI:10.1016/j.powtec.2015.06.0 02).
[3] Chew, J. W., Wolz, J. R. and Hrenya, C.
M., “Axial segregation in bubbling gas-fluidized beds with Gaussian and lognormal distributions of Geldart Group
B particles”, AIChE J., 56, 3049 (2010).
[4] Joseph, G. G., Leboreiro, J., Hrenya, C.
M. and Stevens, A. R., “Experimental segregation profiles in bubbling
gas-fluidized beds”, AIChE J., 53, 2804
(2007).
[5] Wu, S. Y. and Baeyens, J., “Segregation
by size difference in gas fluidized beds”,
Powder Technol., 98, 139 (1998).
[6] Rasul, M. G., Rudolph, V. and Carsky,
M., “Segregation potential in binary gas
fluidized beds”, Powder Technol., 103,
175 (1999).
[7] Van Wachem, B. G. M., Schouten, J. C.,
Van den Bleek, C. M., Krishna, R. and Sinclair, J. L., “CFD modeling of gas-fluidized beds with a bimodal particle
mixture”, AIChE J., 47, 1292 (2001).
[8] Olivieri, G., Marzocchella, A. and
Salatino, P., “A fluid-bed continuous classifier of polydisperse granular
solids”, J. Taiwan Inst. Chem. Eng., 40,
638 (2009).
[9] Muzzio, F. J., Shinbrot, T. and Glasser,
B. J., “Powder technology in the pharmaceutical industry: The need to
catch up fast”, Powder Technol., 124, 1
(2002).
[10]Zhang, Y., Jin, B. and Zhong, W.,
“Experimental investigation on mixing and segregation behavior of biomass
particle in fluidized bed”, Chem. Eng.
Process. Process Intensif., 48, 745
(2009).
[11]Zhang, Y., Zhao, Y., Lu, L., Ge, W.,
Wang, J. and Duan, C., “Assessment of polydisperse drag models for the size segregation in a bubbling fluidized bed
using discrete particle method”, Chem.
Eng. Sci., 160, 106 (2017).
[12]Chen, X. and Wang, J., “A comparison
of two-fluid model, dense discrete particle model and CFD-DEM method for modeling impinging gas–solid
flows”, Powder Technol., 254, 94 (2014).
[13]Herzog, N., Schreiber, M., Egbers, C.
and Krautz, H. J., “A comparative study of different CFD-codes for numerical simulation of gas–solid fluidized bed
hydrodynamics”, Comput. Chem. Eng.,
39, 41 (2012).
[14]Huilin, L., Yurong, H., Gidaspow, D.,
Lidan, Y. and Yukun, Q., “Size segregation of binary mixture of solids in
bubbling fluidized beds”, Powder
Technol., 134, 86 (2003).
[15]Gidaspow, D., Multiphase flow and
fluidization: Continuu and kinetic theory descriptions, Academic Press, (1994).
[16]Cooper, S. and Coronella, C. J., “CFD
simulations of particle mixing in a binary
fluidized bed”, Powder Technol., 151, 27
(2005).
[17]Huilin, L., Yunhua, Z., Ding, J.,
Gidaspow, D. and Wei, L., “Investigation of mixing/segregation of mixture particles in gas–solid fluidized beds”,
Chem. Eng. Sci., 62, 301 (2007).
[18]Azizi, S., Hosseini, S. H., Ahmadi, G.
and Moraveji, M., “Numerical simulation of particle segregation in bubbling
gas-fluidized beds”, Chem. Eng. Technol.,
33, 421 (2010).
56 Iranian Journal of Chemical Engineering, Vol. 16, No. 2 (Spring 2019) Fernandino, M. and Jakobsen, H. A.,
“Multi-fluid modeling of density segregation in a dense binary fluidized
bed”, Particuology, 10, 62 (2012).
[20]Formisani, B., Girimonte, R. and Longo,
T., “The fluidization pattern of
density-segregating binary mixtures”, Chem.
Eng. Res. Des., 86, 344 (2008).
[21]Geng, S., Jia, Z., Zhan, J., Liu, X. and
Xu, G., “CFD modeling the
hydrodynamics of binary particle mixture in pseudo-2D bubbling fluidized bed:
Effect of model parameters”, Powder
Technol., 302, 384 (2016).
[22]Feng, Y. Q., Xu, B. H., Zhang, S. J., Yu,
A. B. and Zulli, P., “Discrete particle simulation of gas fluidization of particle
mixtures”, AIChE J., 50, 1713 (2004).
[23]Norouzi, H. R., Mostoufi, N. and
Sotudeh-Gharebagh, R., “Effect of fines on segregation of binary mixtures in gas–
solid fluidized beds”, Powder Technol.,
225, 7 (2012).
[24]Schaafsma, S. H., Marx, T. and
Hoffmann, A. C, “Investigation of the particle flowpattern and segregation in tapered fluidized bed granulators”,
Chem. Eng. Sci., 61, 4467 (2006).
[25]Zhang, Y., Zhong, W., Jin, B. and Xiao,
R., “Mixing and segregation behavior in a spout-fluid bed: Effect of particle size”,
Ind. Eng. Chem. Res., 51, 14247 (2012).
[26]Santos, K. G., Francisquetti, M. C. C.,
Malagoni, R. A. and Barrozo, M. A. S.,
“Fluid dynamic behavior in a spouted bed with binary mixtures differing in
size”, Dry. Technol., 33, 1746 (2015).
[27]Johnson, P. C. and Jackson, R.,
“Frictional–collisional constitutive relations for granular materials, with
application to plane shearing”, J. Fluid
Mech., 176, 67 (1987).
[28]Li, T., Grace, J. and Bi, X., “Study of
wall boundary condition in numerical simulations of bubbling fluidized beds”,
Powder Technol., 203, 447 (2010).
[29]Bahramian, A., Olazar, M. and Ahmadi,
G., “Effect of slip boundary conditions on the simulation of microparticle velocity fields in a conical fluidized
bed”, AIChE J., 59, 4502 (2013).
[30]Zhang, Y., Zhao, Y., Lu, L., Ge, W.,
Wang, J. and Duan, C., “Assessment of polydisperse drag models for the size segregation in a bubbling fluidized bed
using discrete particle method”, Chem.
Eng. Sci., 160, 106 (2017).
[31]Lun, C. K. K., Savage, S. B., Jeffrey, D.
J. and Chepurniy, N., “Kinetic theories for granular flow: Inelastic particles in Couette flow and slightly inelastic
particles in a general flowfield”, J. Fluid
Mech., 140, 223 (1984).
[32]Schaeffer, D. G., “Instability in the
evolution equations describing
incompressible granular flow”, J. Differ.