Mining data from interactions with a
motivational-aware tutoring system using data visualization
GENARO REBOLLEDO-MENDEZ Educational Technology Lab, University of Veracruz,
Jalapa Veracruz, 91020, MEXICO [email protected]
BENEDICT DU BOULAY
Human Centered Technology Research Group University of Sussex,
Brighton, BN1 9QJ, UK [email protected]
ROSEMARY LUCKIN London Knowledge Lab,
Institute of Education University of London, London, WC1N 3QS, UK
EDGARD IVAN BENITEZ-GUERRERO
Educational Technology Lab, University of Veracruz,
Jalapa Veracruz, 91020, MEXICO [email protected]
____________________________________________________________
Tutoring systems are a common tool for delivering educational content and recent advances in this field include the detection of and reaction to learners’ motivation. A data set derived from interactions in a tutoring system and its motivationally-aware variant provided opportunities to discover patterns of behavior in connection with motivational feedback. The data collected consists of individual log files capturing the behavior of the learner during his/her interaction with the system. To mine this data, techniques were employed to discover patterns of interest when motivational scaffolding was provided by the tutoring system. A graph was constructed to visualize these patterns and to identify significant transitions derived from dyads of actions. This is a first step towards analyzing behaviors when motivational scaffolding is provided in a tutoring system. Work for the future consists of investigating the patterns’ impact on learning with the motivationally-aware tutoring system. Keywords: intelligent tutoring systems, motivation, pattern mining, likelihood metric
__________________________________________________________________________________________
1.INTRODUCTION
outcomes. For example, how does the behavior of learners change when scaffolding is introduced that is designed to increase their motivation? The overall method we used to explore this issue was to observe learners working with two variants of an existing tutoring system that differed only in terms of the nature of motivational scaffolding provided. This enabled us to address the following questions: 1) What are the behavioral patterns provoked by each variant of the system? 2) How do these patterns of behavior differ between the variants? And 3) How might these patterns, and their differences, be accounted for theoretically?
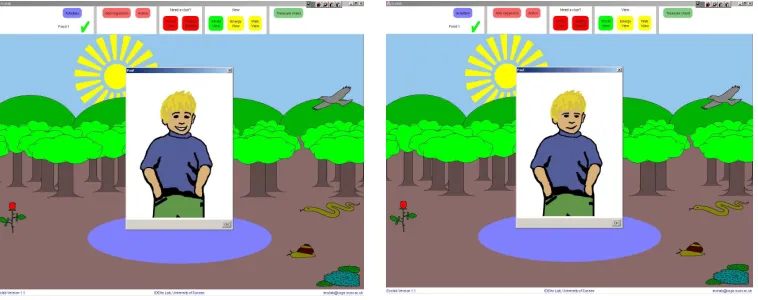
To throw light onto these issues, we created and utilized data sets derived from interactions with two tutoring systems: the Ecolab II [Luckin and Hammerton 2002] and its motivational variant the M-Ecolab [Rebolledo-Mendez et al. 2011]. Although both systems share the same scaffolding strategies to provide help at domain level, the M-Ecolab detects and responds to varying levels of the learner’s motivation [Rebolledo-Mendez et al. 2006]. Both systems simulate a simple ecological microworld laboratory within which children can learn about the concepts of food chains and food webs. The system poses simple problems about what kind of creature eats what (say) to which the learner can find the answers by exploring the microworld. The system engages learners by providing an interface with different living organisms (both plants and animals) and opportunities to explore their feeding relationships. The child is free to solve the problems suggested or can make his or her own choice of problem to work on. For example, given three organisms in the microworld (vole, snail and rose) the child could suggest a mistaken food chain such as “vole eats rose” to which the system reacts by providing help. The learning objective is to establish correct food chains such as “vole eats snail” that gradually grow into longer chains such as “vole eats snail and snail eats rose”. Later in the curriculum, chains can be developed into webs and these are depicted in the interface using arrows establishing the feeding connections among the organisms provided by the microworld. The system tracks the difficulty of the problems worked on, and the degree of help requested, by the learner and provides encouragement at the metacognitive level on these issues. The motivational variant additionally scaffolds learner-motivation by displaying on-screen pedagogic agents and by suggesting a number of further activities, as described later.
2007] and the other based on a probabilistic approach to dyads of actions [D’Mello et al. 2010].
The paper is organized into five sections. Section Two describes the theoretical foundation of this research and situates the work in the area. It also presents the definition of motivation that underpinned the development of the motivationally-aware variant of the tutoring system. Section Three presents two sets of analyses. The first analysis presents learner patterns of behavior and employed a code and count approach derived from previous evaluations of Ecolab II [Luckin and du Boulay 1999]. The second analysis utilized a probabilistic approach to characterize learner behaviors with both variants. Section Three describes how and why the scaffolding in the motivational variant assisted, and sometimes hindered, the learners and how their behavior differed from those working with the non-motivational variant. Finally, Section Four discusses the results and suggests implications for the design of motivational scaffolding in intelligent tutoring systems, and Section 5 draws conclusions and suggests further work.
2. BACKGROUND
According to [Lepper and Chabay 1988], tutoring systems should include motivational scaffolding including the recognition, maintenance and improvement of learner motivation. Various designs for motivational scaffolding within Intelligent Tutoring Systems (ITS) have been developed [Boyer et al. 2008; du Boulay et al. 2010; Rebolledo-Mendez, du Boulay and Luckin 2011]. However, one of the problems of designing motivational scaffolding is the definition of the term “motivation” itself. For example, motivation to learn has been understood as expectancy of success [Dweck 1975; Erez and Isen 2002], as rewards for effort [Deci 1975], based on attributions [Weiner 1984] or in having a mastery or challenge orientation [Ames 1992]. Some examples of motivational scaffolding include the use of focus of attention to detect frustration [Qu and Johnson 2005] and the selection of the next problem depending on an analysis both of the learner’s cognitive and motivational state [del Soldato and du Boulay 1995].
with a tutoring system [Arroyo et al. 2009], and for determining the optimal learner emotional state for effective interaction [Chaffar and Frasson 2004].
2.1 Motivation modeling in Ecolab II
Given the different approaches to studying motivation and its various interactions with affect, it was necessary to adopt a working definition of motivation in order to develop the motivational variant of the Ecolab II tutoring system. Motivation was (and is) understood in terms of the learner’s internal desire to learn, externally expressed by his or her degree of willingness to exert effort, to take on challenging activities and work without recourse to the ITS’s scaffolding facilities [Rebolledo-Mendez, du Boulay and Luckin 2006]. Because the goal was to develop a motivationally-aware variant of Ecolab II, the challenge was to integrate seamlessly new motivational features such as advice, engaging activities and praise with the existing metacognitive scaffolding of Ecolab II [Rebolledo-Mendez, du Boulay and Luckin 2011]. We faced both recognition and reaction problems. The recognition problem was about identifying the learner’s degree of motivation indirectly by considering interaction traits such as the amount of help requested or the types of activity selected, in accordance with the definition of motivation presented above.
The reaction problem was about deciding which new reactive and interactive elements to implement. Examples of different types of reaction include the use of politeness [Wang and Johnson 2008], empathy [McQuiggan and Lester 2007], reducing frustration [Kapoor et al. 2007], narratives for learning [McQuiggan et al. 2008; Robertson 2004] and employing animal companions as motivating strategy [Chen et al. 2005]. The possibilities to react to varying states of motivation or de-motivation constitute an interesting research area. Our approach was to employ on-screen pedagogical agents and to utilize variations in their tones of voice and facial expression to convey the tutoring system’s reaction to the learner’s changing effort, changing independence of the system’s help or changing choice of the degree of challenge in the activities chosen [Rebolledo-Mendez et al. 2006]. We hoped that feedback based on encouraging a positive attitude to learning would lead to positive affective reactions [Rodrigo et al. 2008].
chains and food webs to Year 5 learners (aged 10 years). Both Ecolab II and M-Ecolab employ the metaphor of a Science Laboratory where learners can perform actions with and between organisms added to the environment. The set of actions include moving, eating, eating and be eaten by. The learner can manipulate the environment and study the different outcomes of actions by switching between three different views: World View, Energy View and Web View. The World View presents the chosen organisms as being part of an ecosystem shown in terms of where they belong to in the simulated World. The Energy View presents the organisms in relation to the amount of energy they need to survive, suggesting the amount of food they need, depending on whether the organism is a plant or an animal. The Web View presents the organisms in the environment in relation to the place they belong to in the food chain. These views provide different perspectives for learning about food chains and food webs. The curriculum in the tutoring system consists of 10 learning nodes, organized into 3 different zones. The zones, and the nodes in them, are progressively more complex and go from simple one-to-one feeding relationships (Energy node, Zone 1) to complex food webs containing different food chains (Feeding 3 node, Zone 3). The scaffolding mechanisms at the domain level for both systems are based on a modeling approach in which help is provided depending on the perceived understanding and ability of the learner [Hammerton and Luckin 2001]. For example, less able learners receive more explicit feedback. Motivational scaffolding is based on the same principle, providing more motivational help to less motivated students.
system. All variables have a value between 0 and 1 and are constantly updated at interaction time. A calculation of the learner’s motivation is computed on exit from a learning node by averaging out the values of the variables during that node; the new values are then propagated through the learning curriculum. A learner’s motivation is considered low if it has a value between 0 and .5 and high if it has a value between .51 and 1.
2.2 Motivating feedback in M-Ecolab
The value of the learner’s motivation determines the reactions of the M-Ecolab including variations in the motivational feedback, tones of voice and facial expressions of the pedagogic agents (see Figure 1) as well as differentiation in the amount and periodicity of the scaffolding provided.
The nature of the spoken feedback depends on the learner’s motivation as assessed by the motivation model. If presented, these messages occur after all the activities in the node have been finished (post-activity), immediately before a new action is attempted in a new node (pre-activity) or at both times. The motivational feedback not only conveys praising messages (via changes in the agent’s tone of voice and facial expressions, see Table 1) but also may state the objectives for the new learning node or give advice on what to do in the new node. The advice is adjusted according to the cause of any de-motivation detected by the de-motivation model and can be related to excessive dependence on the system’s help or because of a lack of effortful behavior. For example, if the motivation model determines that the motivation is low because the learner lacks independence (excessive help requests) the message provided is: “in the next activities try to ask for less help”. Figure 1 and Table 1 show the type of changes conveyed by the agent when delivering motivational feedback.
seem strange to add a quiz as a motivating activity, but this was suggested as part of the early design work with children [Rebolledo-Mendez, du Boulay and Luckin 2011]. Although it might be possible for a child to get the quiz questions themselves wrong, the more light-hearted nature of the quiz compared to the more ‘serious learning work’ in the microworld was expected to mitigate this potential for further demotivation.
Figure 1 Facial expression variations
Table 1. Variations of agent’s feedback
Pre-activity feedback Post-activity feedback
Motivation Tone of voice Facial expression Tone of voice Facial expression
Low Normal Normal Worried Worried
High Normal Normal n/a n/a
Previous analyses of the results of using M-Ecolab have highlighted the benefits of the motivational scaffolding for help-seeking behavior [Rebolledo-Mendez et al. 2005] and for those initially de-motivated learners who followed the suggestions provided by M-Ecolab [Rebolledo-Mendez, du Boulay and Luckin 2006] and became more motivated. However these results were not accompanied by improvements in overall learning. This paper provides a further analysis of the data from the evaluation mentioned above.
3. MINING DATA GENERATED BY ECOLAB II AND M-ECOLAB
England in May 2005. To assess learning, an isomorphic test was used both before and immediately after the experiment. This test was the same as used in previous evaluations of earlier versions of Ecolab II [Luckin and du Boulay 1999; Luckin and Hammerton 2002]. The participants were 35 learners belonging to the three classes and they were randomly assigned to the two conditions. Scholastic Achievement Test1 scores (SATs)
were provided for all the participants prior to the experiment. Learners in the control condition (n=16) were asked to interact with Ecolab II whereas learners in the experimental condition (n=19) interacted with the motivational variant, M-Ecolab.
The learners interacted with one or other version of the system for approximately 80 minutes across two sessions with 1 week between sessions. The systems were installed on tablet computers that were used individually by learners during the experiment. The learners had not learnt the topic of food chains and food webs in their normal schooling before the experiment.
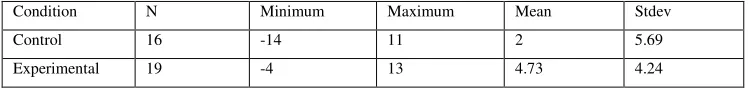
The difference in learning gain between the control and experimental conditions was not significant (t(33)=-1.628 p=.113), see Table 2 for descriptive statistics. During the interactions 70 log files (2 per session per learner) with 28279 lines in total and an average of 807.97 lines per learner were collected. This data is the basis for the data mining analyses presented next. First, a code and count analysis considering typified behaviors is presented followed by a pattern discovery approach.
Table 2 Learning gains: descriptive statistics
Condition N Minimum Maximum Mean Stdev
Control 16 -14 11 2 5.69
Experimental 19 -4 13 4.73 4.24
3.1 Behaviors
A first approach to mine the data obtained in the evaluation followed a similar methodology to that of Luckin and du Boulay [1999] consisting of exploring the behaviors observed during the interaction. Two types of profiles had been defined. Interaction profiles characterize the behavior of the learners during the interaction with the tutoring system and consist of 3 binary distinctions: busyness/quietness, exploration/consolidation and hopping/persistent. Collaboration profiles are more specific and refer to the quantity and quality of help that learners requested during their
1
interactions. These profiles have been found in previous studies [Hammerton and Luckin 2001; Luckin and du Boulay 1999] and represent typical interaction styles with Ecolab II and M-Ecolab.
The profiles were not identified dynamically during the interactions but post hoc, and help us understand the types of action and help-seeking behavior that learners undertook during the interaction. These profiles represent interaction traits and an individual learner may show more than one of these characteristics during the interactions rather than one-to-one correspondence between learners and profiles. To determine the profiles, a code and count approach was used in which instances of particular events were identified for individual learners. Since every profile is understood as having two poles (for example busy vs. quiet learners), minimum thresholds on the number of contributing events were established to determine whether learners belonged to one pole or another. The number of events was not proportionalized since we were interested in classifying behaviors following an established methodology and being consistent with previous evaluations of Ecolab II. Correlations between the total number of actions individually performed by the learners and the behaviors described in Sections 3.1.1 and 3.1.2 are not significant.
3.1.1 Interaction profiles
the current one and gave-up more times than average with an erroneous activity when challenged. The opposite of a Hopper is known as a Persister.
In the light of the motivational components of M-Ecolab, two new interaction profiles were defined. Quiz-seekers used the quiz an above average number of times; the opposite are referred to as Quiz-avoiders. A Challenge-seeker is a participant selecting above average levels of challenge. The opposite of Challenge-seeker is referred to as Challenge-avoider. Learners were classified considering the definitions presented above. A correlation table for all the interaction profiles is presented in Table 3.
Table 3 Significant correlations between different interaction profiles
Busy Quiet Explorers Consolidators Hopper Persistent Challenge seeker Challenge avoider
Busy -.905** .394* -.361*
.000 .019 .033 Quiet -.905**
.000
Explorers .394* -.977** .656** -.578**
.019 .000 .000 .000
Consolidators -.361* -.977** -.597** .537**
.033 .000 .000 .001
Hopper -.958**
.000
Persistent -.958**
.000
Challenge seeker .656** -.597** -.952**
.000 .000 .000
Challenge avoider -.578** .537** -.952**
.000 .001 .000
The mean learning gain for every interaction profile is provided in Table 4. For these analyses, learning gains were expressed as:
Learninggain
=
(
Posttest
−
Pr
etest
)
1
−
Pr
etest
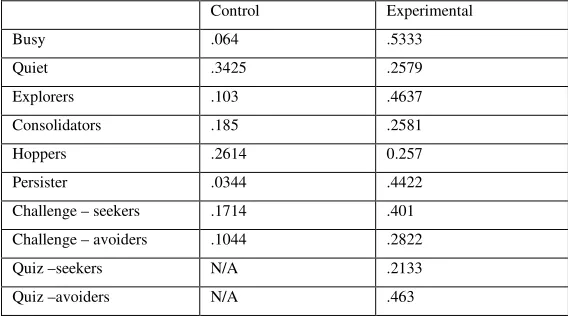
Equation 1Table 4 Learning gains considering interaction profiles
Control Experimental
Busy .064 .5333
Quiet .3425 .2579
Explorers .103 .4637
Consolidators .185 .2581
Hoppers .2614 0.257
Persister .0344 .4422
Challenge – seekers .1714 .401
Challenge – avoiders .1044 .2822
Quiz –seekers N/A .2133
Quiz –avoiders N/A .463
Between-subjects analyses showed that Busy learners in the experimental group had a significantly higher learning gain, (t(16)=-2.120, p=.050) than Busy learners in the control group. Persisters in the experimental group also had a significantly higher learning gain (t(16)=-2.443, p=.027) than Persisters in the control group. The difference in the learning gains between explorers in the two conditions (t(17)=-2.071, p=.055) approached significance. Other behaviors did not show significant differences between conditions. Further analyses showed that the total number of learning nodes in the curriculum successfully tackled by Explorers in the control group was greater than that of Explorers in the experimental group and that the difference was significant (t(16) = 2.219, p = .041).
3.1.2 Collaboration profiles
number of times the learner clicked on the help button. An above average number of requests for help was the criteria for a participant to be considered as using lots of collaborative support and little otherwise. Depth of support was calculated based on the four levels of help available in the tutoring system, an above average level of help (where help level 4 provided the answer) was the criteria for considering a learner requesting deep collaborative support, or shallow otherwise. These categories above were defined by Luckin (1998).
A new collaborative profile was defined considering the degree of use both of motivational and cognitive help. Motivational help is presented in two ways: automatically via the pre- and post-activity feedback or by the learner choosing to click on the “Paul” button. When a learner clicks on this button, a repetition of the pre-activity feedback is presented. Because M-Ecolab offers scaffolding both at domain level and at the motivational level, we counted the instances during which student requested both types of help. For example, clicking on the “Paul” button followed either by clicks on the “clue button” or by clicks on the organisms and then followed by another click on the “Paul” button. Those learners having an above average use of cognitive and motivational help were catalogued as high use of both types of help.
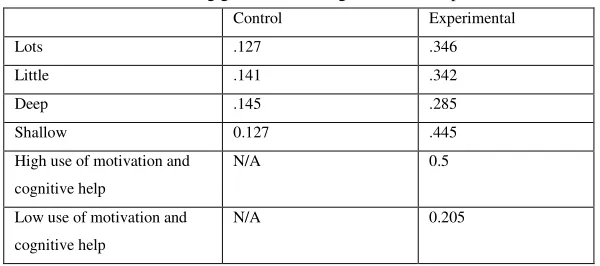
None of the correlations for the collaboration profiles with learning gains in each condition showed any significant result. But we also wanted to see whether any collaboration profiles were associated with significant differences in learning gain between the experimental and control groups. Table 5 shows each collaboration profile and its associated learning gains following Equation 1.
Table 5 Learning gains considering collaboration profiles
Control Experimental
Lots .127 .346
Little .141 .342
Deep .145 .285
Shallow 0.127 .445
High use of motivation and cognitive help
N/A 0.5
Low use of motivation and cognitive help
N/A 0.205
in the experimental condition had significantly higher learning gains (t(15) = -2.338, p = .034), than comparable learners in the control group. This was an unexpected result but could be explained as these learners did not depend on the ITS providing the answer to the problems encountered. Shallow help did not provide the answer and could have provoked these learners to put more effort onto solving the problems by themselves.
We also used the code and count approach to determine the degree to which the pedagogical agents influenced learners’ behavior in the experimental condition. This analysis consisted of looking at the effects of post-activity feedback only. This feedback suggested what the learner should do next and we measured the degree to which the learners followed this advice. This feedback was conveyed in a specific tone of voice and a specific facial expression depending on the learner’s motivation (see Figure 1 and Table 1). The form and content of these messages were selected in order to motivate the learner, encouraging her/him to put in more effort, be more independent or select more challenging activities.
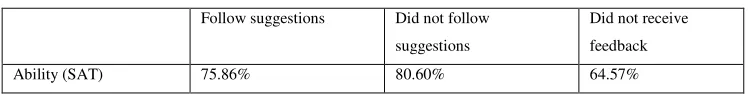
The logs were mined to identify three types of learner in the M-Ecolab condition: those who followed the agent’s advice at least once (n=7), those who never followed the advice (n=5), and those for whom the agent did not provide post-activity feedback (n=7). Table 6 presents the means for SAT scores for the three categories of participant.
Table 6 Means for SAT scores, M-Ecolab condition
Follow suggestions Did not follow suggestions
Did not receive feedback
Ability (SAT) 75.86% 80.60% 64.57%
3.2 Discovering patterns of behavior
The previous section has given some indication of the effects of the motivational scaffolding in M-Ecolab. However, one obvious concern with these results is that they do not describe the learners’ sequences of action in the M-Ecolab system (see Table 7). Instead, it has provided an idea of the sorts of behavior and their associated learning gains using a code and count perspective. In order to understand the actions and their transitions carried out by the learners, further analyses based on patterns of behavior are presented in the following sections.
To investigate the sequential behavioral patterns we employed the methodology presented in [D’Mello, Olney and Person 2010]. To this end, we identified transitions between pairs of actions possible in both Ecolab II and M-Ecolab and used the likelihood metric [D'Mello et al. 2007] to calculate the likelihood of each transition:
Equation 2
This formula measures the association between two actions, one (MT) preceding the
other (Mt+1); its magnitude indicates the strength of this relationship. Subsequent one
sample T-test were used to determine whether individual transitions are statistically greater than (excitatory), lesser than (inhibitory) or the same as the mean transition probability across all pairs of actions.
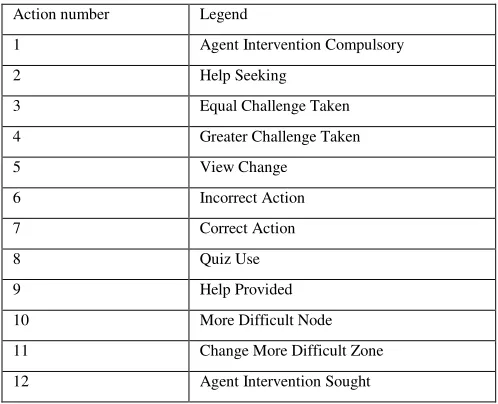
From the logs of the two sessions both from Ecolab II and M-Ecolab, time series were derived preserving the temporal order of activities. The actions considered for this analysis were related not only to motivation but also to help-seeking episodes and to correct and incorrect actions. Table 7 shows the set of twelve actions that were taken into account. This set of twelve actions is representative of the actions possible in the Ecolab II and M-Ecolab. An explanation of the actions is provided next.
indicates that the learner changed to a different view. Action 6 represents an incorrect action was chosen in the microworld such as “Heron eats Rose”. Action 7 represents a correct action was chosen in the microworld such as “Heron eats Grass snake”. Action 8 represents instances where the learner clicked on the quiz button; this Action was only possible in M-Ecolab. Action 9 indicates instances where the learning environment provided help following erroneous actions on the part of the learner. Actions 10 and 11 refer to instances where the learner moved to a more difficult node or to a more difficult zone of the learning curriculum. Finally, Action 12 consists of agent interventions activated by the learners themselves. Note that Actions 1, 8 and 12 were only possible in M-Ecolab but not in Ecolab II.
Table 7. Set of actions considered for the Ecolab II and M-Ecolab
Action number Legend
1 Agent Intervention Compulsory
2 Help Seeking
3 Equal Challenge Taken
4 Greater Challenge Taken
5 View Change
6 Incorrect Action
7 Correct Action
8 Quiz Use
9 Help Provided
10 More Difficult Node
11 Change More Difficult Zone
12 Agent Intervention Sought
3.2.1 Transitions in M-Ecolab
actions. The results of the series of T-tests showed there were 11 significant excitatory transitions at the .05 level, but no significant inhibitory transitions. Table 8 presents the means for the transitions and their directions.
3.2.1.1 Representing excitatory transitions in M-Ecolab
Table 8 Transitions in M-Ecolab, means and direction (excitatory or inhibitory). Shaded cells are significant at the .05 level
1 2 3 4 5 6 7 8 9 10 11 12
1 ---- 0.5263
2 ---- 0.3160 0.4659 0.0632
3 0.2632 ----
4 0.1053 ---- 0.0526
5 -0.0314 0.7960 ---- -0.0264 0.0380 0.0061 -0.0318 0.0001
6 -0.0388 -0.0222 ---- -0.0094 0.6697
7 0.2219 0.0949 0.3436 ---- 0.0006
8 0.0448 0.1078 0.0624 ---- 0.5576
9 0.3995 0.0330 0.3318 ----
10 ---- 0.3684
11 0.4737 ----
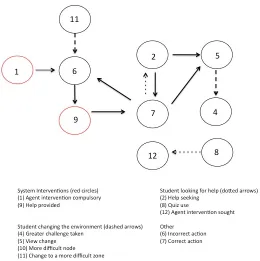
An analysis of the directed graph in Figure 2 shows that there are three main clusters of moves. The first cluster (top left) revolves around incorrect actions and is associated with both the learner changing to a more difficult zone (11) and compulsory agent interventions (1) as well as system interventions providing more help (9). This first cluster is related to an external stimulus to change since it appears to be related with changing to more difficult areas of the curriculum suggested by the pedagogical agent’s interventions. In other words, this type of behavior seems to be motivated by the microworld itself or externally from the learner. The second cluster (top right) connects correct actions (7) with help seeking (2), view changing (5) and greater challenge taking (4). This second cluster is related to an internal stimulus to change, as it seems to be related with help seeking episodes, constant view changes and a disposition to ask for more challenge (none of these being suggested by the agent). This behavior appears to be motivated by an internal desire (by looking for help or asking for more challenge) to solve the problems posed by the microworld. A third, separate cluster relates to quiz use (8) with sought agent interventions (12) and can be related to de-motivation given that learners appear to ask for motivational cues from the M-Ecolab.
In the external stimulus to change pattern, one sequence begins with compulsory agent interventions (1) prompting the learner to put in more effort, take a greater challenge or ask for less help. But then the learner engages in doing actions incorrectly (6) and getting help from the system (9). Such behavior caused the system to present more agent interventions (1) or prompted the learner to look for more difficult challenges or tackle more difficult zones (11), perhaps in an attempt to please the agent. A second sequence for this pattern commences with the learner selecting a more difficult zone (11) in the curriculum (more difficult zones include more difficult learning nodes) and is followed by a series of incorrect actions (6) with help provided by the system (9). Both sequences could be understood as an attempt on the part of learner to game the system [Baker et al. 2004] or to modify the microworld albeit more in a trial and error fashion.
An example of the behavior associated with the moves in the top left cluster in Figure 2 is provided next. The following lines from the logs present a male learner 1 (L1) interacting with the motivational agent Paul (P), moves 151 to 356:
151 L1 finishes current node of the curriculum, Predators and Prey
159 M-Ecolab suggest a less difficult node, Energy
163 L1 selects a more difficult node, different curriculum zone, Energy transfer 168 L1 chooses an incorrect action
171 M-Ecolab suggest deep help 172 L1 selects shallow help
173 L1 chooses an incorrect action, same action as before 174 M-Ecolab suggest deep help
175 L1 selects shallow help
176 – 357 L1 continues with a pattern of incorrect actions and shallow help
As the logs show, learner L1 seems to be engaged in an unconstructive loop because he selected a more difficult node than he could tackle. Since M-Ecolab would not allow changing nodes once a new has been started, the learner had to figure out, in a trial and error fashion, the way to finish this node of the curriculum. L1 engaged, arguably, in a de-motivated pattern of behavior as he engaged in a series of actions involving requests of the quiz or seeking agent interventions to provide information; this pattern eventually led him to complete the problems in the node successfully. Moves 358 - 372 depict this type of behavior:
358 L1 clicks on the agent button to get more information 359 L1 starts solving the quiz
360 L1 starts the quiz again 361 L1 chooses a correct action 362 L1 chooses a correct action
363 – 371 L1 chooses a number of correct actions
372 L1 finishes current node of the curriculum, Energy Transfer
Choosing more correct actions (7) also precedes incorrect actions (6), see the line joining the two patterns, which is a normal part of the learning process. Should the learner follow this pattern of behavior and choose incorrect actions, the system would provide more help automatically (9) eventually leading the learner to choose correct actions and engaging him/her in more help-seeking and exploratory behaviors. To illustrate this pattern, an excerpt from the logs presents learner 2 (L2), also a male learner, interacting with the system in moves 338 to 463:
338 - 363 L2 does a series of correct action 364 L2 cancels one action
365 L2 chooses a correct action 366 L2 chooses a correct action 367 L2 cancels one action
368 – 372 L2 does a correct, more complex action 373 L2 changes the view of the system
374 L2 changes the view of the system again 375 - 389 L2 does a correct action
390 L2 asks for help 391 L2 asks for help
392 L2 chooses correct action
393 – 460 L2 does a series of correct actions, changing views and requesting help 461 L2 requests change of node in the curriculum
462 L2 selects a slightly more difficult node, M-Ecolab does not suggest any node 463 – L2 continues interacting in the same fashion as before
3.2.2 Transitions in Ecolab II
All moves for the Ecolab II users were extracted considering the relevant actions presented in Table 7. Every learner session contained at least one sequenced pair of actions. There were 2088 moves in the 16 time series associated with Ecolab II (N=16), with an average of 109.89 moves (SD = 60.65) per time series, and with learners performing between 68 and 235 moves. We calculated the probability of moves using Equation 1, and tested the significance of 132 possible transitions; the results of the series of T-tests showed there were 8 significant excitatory transitions at the .05 level, 7 coincided with transitions in M-Ecolab, and no significant inhibitory transitions. Table 9 presents the means for the transitions and their directions.
3.2.2.1 Representing excitatory transitions in Ecolab II
Table 9 Transitions in Ecolab II, means and direction (excitatory or inhibitory). Shaded cells are significant at the .05 level
1 2 3 4 5 6 7 8 9 10 11 12
1 ----
2 ---- -0.0070 0.4034 0.4707
3 0.0905 ---- 0.0880 0.0387
4 ---- 0.1505 0.0266
5 -0.1410 0.8631 ---- -0.0008 0.0234 -0.0122
6 -0.1073 -0.0082 -0.0869 ---- -0.0163 0.5689 0.0019
7 0.1359 0.0014 0.1459 0.2686 ---- 0.0042
8 ----
9 0.2293 -0.0063 0.0055 0.4047 ---- 0.0111
10 ---- 0.1875
11 0.3125 ----
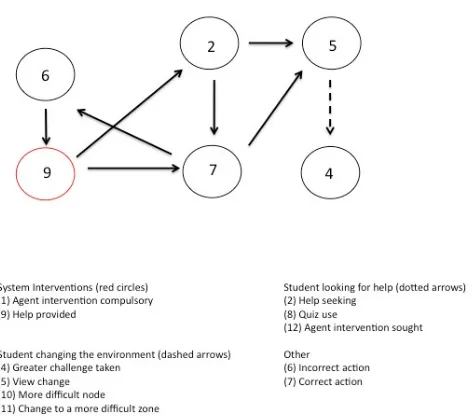
These transitions are 2 5, 2 7, 5 4, 6 9, 7 5, 7 6 and 9 7. Four transitions are exclusive to M-Ecolab: 1 6, 7 2, 8 12 and 11 6. One transition is unique to Ecolab II learners: 9 2. It is interesting to notice that not all the transitions exclusive to M-Ecolab are directly related to motivational scaffolding. This suggests that transitions 7 2 (correct action followed by help seeking) and 11 6 (changing to a
more difficult zone followed by an incorrect action) might be provoked by the motivational scaffolding present in M-Ecolab. All the other transitions also correspond to the two behaviors identified previously for M-Ecolab: external and internal stimulus to change. As with M-Ecolab, we determined the incidence of each pattern of behavior in Ecolab. To that end, the number of moves in each of the two patterns and their percentage were calculated. The external stimulus to change pattern (associated with performing an incorrect action followed by help provision), occurred 781 times (51.61%), the internal stimulus to change occurred 662 times (43.75%) and the pattern associated with help provided followed help-seeking exclusive for Ecolab II learners, occurred only 70 times (4.62%). This suggests that in the use of Ecolab II, the majority of transitions consisted of behaviors associated with an external stimulus to change, a similar result to that of M-Ecolab learners.
Previous papers reporting the effects of Ecolab II, have associated learning gains with higher degrees of help-seeking and challenge taking [Luckin and Hammerton 2002] particularly for lower ability learners. It is worth highlighting that the intrinsic stimulus to change behavior reported in this paper involves both help-seeking and challenge-taking (dyads 7 2 and 5 4) and could account for the learning gains previously reported.
4. GENERAL DISCUSSION
The first series of analyses in this paper has added to the previous evaluations of the Ecolab II/M-Ecolab tutoring systems [Hammerton and Luckin 2001; Luckin and du Boulay 1999; Rebolledo-Mendez, du Boulay and Luckin 2006] and identified certain behaviors patters that were associated with better learning gains in M-Ecolab than in Ecolab-II.
significance (t(17)=-2.071, p=.055). Explorers are characterized as participants who requested more challenge (Action 4) than was suggested by the system and also changed view more often (Action 5) and traversed more curriculum zones (Action 11). Being Busy is highly correlated with being an Explorer (Pearson’s = .394, p = .019). This correlation is not surprising since being Busy involves an above average number of actions of any type, including those dyads of actions associated with being Explorer (5
4 and 11 6). The percentage of actions involving these dyads accounted for 8.74% of
the actions in M-Ecolab and 13.48% in Ecolab II.
Because of the significant difference in learning gains between Busy students in the two conditions we looked at sequences involving Busy behavior (7 6, 6 9 and 9
7). These dyads account for 50% of the total of actions in M-Ecolab and 36.05% in Ecolab II. This implies that the total actions involving Busy and Explorer behaviors account for 58.74% of M-Ecolab actions and 44.79% of Ecolab II actions. Since we only considered dyads of action that represent significant transitions in both M-Ecolab and Ecolab II it may be possible that the significant difference in learning gains observed in Busy learners might be due to one or a combination of these dyads present in the M-Ecolab. Although the dyad 11 6 (involving changing between curriculum nodes) is
only a significant transition in M-Ecolab, it only accounts for 0.6 % of the total of actions which might not explain the effect on learning gains. This behavior suggests, however, that the motivating scaffolding encouraged learners to change between different zones of the curriculum. Future studies will be aimed at identifying the dyads of actions in association with the Busy profile that might explain the learning gains observed in M-Ecolab learners.
Persistent learners in M-Ecolab also showed a significant difference in learning gains when compared with similar learners in Ecolab II (t(16)=-2.443, p=.027). Persistent learners are characterized as performing actions 5, 6 and 10. Since no transition involving Action 10 is significant in our analyses, we focused on Actions 5 and 6. Significant dyads involving these actions include 5 4, 6 9 and 9 7. The combined percentage of these dyads is 38.75% of actions for M-Ecolab learners and 37.07% for Ecolab II learners. The similarity in these combined percentages, suggests that the actions in relation to being persistent that accounted for the observed learning gains, might have involved another action. Action 2 is associated with these dyads and is related to recovering from errors. Given that dyads 7 2 are only present in 12.24% of actions in
significant dyads in relation to being Persister is 50.99 % for M-Ecolab learners and 40.30% for Ecolab II students. The combined effect when we add dyads 7 2 for
M-Ecolab students suggests that the presence of motivational facilities might have encouraged learners to look for help after a correct action has been made, perhaps leading to greater learning gains than similar students in Ecolab II.
This result is counterintuitive but may be associated with the motivational agent Paul’s positive affect. As suggested in [Erez and Isen 2002], positive affect (a combination of normal tone of voice and a normal facial expression involving a smile) played a key role in provoking the learners to increase their effort by looking for more help even if they did not need it, as dyad 7 2 implies. This learner behavior is
explained because in M-Ecolab the variable Effort was modeled as a ratio between correct actions and help seeking. As such, more correct actions while using less help meant a more effortful behavior. Given that this was not the case, as evidenced by the frequency of the dyad 7 2, this implies that the motivational agent Paul was asking the learner to put more effort while at the same time conveying positive affect. Expectancy also might have played a role. Defined as the perceived probability that effort will lead to improved performance [Vroom 1964]), Paul’s expectancy coupled with positive affect conveyed the idea that making less errors and looking for help as often as possible even if no mistake had been made was a good behavior. The benefits of looking for help have been well documented [Nelson-Le Gall and Resnich 1998] including previous Ecolab II evaluations [Luckin and Hammerton 2002].
M-Ecolab learners who requested shallow help had a significantly greater learning gain than comparable learners in Ecolab II (t(15) = -2.338, p = .034), and highlights the benefit of using positive affect to encourage the learner to put in more effort. Furthermore, the results suggest superficial help (not the whole answer as it was the case for learners receiving deep help) is preferable when no mistakes have been made by the learner.
The analyses of dyads as opposed to individual actions acknowledge the temporality of the actions, a trait that is lost in code and count approaches. Preserving the temporality of the actions makes the pattern discovery process easier, especially as this methodology enables a visual account of the significant transitions found in the data. In our case, the resulting directed graph was simple and finding clusters was an intuitive process.
This paper has described the use of a data-mining technique to compare learners’ behaviors across two systems that differed only in their motivational scaffolding.
This methodology helped us identify new patterns of behavior in the use of Ecolab II and M-Ecolab: external and internal stimuli to change. We characterize these as follows, though follow-up work interviewing learners would be needed to establish the validity of these characterizations. A learner with an external stimulus to change might interpret success in relation to his/her ability while striving for positive judgments and avoiding negative ones. The presence or absence of motivational facilities might lead this learner to behave in a way that is conducive of learning gains (i.e. being Persister and look for shallow help). The pattern discovered in this analysis portrays a behavior based on moving to more difficult Zones of the learning curriculum while having erroneous actions and system interventions both agent-based and assistance via help messages. Given that the agent-based feedback encourages the learners “to put in more effort”, learners behaving with an external stimulus to change pattern might tend to display an attitude that would not be dissimilar to a performance oriented behavior [Ames 1984]. Another motivational construct that might be associated with this pattern is Expectancy [Vroom 1964]. The internal stimulus to change could be related to a mastery-orientation [Ames 1984] as learners could have a disposition to regard success as the acquisition of more skills, understanding content and making learning the goal itself; this pattern of behavior would include voluntarily asking for help (dyad 7 2), while constantly changing views and asking for more challenge. In this situation, Expectancy might also play a key role and the employment of motivational strategies could lead to an increase in this type of behavior.
Future research could shed light onto whether the patterns reported in this paper (external and internal stimulus to change) could be related to motivational constructs such as performance-oriented or mastery-oriented behaviors. Work for the future also consists of empirically proving these patterns can be triangulated with test-based diagnoses, discovering more complex behaviors using graph algorithms, the programming of automatic detectors of these patterns and an investigation of the impact of these patterns on learning gains.
REFERENCES
AMES, C.A. 1984. Competitive, cooperative, and individualistic goal structures: A cognitive-motivational analysis. In Research on motivation in education: Vol 1. Student motivation, C.A. AMES AND R. AMES Eds. Academic Press, San Diego, CA, 177-207.
AMES, C.A. 1990. Motivation: What Teachers Need to Know. Teachers College Record 91, 409-421.
AMES, C.A. 1992. Classrooms: goals, structures, and student motivation. Journal of Educational Psychology 48, 261-271.
ARROYO, I., COOPER, D.G., BURLESON, W., WOOLF, B.P., MULDNER, K. AND CHRISTOPHERSON, R. 2009. Emotion Sensors Go To School. In Artificial Intelligence in Education, AIED IOS Press, Brighton, UK.
ASPINWALL, N.G. 1998. Rethinking the role of positive affect in self-regulation.
Motivation and Emotion, 22, 1-32.
BAKER, R.S., CORBETT, A.T., KOEDINGER, K.R. AND WAGNER, A.Z. 2004. Off-task behavior in the cognitive tutor classroom: when students "game the system". In
Proceedings of the SIGCHI conference on Human factors in computing systems ACM,
Vienna, Austria, 383-390.
BOYER, K.E., PHILLIPS, R., WALLIS, M., VOUK, M. AND LESTER, J. 2008. Balancing Cognitive and Motivational Scaffolding in Tutorial Dialogue. In Intelligent Tutoring Systems (ITS) 2008, B.W.E. AL. Ed. Springer-Verlag, Montreal Canada,
239-249.
CALVO, R.A. AND D'MELLO, S.K. 2011. New Perspectives on Affect and Learning Technologies. Springer.
CHAFFAR, S. AND FRASSON, C. 2004. Inducing Optimal Emotional state for learning in Intelligent Tutoring Systems. In ITS 2004, J.C. LESTER AND R.M. VICARI Eds.
Springer, 45-54.
CHEN, Z.H., DENG, Y.C., CHOU, C.Y. AND CHAN, T.W. 2005. Motivating learners by nurturing animal companions: My-pet and Our-pet. In 12th Artificial Intelligence in Education: Supporting Learning through Intelligent and Socially Informed Technology,
C.-K. LOOI, G. MCCALLA, B. BREDEWEG AND J. BREUKER Eds. IOS Press, 136-143.
D'MELLO, S., TAYLOR, R.S. AND GRAESSER, A. 2007. Monitoring affective trajectories during complex learning. In 29th Annual Cognitive Science Society, D.S.
MCNAMARA AND J.G. TRAFTON Eds. Cognitive Science Society, Austin, TX, 203-208.
D’MELLO, S., OLNEY, A. AND PERSON, N. 2010. Mining Collaborative Patterns in Tutorial Dialogues. Journal of Educational Data Mining 2, 1-37.
DEL SOLDATO, T. AND DU BOULAY, B. 1995. Implementation of motivational tactics in tutoring systems. International Journal of Artificial Intelligence in Education 6,
337-378.
DU BOULAY, B., AVRAMIDES, K., LUCKIN, R., MARTINEZ-MIRON, E., REBOLLEDO-MENDEZ, G. AND HARRIS, A. 2010. Towards Systems That Care: A Conceptual Framework based on Motivation, Metacognition and Affect. International Journal of Artificial Intelligence in Education 20.
DWECK, C.S. 1975. The role of expectations and attributions in the alleviation of learned helplessness. Journal of Personality and Social Psychology 31.
EREZ, A. AND ISEN, A. 2002. The influence of positive affect on the components of expectancy motivation. Journal of Applied Psychology 87, 1055–1067.
HAMMERTON, L. AND LUCKIN, R. 2001. How to help? Investigating children's opinions on help. In Workshop on Help Provision and Help-Seeking in Interactive Learning Environments, 10th International Conference on Artificial Intelligence in Education, San Antonio, TX, 22-33.
KAPOOR, A., BURLESON, W. AND PICARD, R.W. 2007. Automatic Prediction of Frustration. International Journal of Human-Computer Studies 65, 724-736.
LEPPER, M.R. AND CHABAY, R.W. 1988. Socializing the intelligent tutor: bringing empathy to computer tutors. In Learning Issues for Intelligent Tutoring Systems, H.
MANDL AND A.M. LESGOLD Eds. Springer-Verlag, New York, 242-257.
LUCKIN, R. AND DU BOULAY, B. 1999. Ecolab: The Development and Evaluation of a Vygostskian Design Framework. International Journal of Artificial Intelligence 10,
198-220.
LUCKIN, R. AND HAMMERTON, L. 2002. Getting to know me: helping learners understand their own learning needs through Metacognitive scaffolding. In 6th International Conference on Intelligent Tutoring Systems, S.A. CERRI, G.
GOUARDÈRES AND F. PARAGUAÇU Eds. Springer, Biarritz, France, 759-771. MARTINEZ-MIRON, E., HARRIS, A., BOLAY, B.D., LUCKIN, R. AND YUILL, N. 2005. The role of learning goals in the design of ILE's: Some issues to consider. In 12th Conference on Artificial Intelligence in Education, C.-K. LOOI, G. MCCALLA, B.
BREDEWEG AND J. BREUKER Eds. IOS Press, 427-434.
MCQUIGGAN, S.W. AND LESTER, J.C. 2007. Modeling and evaluating empathy in embodied companion agents. International Journal of Human-Computer Studies 65,
348-360.
MCQUIGGAN, S.W., ROWE, J.P. AND LESTER, J.C. 2008. The effects of empathetic virtual characters on presence in narrative-centered learning environments. In
Proceedings of the Proceeding of the twenty-sixth annual SIGCHI conference on Human factors in computing systems, Florence, Italy2008 ACM.
NELSON-LE GALL, S. AND RESNICH, L. 1998. Help seeking, achievement motivation and the social practice of intelligence in school. In Strategic help-seeking. Implications for learning and teaching, S.A. KARABENICK Ed. Lawrence Erlbaum
Associates, Inc., London.
OHLSSON, S., DI EUGENIO, B., CHOW, B., FOSSATI, D., LU, X. AND KERSHAW, T. 2007. Beyond the code-and-count analysis of tutoring dialogues. In Artificial Intelligence in Education, R. LUCKIN, K. KOEDINGER AND J. GREER Eds. IOS
Press, Los Angeles, CA.
QU, L. AND JOHNSON, W.L. 2005. Detecting the Learner's Motivational States in An Interactive Learning Environment. In AIED 2005, C.-K. LOOI, G. MACCALLA, B.
REBOLLEDO-MENDEZ, G. 2003. Motivational Modelling in a Vygotskyan ITS. In
11th International Conference on Artificial Intelligence in Education, U. HOPPE, F.
VERDEJO AND J. KAY Eds. IOS Press, Sydney, Australia, 537-538.
REBOLLEDO-MENDEZ, G., DU BOULAY, B. AND LUCKIN, R. 2005. "Be bold and take a challenge": Could motivational strategies improve help-seeking? In 12th International Conference on Artificial Intelligence in Education, C.-K. LOOI, G.
MCCALLA, B. BREDEWEG AND J. BREUKER Eds. IOS Press, Amsterdam, 459-466. REBOLLEDO-MENDEZ, G., DU BOULAY, B. AND LUCKIN, R. 2006. Motivating the Learner: An Empirical Evaluation. In Intelligent Tutoring Systems, M. IKEDA, K.
ASHLEY AND T.-W. CHAN Eds. Springer Berlin / Heidelberg, 545-554.
REBOLLEDO-MENDEZ, G., DU BOULAY, B. AND LUCKIN, R. 2006. Motivating the learner: an empirical evaluation. In 8th International Conference on Intelligent Tutoring Systems, M. IKEDA, K. AHSLEY AND T.W. CHAN Eds. Springer-Verlag,
545-554.
REBOLLEDO-MENDEZ, G., DU BOULAY, B. AND LUCKIN, R. 2011. Designing Adaptive Motivational Scaffolding for a Tutoring System. In New Perspectives on Affect and Learning Technologies, R.A. CALVO AND S. D’MELLO Eds. Springer, New York.
ROBERTSON, J. 2004. An analysis of the narrative features of computer games authored by children. In Narrative and Interactive Learning Environments, P. BRNA Ed.,
Edinburgh, Scotland, 33-40.
RODRIGO, M.M.T., REBOLLEDO-MENDEZ, G., BAKER, R.S.J.D., BOULAY, B.D., SUGAY, J.O., LIM, S.A.L., ESPEJO-LAHOZ, M.B. AND LUCKIN, R. 2008. The Effects of Motivational Modeling on Affect in an Intelligent Tutoring System. In
Proceedings of the 16th International Conference on Computers in Education ICCE 2008, TaiPei, Taiwan2008.
VROOM, V.H. 1964. Work and motivation. Wiley, New York.
WANG, N. AND JOHNSON, W.L. 2008. The Politeness Effect in an Intelligent Foreign Language Tutoring System. In Intelligent Tutoring Systems, ITS'08 Springer, Montreal,
Canada.