DEMOGRAPHIC RESEARCH
VOLUME 35, ARTICLE 38, PAGES 1135
−
1148
PUBLISHED 20 OCTOBER 2016
http://www.demographic-research.org/Volumes/Vol35/38/ DOI: 10.4054/DemRes.2016.35.38
Descriptive Finding
Multiple imputation for demographic hazard
models with left-censored predictor variables:
Application to employment duration and fertility
in the EU-SILC
Michael S. Rendall
Angela Greulich
©2016 Michael S. Rendall & Angela Greulich.
This open-access work is published under the terms of the Creative Commons Attribution NonCommercial License 2.0 Germany, which permits use, reproduction & distribution in any medium for non-commercial purposes, provided the original author(s) and source are given credit.
1 Introduction 1136
2 Data and method 1137
2.1 Multiple Imputation (MI) for left-censored observations 1138
3 Results 1140
4 Conclusion 1145
5 Acknowledgements 1146
Multiple imputation for demographic hazard models with
left-censored predictor variables: Application to employment duration
and fertility in the EU-SILC
Michael S. Rendall1
Angela Greulich2
Abstract
OBJECTIVE
A common problem when using panel data is that individuals’ histories are incompletely known at the first wave. We demonstrate the use of multiple imputation as a method to handle this partial information, and thereby increase statistical power without compromising the model specification.
METHODS
Using EU-SILC panel data to investigate full-time employment as a predictor of partnered women’s risk of first birth in Poland, we first multiply imputed employment status two years earlier to cases for which employment status is observed only in the most recent year. We then derived regression estimates from the full, multiply imputed sample, and compared the coefficient and standard error estimates to those from complete-case estimation with employment status observed both one and two years earlier.
RESULTS
Relative to not being full-time employed, having been full-time employed for two or more years was a positive and statistically significant predictor of childbearing in the multiply imputed sample, but was not significant when using complete-case estimation. The variance about the ‘two or more years’ coefficient was one third lower in the multiply imputed sample than in the complete-case sample.
1 Department of Sociology and Maryland Population Research Center, University of Maryland, College Park,
USA. E-Mail: [email protected].
CONTRIBUTION
By using MI for left-censored observations, researchers using panel data may specify a model that includes characteristics of state or event histories without discarding observations for which that information is only partially available. Using conventional methods, either the analysis model must be simplified to ignore potentially important information about the state or event history (risking biased estimation), or cases with partial information must be dropped from the analytical sample (resulting in inefficient estimation).
1. Introduction
A frequently encountered problem when using panel data for demographic applications is that the individual’s history is incompletely known at the first wave. It is common practice, but inadvisable (Özcan, Mayer, and Luedicke 2010), to ignore this left censoring. We suggest that multiple imputation (MI), a method typically used to handle non-response (Johnson and Young 2011), can be a general solution to the problem of left censoring in demographic hazard modeling. The Missing at Random (MAR) assumption needed for multiple imputation (Little and Rubin 2002) is sometimes problematic for data that is missing because of non-response (Allison 2001). The MAR assumption is much less likely to be problematic in the case of left censoring, however, as the missingness occurs “by design” (Raghunathan and Grizzle 1995). The ‘design’ in the case of panel surveys refers to the start date of the panel.
In a previous treatment of this problem in the US Panel Study of Income Dynamics, Moffitt and Rendall (1995) used a maximum likelihood approach to combine left-censored and non-left-censored spells of single motherhood in separate components of the likelihood. The statistical equivalence of maximum likelihood and multiple-imputation (MI) approaches to handling missing data has been noted (Schafer and Graham 2002; White and Carlin 2010). This equivalence assumes ‘congenial’ imputation and analysis models in which the variables used in the imputation model are also those used in the analysis model, and that the number of imputations 𝑚 → ∞ (Meng 1994: 543‒544). Moreover, 𝑚 need not be very large (Schafer and Graham 2002). Our choice of 𝑚 = 20 in the present study reflects the relatively high proportion of person-year cases that are ‘incomplete’ (almost 50%).
structures. To our knowledge, MI has not previously been used to address the left-censoring problem. We evaluate gains to using MI this way in a simple example in which women in a panel survey contribute either one or two waves of employment status as a predictor of partnered first birth.
2. Data and method
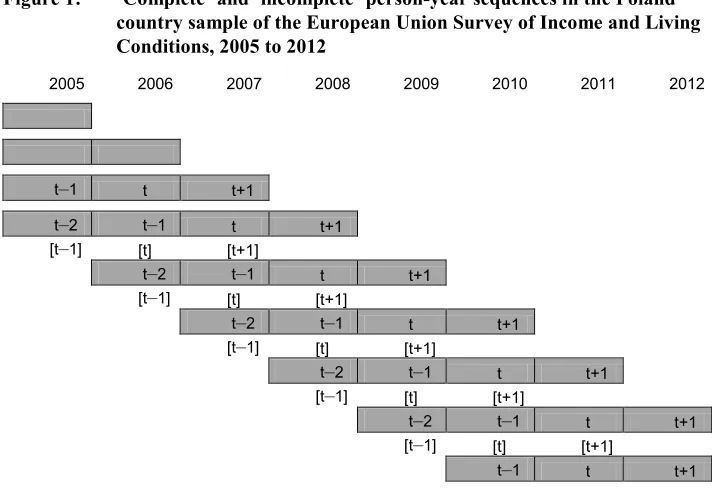
We use the Poland country sample of the European Union Survey of Income and Living Conditions (EU-SILC), a group of more than 30 comparable country surveys (Eurostat 2011). The standard longitudinal implementation of the EU-SILC consists of a rotational panel in which individuals are observed annually for a period of four years, with four rotation groups present in each year. Poland’s SILC follows this design. Selection into the sample occurs annually, beginning in 2005, and each new sample after 2005 is followed for four waves (see Figure 1). We choose Poland due to its relatively large number of observations, reflecting its larger population size than most EU-SILC countries, and because its wave-to-wave retention rate of approximately 90% is among the highest of the EU-SILC countries (Iacovou, Kaminska, and Levy 2012).
Figure 1: ‘Complete’ and ‘incomplete’ person-year sequences in the Poland country sample of the European Union Survey of Income and Living Conditions, 2005 to 2012
2005 2006 2007 2008 2009 2010 2011 2012
t‒1 t t+1
t‒2 t‒1 t t+1 [t‒1] [t] [t+1]
t‒2 t‒1 t t+1 [t‒1] [t] [t+1]
t‒2 t‒1 t t+1 [t‒1] [t] [t+1]
t‒2 t‒1 t t+1 [t‒1] [t] [t+1]
t‒2 t‒1 t t+1 [t‒1] [t] [t+1]
t‒1 t t+1
Note: ‘Complete’ person-year sequences include observation at t‒2; ‘incomplete’ sequences do not.
2.1 Multiple Imputation (MI) for left-censored observations
subscripts throughout, and 𝑁2 ‘incomplete’ observations {𝑌𝑡, 𝐸𝑡−1, 𝑍𝑡−1}𝑗=1𝑁2 . Figure 1 illustrates the five types of complete observations and the seven types of incomplete observations in our data. Whether a woman’s birth-exposure year is preceded by one or two years of observed employment status depends on when she was sampled into the panel. Therefore employment status two years before birth exposure is reasonably treated as missing at random (MAR).
We first use the set of complete observations to estimate an imputation equation for 𝐸𝑡−2. We use sequential MI (Raghunathan et al. 2001) that allows for the imputation of binary, count, or continuous variables. In our case, the imputed variable is binary, and therefore logistic regression is appropriate:
𝐿𝑂𝐺𝐼𝑇[Pr{𝐸𝑡−2= 1|𝐸𝑡−1, 𝑍𝑡−1, 𝑌𝑡}] = 𝛾0+ 𝛾1𝐸𝑡−1+𝛾2𝑍𝑡−1+ 𝛾3𝑌𝑡 (1)
We then apply random draws from the posterior distribution of parameter estimates 𝛾�0, 𝛾�1, 𝛾�2, 𝛾�3 to the incomplete data {𝐸𝑡−1, 𝑍𝑡−1, 𝑌𝑡}𝑗=1𝑁2 to derive an arbitrarily large number of values 𝑚 of 𝐸𝑡−2 (we set 𝑚 = 20) to produce completed data {{𝑌𝑡(𝑘), 𝐸𝑡−2(𝑘), 𝐸𝑡−1(𝑘), 𝑍𝑡−1(𝑘)}𝑗=1𝑁2 }𝑘=1𝑚 . Following that, we concatenate the complete data {𝑌𝑡, 𝐸𝑡−2, 𝐸𝑡−1, 𝑍𝑡−1}𝑖=1𝑁1 to each instance of completed data and estimate the analysis equation 𝑚 times. These 𝑚 estimates are combined using standard multiple-imputation algorithms, or “combining rules” (Little and Rubin 2002), to produce a set of parameters with standard errors that adjust for the uncertainty introduced by imputation of 𝐸𝑡−2 to the incomplete person-year observations. These combining rules account for the additional uncertainty due to imputation by adding ‘between imputation’ variance to ‘within imputation’ variance, thereby avoiding the underestimation of variance of single-imputation analysis (Zhang 2003: 584). This sequence of procedures is performed with standard package software SAS PROC MI and PROC MIANALYZE (SAS Institute 2008a, 2008b; code to replicate the analysis using STATA’s mi procedure is provided online). This software uses unweighted data in the imputation equation. Consistent with common econometric practice for complete-data analysis, and to avoid issues of ‘uncongeniality’ between imputation and analysis models, our analysis equation is also unweighted.
both times 𝑡 − 2 and 𝑡 − 1 is required, since 𝐷1≡ {1 𝑖𝑓 𝐸𝑡−1= 1 𝑎𝑛𝑑 𝐸𝑡−2= 0} and
𝐷2≡ {1 𝑖𝑓 𝐸𝑡−1= 1 𝑎𝑛𝑑 𝐸𝑡−2= 1}. The analysis model we estimate is then:
𝐿𝑂𝐺𝐼𝑇[Pr{𝑌𝑡= 1|𝐷2, 𝐷1, 𝑍𝑡−1}] = 𝛽0+ 𝛽1𝐷1+𝛽2𝐷2+ 𝛽3𝑍𝑡−1 (2)
The expected efficiency gain in the estimation of 𝛽3 when multiply imputing employment status at 𝑡 − 2, relative to estimation with the complete data only, is approximately equal to the fraction of observations with missing imputing employment status at 𝑡 − 2 (Little 1992, White and Carlin 2010, and see discussion in Rendall and
Greulich 2014). The expected efficiency gains in the estimation of 𝛽1 and 𝛽2 are a priori unknown, but are of particular interest here. Because durations 𝐷1 and 𝐷2 are
composites of employment status in times 𝑡 − 2and 𝑡 − 1, they are constructed partially
from observed data and partially from multiply imputed data. Therefore the reductions in 𝑉𝑎𝑟(𝛽̂1) and 𝑉𝑎𝑟(𝛽̂2) may be substantial, even though less than the reductions in
𝑉𝑎𝑟(𝛽̂3). For 𝑉𝑎𝑟(𝛽̂3), the corresponding variable vector 𝑍 is entirely constructed from
observed data, and therefore the reduction in variance is expected to approximate the fraction missing.
3. Results
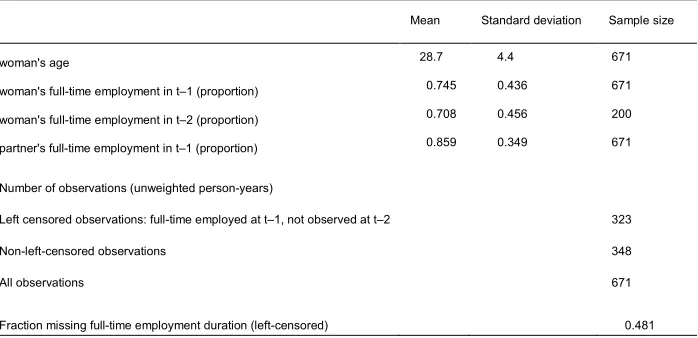
Table 1: Descriptive statistics and numbers of observations, partnered
parity-0 Polish women ages 18‒39, 2005‒2012
Descriptive statistics (person-years, weighted)
Mean Standard deviation Sample size
woman's age 28.7 4.4 671
woman's full-time employment in t‒1 (proportion) 0.745 0.436 671
woman's full-time employment in t‒2 (proportion) 0.708 0.456 200
partner's full-time employment in t‒1 (proportion) 0.859 0.349 671
Number of observations (unweighted person-years)
Left censored observations: full-time employed at t‒1, not observed at t‒2 323
Non-left-censored observations 348
All observations 671
Fraction missing full-time employment duration (left-censored) 0.481
Note: all observations have valid values of age and partner’s employment status at t-1 and of birth between t and t+1. All statistics are weighted.
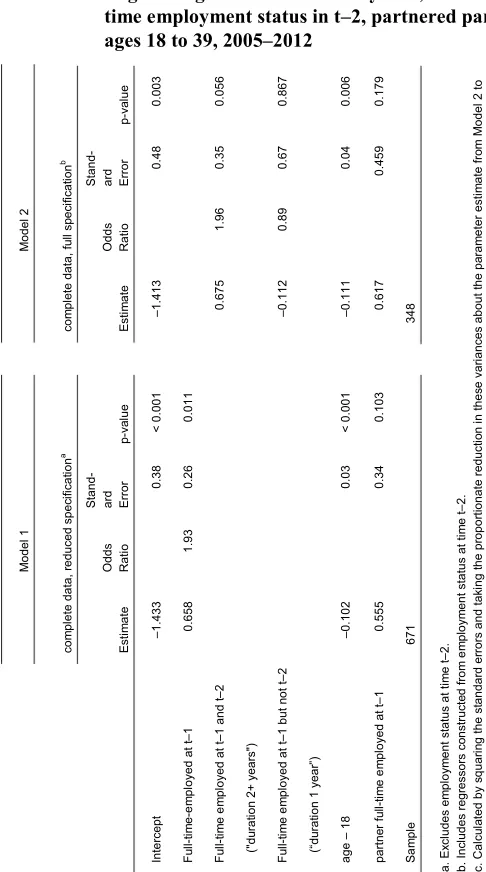
Table 2: Logistic regressions of birth in year t, before and after imputing
full-time employment status in t‒2, partnered parity‒0 Polish women
ages 18 to 39, 2005‒2012
M odel 1 M odel 2 com pl et e dat a, reduc ed s pec ifi cat ion a com pl et e dat a, fu ll s pec ifi cat ion b Es tim ate O dds Ra tio St and -ar d Erro r p-val ue Es tim ate O dds Ra tio St and -ar d Erro r p-val ue Int er cept ‒1. 433 0. 38 < 0. 001 ‒1. 413 0. 48 0. 003 Ful l-t ime -e m pl oy ed at t‒ 1 0. 658 1. 93 0. 26 0. 011 Ful l-t im e e m pl oy ed at t‒
1 and t
‒2 0. 675 1. 96 0. 35 0. 056 (" du rat ion 2+ y ear s" ) Ful l-t im e e m pl oy ed at t‒ 1 but n ot t‒ 2 ‒0. 112 0. 89 0. 67 0. 867 (“ du rat ion 1 year ”) age ‒ 18 ‒0. 102 0. 03 < 0. 001 ‒0. 111 0. 04 0. 006 par tne r f ul l-t im e e m pl oy ed at t‒ 1 0. 555 0. 34 0. 103 0. 617 0. 459 0. 179 Sa mp le 671 348 a. E xc ludes em pl oy m ent s tat us at ti m e t ‒2. b. Inc ludes regr es sor s c ons truc te d f rom e m pl oy m ent s tat us at ti m e t ‒2. c. C al cu la ted by s quar in g t he s tandar d er ror s and t ak ing t he pr opor tionat e reduc tio n in t hes e v ar ianc es about the pa ram et er e st im at e f ro m M odel 2 t o M odel 3. Al l r eg res si ons a re unw ei ght ed. Sour ce : E ur op ean U ni on S ur vey of Inc om
e and Li
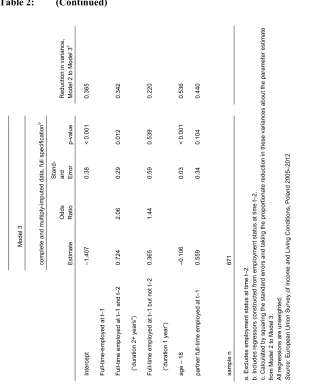
Table 2: (Continued) M odel 3 R educ tion i n va rianc e, M odel 2 t o M odel 3 c com pl et
e and m
ul tipl y-im put ed dat a, fu ll s pec ifi cat io n b Es tim ate O dds Ra tio St and -ar d Erro r p-val ue Int er cept ‒1. 407 0. 38 < 0. 001 0. 365 Ful l-t ime -e m pl oy ed at t‒ 1 Ful l-t im e e m pl oy ed at t‒
1 and t
‒2 0. 724 2. 06 0. 29 0. 012 0. 342 (“ du rat ion 2+ y ear s” ) Ful l-t im e e m pl oy ed at t‒ 1 but n ot t‒ 2 0. 365 1. 44 0. 59 0. 539 0. 220 (” du rat ion 1 year ”) age ‒ 18 ‒0. 106 0. 03 < 0. 001 0. 536 par tne r f ul l-t im e e m pl oy ed at t‒ 1 0. 559 0. 34 0. 104 0. 440 sam pl e n 671 a. E xc ludes em pl oy m ent s tat us at ti m e t ‒2. b. Inc ludes regr es sor s c ons truc te d f rom e m pl oy m ent s tat us at ti m e t ‒2. c. C al cu la ted by s quar in g t he s tandar d er ror s and t ak ing t he pr opor tionat e reduc tio n in t hes e v ar ianc es about the pa ram et er e sti m ate from M odel 2 t o M ode l 3. Al l r eg res si ons a re unw ei ght ed. Sour ce : E ur op ean U ni on S ur vey of Inc om
e and Li
Regression results are presented in Table 2. In Model 1, in which all 671 person-years are used, but for which the specification of employment status is reduced to one prior year, being full-time employed at 𝑡 − 1 is associated with a 1.93 greater odds of
giving birth. This result is consistent with Matysiak’s (2009) finding using retrospective data, in which she also used employment status only in the year immediately before exposure. She estimated the model without partner’s employment status among her predictors, explaining (p. 260) that partner data was missing for more than half the female sample. Our specification instead takes advantage of the partner employment-status variable, which is both better obtained from a panel survey than a retrospective survey and has strong justification in the theory and evidence on couple fertility (e.g., Vignoli, Drefahl, and De Santis 2012).
Model 2 distinguishes between 1 year only and 2+ years of full-time employment, and is estimated with the 348 person-years for which these durations are observed in the complete data. Having been full-time employed 2 or more years (‘duration 2+’) is associated with a 1.96 greater odds of giving birth compared to not having been full-time employed in the prior year (‘duration 0’). This is statistically significant, however, only at the 0.10 level (p = 0.06). Having become full-time employed only in the most recent year (‘duration 1’) is not a statistically significant predictor of giving birth. These results are suggestive of duration of full-time employment being a critical factor in predicting a partnered woman’s first birth. When restricted to using complete data, however, we are only able to include employment duration in the model at the cost of eliminating almost half of an already small sample, thereby rendering both employment-duration coefficients non-significant at conventional thresholds.
Our preferred model is Model 3, in which all 671 person-year observations are used, and with a specification of full-time employment that distinguishes 0, 1, and 2+ years’ duration. This is the model made possible by multiply imputing values of the full-time-employed variable for the 323 person-years in which the woman was observed as full-time employed at time 𝑡 − 1and was not observed at time 𝑡 − 2. Being full-time
one year. These reductions are substantially less than the fraction missing, as expected, but are nevertheless quite large.
4. Conclusion
In short panels and in panels that sample from populations rather than from cohorts, such as the EU-SILC of the present study and the U.S. Survey of Income and Program Participation (SIPP, US Census Bureau 2014), left censoring is present for almost every individual. Supplementary histories collected retrospectively may be much less accurate than panel collection (Jacobs 2002; Kyyra and Wilke 2014), and not all characteristics of state or event histories will be covered; for example, parent-child co-residence. We proposed MI as a general solution to the problem of left censoring in demographic hazard modeling. As an example, we examined the gains that may be realized by multiply imputing a single additional year of employment status before the first wave of the panel. This was the maximum possible amount of imputation in the four-wave EU-SILC. Nevertheless, it allowed us to conduct more effectively a simple test of the hypothesis that women are more likely to begin childbearing after first obtaining stable employment (Santarelli 2011). Using conventional methods to conduct this test would have required using only half the number of person-year observations that we were able to use in our multiply imputed data analysis.
Substantively, we found that being full-time employed for two or more years was strongly predictive of a birth. Only in the analysis with the multiply imputed data, however, was the coefficient statistically significant at conventional levels (p < .05). The magnitude of variance reduction about this coefficient in the multiply imputed data was around one-third. To have obtained a variance reduction of this size represents a substantial payoff to having multiply imputed the source variable (employment status at
5. Acknowledgements
References
Allison, P.D. (2001). Missing Data. Thousand Oaks: Sage Publications.
Eurostat (2011). 2008 Comparative EU final quality report. Version 3, July 2011. Iacovou, M., Kaminska, O., and Levy, H. (2012). Using EU-SILC data for
cross-national analysis: Strengths, problems and recommendations. Institute for Social and Economic Research Working Paper Series No. 2012-03, Essex University. Jacobs, S.C. (2002). Reliability of recall and unemployment events using retrospective
data. Work, Employment, and Society 16(3): 537‒548. doi:10.1177/09500170 2762217489.
Johnson, D.R. and Young, R. (2011). Toward best practices in analyzing datasets with missing data: Comparisons and recommendations. Journal of Marriage and Family 73(5): 926‒945. doi:10.1111/j.1741-3737.2011.00861.x.
Kyyra, T. and Wilke, R.A. (2014). On the reliability of retrospective employment information in European Household Panel data. Empirical Economics 46(4): 1473‒1493.doi:10.1007/s00181-013-0718-1.
Little, R.J.A. (1992). Regression with missing X’s: A review. Journal of the American Statistical Association 87(420): 1227‒1237.doi:10.2307/2290664.
Little, R.J.A., and Rubin, D.B. (2002). Statistical analysis with missing data (2nd Edition). Hoboken: Wiley.doi:10.1002/9781119013563.
Matysiak, A. (2009). Employment first, then childbearing: Women’s strategy in post-socialist Poland. Population Studies 63(3): 253‒276. doi:10.1080/0032472090 3151100.
Meng, X-L. (1994). Multiple-imputation inferences with uncongenial sources of input.
Statistical Science9(4): 538‒573.
Moffitt, R.A. and Rendall, M.S. (1995). Cohort trends in the lifetime distribution of female family headship in the U.S., 1968‒85. Demography 32(3): 407‒424. Özcan, B., Mayer, K.U., and Luedicke, J. (2010). The impact of unemployment on the
Raghunathan, T.E. and Grizzle, J.E. (1995). A split questionnaire survey design.
Journal of the American Statistical Association 90(429): 54‒63. doi:10.1080/ 01621459.1995.10476488.
Raghunathan, T.E., Lepkowski, J.M., van Hoewyk, J., and Solenberger, P. (2001). A multivariate technique for multiply imputing missing values using a sequence of regression models. Survey Methodology 27(1): 85‒95.
Rendall, M.S. and Greulich, A. (2014). Multiple imputation for demographic hazard models with left-censored predictor variables. Maryland Population Research Center Working Paper PWP-MPRC-2014-011.
Santarelli, E. (2011). Economic resources and the first child in Italy: A focus on income and job stability. Demographic Research 25(9): 311‒336. doi:10.4054/DemRes. 2011.25.9.
SAS Institute (2008a). The MI Procedure. Chapter 54 SAS/STAT 9.2 User Guide, 2nd Ed.
SAS Institute (2008b). The MIANALYZE Procedure. Chapter 55 SAS/STAT 9.2 User Guide, 2nd Ed.
Schafer, J.L. and Graham, J.W. (2002). Missing data: Our view of the state of the art.
Psychological Methods7(2): 147‒177.doi:10.1037/1082-989X.7.2.147.
US Census Bureau (2014). SIPP Introduction and History. http://www.census. gov/programs-surveys/sipp/about/sipp-introduction-history.html#.
[Accessed October 13, 2014]
Vignoli, D., Drefahl, S., and De Santis, G. (2012). Whose job instability affects the likelihood of becoming a parent in Italy? A tale of two partners. Demographic Research 26(2): 41‒62. doi:10.4054/DemRes.2012.26.2.
White, I.R. and Carlin, J.B. (2010). Bias and efficiency of multiple imputation compared with complete-case analysis for missing covariate values. Statistics in Medicine 29(28): 2920‒2931.doi:10.1002/sim.3944.