DEMOGRAPHIC RESEARCH
VOLUME 35, ARTICLE 52, PAGES 1537
−
1548
PUBLISHED 8 DECEMBER 2016
http://www.demographic-research.org/Volumes/Vol35/52/ DOI: 10.4054/DemRes.2016.35.52
Descriptive Finding
Lifetime probabilities of multigenerational
caregiving and labor force attachment in
Australia
E. Anne Bardoel
Robert Drago
©2016 E. Anne Bardoel & Robert Drago.
This open-access work is published under the terms of the Creative Commons Attribution NonCommercial License 2.0 Germany, which permits use, reproduction & distribution in any medium for non-commercial purposes, provided the original author(s) and source are given credit.
1 Introduction 1538
2 Prior studies 1538
3 Data and methods 1539
4 Results 1541
5 Discussion 1545
Descriptive Finding
Lifetime probabilities of multigenerational caregiving
and labor force attachment in Australia
E. Anne Bardoel1 Robert Drago2
Abstract
BACKGROUND
An aging population has increased the prevalence of multigenerational caregiving (MGC), defined as unpaid care for an adult while having a dependent child in the household. Policymakers are simultaneously promoting labor force attachment in response to population aging, which may conflict with MGC status.
OBJECTIVE
This research provides estimates of the probability of MGC status and its relationship to labor force attachment.
METHODS
A balanced panel of respondents from nine waves (2005−2013) of the Household, Income and Labour Dynamics in Australia (HILDA) survey data has been used to estimate point-in-time and lifetime probabilities of MGC status for women and for men, and rates of labor force participation and part-time employment prior to, during, and after MGC status.
RESULTS
Few adult women (2.3%) and men (1.1%) report MGC status at any point in time. Estimated lifetime probabilities of MGC status are 57.1% for women and 34.6% for men, and rates are higher for women and men out of the labor force pre-MGC status. Comparing pre- and post-MGC periods, women’s labor force participation rises by an estimated 9 percentage points, mainly due to an increase in part-time employment.
1 Associate Professor of Management, Monash University, Department of Management, Victoria, Australia.
E-Mail: [email protected].
CONCLUSION
A majority of Australian women and many Australian men can expect to take on multigenerational caregiving responsibilities during their lifetime. While long-term labor force participation is not reduced by these responsibilities, they may increase the concentration of women in part-time employment.
1. Introduction
Australia shares the US trends of an aging population (ABS 2013), in tandem with delayed childbearing (ABS 2008) and a long-term increase in women’s labor force participation (ABS 2006), as well as continuing gender inequality in the allocation of unpaid care work (Hoenig and Page 2012). These trends may be expanding the prevalence of multigenerational caregiving (MGC), defined as unpaid care for an adult while having a dependent child in the household. Estimates of point-in-time and lifetime probabilities of MGC status do not currently exist for Australia, nor do we know how MGC status is related to labor force participation. Relevant estimates are provided here, using nine waves of the Household, Income and Labour Dynamics in Australia (HILDA) survey data.
The estimates are useful for two reasons. First, MGC status is likely to be rare at a point in time but ultimately affect a large proportion of adults, and particularly women (Folbre 1994; Lachance-Grzela and Bouchard 2010); prior studies do not address this possibility. Second, Australian policymakers have responded to population aging with efforts to promote labor force participation among unpaid caregivers (Cooper and Baird 2015), as in many developed nations (McDonald 2013). Estimates of labor force attachment prior to, during, and after leaving MGC status can shed light on the severity of any problem.
2. Prior studies
care (ignoring financial support), Pierret’s study found that 4.1% of women held MGC status. While screening to identify 309 dual-earner couples holding MGC status, Hammer and Neal (2008) found between 9% and 13% of US households with employed adults aged 30 years and above caring for children and aging parents or parents-in-law. DePasquale et al. (2014) defined MGC status as having children 18 years or younger living in the household and providing unpaid care of at least three hours per week to an adult relative. Using a sample of US women employed by nursing homes, they found 14% exhibited MGC characteristics. All but one of these studies imposed an age restriction on the sample: two restricted the sample to women, only one (Pierret) used a representative sample, and none used longitudinal data.
For Australia, the 2012 Survey of Disability, Ageing and Carers found 2.7 million adults (12% of the population) providing informal assistance to an older person or someone with a disability or a long-term health condition, although care for children was not studied (ABS 2012).
3. Data and methods
This study uses household panel data from Waves 5−13 (2005−2013) of the HILDA survey. Described more completely in Watson and Wooden (2012), and previously analyzed in this journal by Parr (2011), the HILDA survey data is collected annually from a nationally representative sample of private household members. Of the initial sample of 13,969 adults surveyed in 2001, reinterview rates were 68.8% as of 2011, after excluding individuals who had moved overseas or were lost due to death or incarceration. Reinterview rates were low for young respondents, migrants, and individuals of Aboriginal or Torres Islander background (Wooden and Watson 2007). All analyses are performed separately for men and for women, using a balanced panel of 4,482 women and 3,799 men responding in every wave from 2005 through 2013, aged 16 years and above. Responding person weights (hhwtrp) for each wave are used in all analyses.
For MGC status, dependent children are indicated by the presence of a child under the age of 16 years living in that household at least half of the time. Care for dependent children is assumed to represent caregiving responsibilities. A study analyzing the 2006 Australian Time Use Study revealed that Australian mothers spent more time than fathers on childcare, but that father levels were similar to those found in Denmark, where levels of gender equity tend to be superior to Australia (Craig and Mullan 2011).
more activities of daily living (ADLs), such as bathing, dressing, or eating, three mobility-related disabilities (e.g., moving around at home), and helping with communication difficulties.
Respondents identify their relationship with the relevant individual or individuals, such that care for any related or unrelated adult is included. MGC status is defined for specific types of adult care relationships (e.g., parents, parents-in-law) and for parents who care for any adult.
The pooled cross-sectional estimates are for general MGC status and for major subcategories (the omitted categories are small).
The main estimates of interest require identifying how the hazard (i.e., probability) function for MGC status changes as individuals age, to locate a) the age of maximum hazard, b) the hazard rate at that age, and c) the cumulative hazard of entering MGC status by age 65 years. Subsamples are analyzed instead of covariates, which allows the hazard function to change flexibly across the subsamples. Estimating the hazard function requires parameters, so most non-parametric approaches (e.g., Cox models) cannot be used (Qi 2009), which leads to accelerated failure (AF) models (Qi 2009). Following Abadi et al. (2012), we test the common loglog specification (e.g., Wickrama et al. 2001), against the generalized gamma distribution, estimating each with streg in Stata 14.1. The latter involves estimating a constant, β, a hazard scale term (σ ), and a hazard shape term (k). Depending upon the estimates of the scale and shape terms, the generalized gamma devolves into an exponential (σ=k=1), Weibull (k=1), lognormal (k=0), or gamma (σ=1) distribution. As in Abadi et al. (2012), we select the best fit using the lowest values for the Akaike information criterion (AIC) and the Bayesian information criterion (BIC).
If there is unmeasured heterogeneity, a simple frailty model (Gutierrez 2002) can be specified with either a gamma distribution, for frailty that is uniform with age, or an inverse Gaussian distribution, for frailty that is declining with age. We test for simple frailty, using the AIC and BIC criteria both to gauge whether frailty exists and, if it does, to select between the two distributions.
Labor force attachment is indicated by labor force participation and part-time employment.Attachment estimates are for a) respondents in 2005 who entered MGC status during 2006−2013, b) those same respondents during MGC status (multiple periods included), and c) 2013 respondents who left MGC status by that year, regardless of entry year, which maximizes pre- and post-MGC sample sizes. Long-term effects are tested by applying a logistic regression comparing the 2005 and 2013 pre- and post-MGC samples on rates of labor force participation and part-time employment, using Stata’s logistic command. Control variables are included for respondents aged 50 years and over, for respondents aged 60 years and over, and for the presence of dependent children in the household (for 2005 or 2013).
4. Results
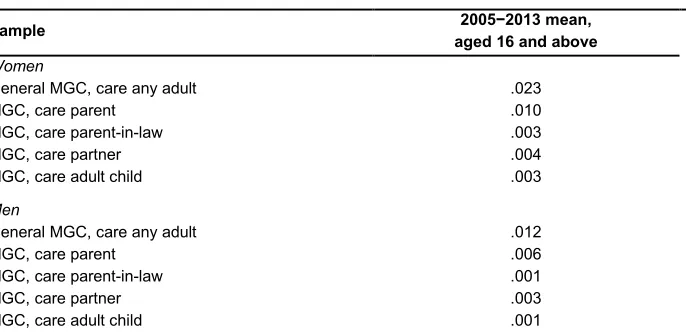
Cross-sectional estimates of MGC status are provided in Table 1. Considering figures in the first numeric column, MGCs caring for a parent account for around half of all cases, for both women and men, with the next largest group involving care for a partner or spouse. Women are almost twice as likely as men to hold MGC status, but it is rare, with the largest figure involving 2.3% of adult women holding MGC status at any given time.
Table 1: Cross-sectional estimates of MGC status, 2005−2013
Sample aged 16 and above 2005−2013 mean,
Women
General MGC, care any adult .023
MGC, care parent .010
MGC, care parent-in-law .003
MGC, care partner .004
MGC, care adult child .003
Men
General MGC, care any adult .012
MGC, care parent .006
MGC, care parent-in-law .001
MGC, care partner .003
MGC, care adult child .001
log-log specification, with the smallest relative difference for men (e.g., AIC=1,116,429 generalized gamma; AIC=3,304,915 log-log). Using the generalized gamma, the AIC and BIC values were slightly lower for gamma frailty (e.g., for women, AIC=1,433,752 gamma, and AIC=1,471,013 inverse Gaussian), so the generalized gamma specification with gamma frailty is reported.
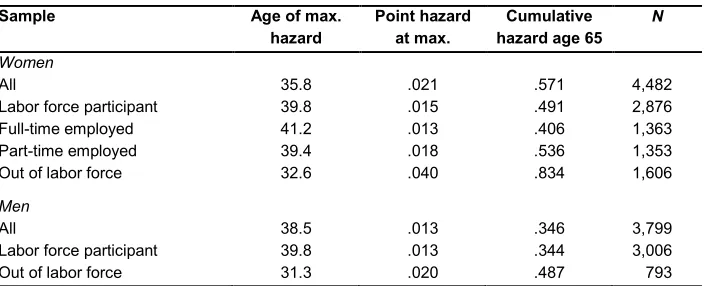
Results yielding a significant σ are provided in Table 2. For the entire sample, women are most likely to hold MGC status at 35.8 years of age, and that age is 38.5 years for men, with point hazard during those years of 2.1% for women and 1.3% for men, as shown in Figure 1.
Figure 1: MGC hazard for women and men
Not shown in the figure, by age 65, the cumulative probability of MGC status is an estimated 57.1% for women and 34.6% for men. For women, being in the labor force and particularly being full-time employed as of 2005 will raise the age when they are most likely to report MGC status, while being out of the labor force reduces that age to below 33 years. Labor force participation drops the cumulative hazard at age 65 by eight percentage points, with the low full-time employment hazard explaining that decline, while women out of the labor force pre-MGC yield a figure of 83.4%.
0 0.005 0.01 0.015 0.02 0.025
20 25 30 35 40 45 50 55 60 65
M
G
C Ha
za
rd
Age in Years
Women
For men, most estimates did not achieve significance. Nonetheless, the pattern of significant results echoes that for women, with being out of the labor force reducing the age of maximum hazard by 7.2 years below the overall estimate, and raising the cumulative hazard by 14.1 percentage points.
Table 2: AF results: MGC status, maximum, point, and cumulative hazard, 2005−2013
Sample Age of max.
hazard Point hazard at max. hazard age 65 Cumulative N
Women
All 35.8 .021 .571 4,482
Labor force participant 39.8 .015 .491 2,876
Full-time employed 41.2 .013 .406 1,363
Part-time employed 39.4 .018 .536 1,353
Out of labor force 32.6 .040 .834 1,606
Men
All 38.5 .013 .346 3,799
Labor force participant 39.8 .013 .344 3,006
Out of labor force 31.3 .020 .487 793
Note: Characteristics as of 2005.
Returning to the original data, pre-, during, and post-MGC labor force attachment estimates are reported in Table 3. Comparing pre- and during estimates, labor force participation drops slightly for women and by 4 percentage points for men, with rates of part-time employment rising by 5.5 and 4.6 percentage points for women and men respectively. Comparing pre- and post-MGC status estimates, women’s labor force participation rises by 11.9 and men’s falls by 4.7 percentage points, with rates of part-time employment rising slightly during MGC.
Table 3: Mean labor force participation and part-time employment, 2005 pre-, during, and 2013 post-MGC status, women and men
Variables/Categories Women Men
Labor Force Participation
2005 pre-MGC .574 .843
During MGC .561 .802
2013 post-MGC .693 .796
Part-time Employment
2005 pre-MGC .266 .057
During MGC .331 .103
2013 post-MGC .335 .110
N, pre-MGC 298 182
N, during MGC 722 359
N, post-MGC 333 187
Note: N is number of observations, single observations per respondent 2005 and 2013, multiple observations per respondent during MGC.
Table 4: Logistic estimates of labor force attachment pre- and post-MGC status, 2005 and 2013, women, OR (95% CI in parentheses) Variables Labor Force Participation Part-time Employment
Post-MGC 1.09***
(1.04−1.15)
1.07** (1.01−1.13)
Age>49a .733
(.428−1.26) (.7131.22 −2.08)
Age>59b .300***
(.123−.733) (.188.469 −1.17)
Child<16c .846
(.526−1.36) (1.091.83** −3.09)
Constant .000***
(.000−.000) (.000.000** −.000)
χ2 18.46*** 11.96**
N 628 630
Notes: Sample uses 2005 and 2013 observations on women who entered MGC status after 2005 and left MGC status by 2013. a Dummy variable for all respondents aged 50 years and above as of 2005 or 2013.
5. Discussion
The point estimates of MGC status in Australia are, as expected, low (Table 1). While Hammer and Neal (2008) found 9% to 13% of US employed couple households caring for children and aging parents or parents-in-law for a sample at least 30 years of age, adding our MGC figures for care for parents or parents-in-law only yields an estimate of 1.3% in Australia, albeit for a sample ranging to 16 years of age. DePasquale et al. (2014) found 14% of women fitting the broadest definition of MGC status used here (except excluding non-relative care), while the Australian estimate is 2.3%. These differences are consistent with Pilkauskas and Martinson’s (2014) finding that Australian children are less than half as likely as their US counterparts to live in a three-generation household.
Nonetheless, most Australian women and many Australian men can expect to take on MGC status by the age of 65, and the figures might be higher in the USA. However, these conclusions come with two important caveats. First, the evidence (Table 1) suggests that restricting the definition of MGC status to care providers for children and parents or aging adults, as in “sandwich generation” studies (e.g., Hammer and Neal 2008), would substantially reduce the lifetime probability of holding MGC status. Second, due to data limitations, grandparents caring for grandchildren and an adult were excluded from this study; arguably, that group should be included, which would raise the lifetime probability for holding MGC status.
For researchers, the findings suggest that MGC status ultimately affects far more people than earlier estimates suggest. Further, the age restrictions found in some earlier studies of MGC status are unwarranted, given that the ages when MGC status most often occurs are typically well below the Pierret (2006) cut-off of 45 years (Table 2).
References
AARP, American Association of Retired People (2001). In the middle: A report on multi-cultural boomers coping with family and aging issues. Washington, DC: AARP.
Abadi, A., Amanpour, F., Bajdik, C., and Yavari, P. (2012). Breast cancer survival analysis: Applying the generalized gamma distribution under different conditions of the proportional hazard and accelerated failure time assumptions.
International Journal of Preventive Medicine 3(9): 644−651.
ABS, Australian Bureau of Statistics (2006). Australian Social Trends, 2006. (No. 4102.0). http://www.abs.gov.au/ausstats.
ABS, Australian Bureau of Statistics (2008). Australian social trends, 2008. (No. 4102.0). http://www.abs.gov.au/ausstats.
ABS, Australian Bureau of Statistics (2012). Disability, ageing and carers, Australia: Summary of findings, 2012. (No. 4430.0). http://www.abs.gov.au/ausstats. ABS, Australian Bureau of Statistics (2013). Australian Demographic Statistics, June
2013. (No. 3101.0). http://www.abs.gov.au/ausstats.
Cooper, R. and Baird, M. (2015). Bringing the “right to request” flexible working arrangements to life: From policies to practices. Employee Relations 37(5): 568−581.doi:10.1108/ER-07-2014-0085.
Craig, L. and Mullan, K. (2011). How mothers and fathers share childcare: A cross -national time-use comparison. American Sociological Review 76(6): 834−861.
doi:10.1177/0003122411427673.
DePasquale, N., Davis, K.D., Zarit, S.H., Moen, P., Hammer, L.B., and Almeida, D.M. (2014). Combining formal and informal caregiving roles: The psychosocial implications of double- and triple-duty care. Journals of Gerontology, Series B: Psychological Sciences and Social Sciences. doi:10.1093/geronb/gbu139.
Folbre, N. (1994). Who pays for the kids? Gender and the structures of constraint. New York: Routledge. doi:10.4324/9780203168295.
Gutierrez, R.G. (2002). Parametric frailty and shared frailty survival models. Stata Journal 2: 22−44.
Hammer, L. and Neal, M. (2008). Working sandwich-generation caregivers: Prevalence, characteristics, and outcomes. The Psychologist-Manager Journal
Hoenig, S.A. and Page, A.R.E. (2012). Counting on care work in Australia. Australia: AECgroup Limited for economic Security4Women.
Lachance-Grzela, M. and Bouchard, G. (2010). Why do women do the lion’s share of housework? A decade of research. Sex Roles 63(11): 767−780.
doi:10.1007/s11199-010-9797-z.
McDonald, P. (2013). Societal foundations for explaining fertility: Gender equity.
Demographic Research 28(34): 981−994. doi:10.4054/DemRes.2013.28.34. Nichols, L. and Junk, V. (1997). The sandwich generation: Dependency, proximity, and
task assistance needs of parents. Journal of Family and Economic Issues 18(3): 299−326. doi:10.1023/A:1024978930126.
Parr, N. (2011). The contribution of increases in family benefits to Australia’s early 21st-century fertility increase: An empirical analysis. Demographic Research 25(6): 215−244. doi:10.4054/DemRes.2011.25.6.
Pierret, C.R. (2006). The ‘sandwich generation’: Women caring for parents and children. Monthly Labor Review (September): 3−9.
Pilkauskas, N. and Martinson, M. (2014). Three-generation family households in early childhood: Comparisons between the United States, the United Kingdom, and Australia. Demographic Research 30(60): 1639−1652. doi:10.4054/DemRes. 2014.30.60.
Qi, J. (2009). Comparison of proportional hazards and accelerated failure time models. [Unpublished Masters’ Thesis]. University of Saskatchewan. http://ecommons. usask.ca/bitstream/handle/10388/etd-03302009-140638/JiezhiQiThesis.pdf Watson, N. and Wooden, M. (2012). The HILDA survey: A case study in the design
and development of a successful household panel study. Longitudinal and Life Course Studies 3(3): 369−381.
Wickrama, K.A.S., Lorenz, F.O., Wallace, L.E., Peiris, L., Conger, R.D., and Elder Jr., G.H. (2001). Family influence on physical health during the middle years: The case of onset of hypertension. Journal of Marriage and Family 63(2): 527−539.
doi:10.1111/j.1741-3737.2001.00527.x.
Wooden, M. and Watson, N. (2007). The HILDA survey and its contribution to economic and social research (so far). Economic Record 83(261): 208−231.