Patron: Her Majesty The Queen Rothamsted Research Harpenden, Herts, AL5 2JQ
Telephone: +44 (0)1582 763133 Web: http://www.rothamsted.ac.uk/
Rothamsted Research is a Company Limited by Guarantee Registered Office: as above. Registered in England No. 2393175. Registered Charity No. 802038. VAT No. 197 4201 51. Founded in 1843 by John Bennet Lawes.
Rothamsted Repository Download
A - Papers appearing in refereed journals
Bock, C. H., Wood, B. W., Van Den Bosch, F., Parnell, S. and Gottwald,
T. R. 2013. The effect of Horsfall-Barratt category size on the accuracy
and reliability of estimates of pecan scab severity. Plant Disease. 97 (6),
pp. 797-806.
The publisher's version can be accessed at:
•
https://dx.doi.org/10.1094/PDIS-08-12-0781-RE
The output can be accessed at:
https://repository.rothamsted.ac.uk/item/8qw37/the-
effect-of-horsfall-barratt-category-size-on-the-accuracy-and-reliability-of-estimates-of-pecan-scab-severity
.
© Please contact [email protected] for copyright queries.
The Effect of Horsfall-Barratt Category Size on the Accuracy and Reliability
of Estimates of Pecan Scab Severity
Clive H. Bock and Bruce W. Wood, United States Department of Agriculture–Agricultural Research Service (USDA-ARS) SEFTNRL,
Byron, GA 31008; Frank van den Bosch and Stephen Parnell, Rothamsted Research, Harpenden, Herts., AL5 2JQ, England, UK; and
Tim R. Gottwald, USDA-ARS-USHRL, Ft. Pierce, FL 34945
Abstract
Bock, C. H., Wood, B. W., van den Bosch, F., Parnell, S., and Gottwald, T. R. 2013. The effect of Horsfall-Barratt category size on the accuracy and reliability of estimates of pecan scab severity. Plant Dis. 97:797-806.
Pecan scab (Fusicladium effusum) is a destructive pecan disease. Dis-ease assessments may be made using interval-scale-based methods or estimates of severity to the nearest percent area diseased. To explore the effects of rating method—Horsfall-Barratt (H-B) scale estimates versus nearest percent estimates (NPEs)—on the accuracy and reliabil-ity of severreliabil-ity estimates over different actual pecan scab severreliabil-ity ranges on fruit valves, raters assessed two cohorts of images with ac-tual area (0 to 6, 6+ to 25%, and 25+ to 75%) diseased. Mean estimated
disease within each actual disease severity range varied substantially. Means estimated by NPE within each actual disease severity range were not necessarily good predictors of the H-B scale estimate at <25% severity. H-B estimates by raters most often placed severity in
the wrong category compared with actual disease. Measures of bias, accuracy, precision, and agreement using Lin’s concordance correla-tion depended on the range of actual severity, with improvements in-creasing with actual disease severity category (from 0 to 6 through 25+
to 75%); however, the improvement was unaffected by the H-B assess-ments. Bootstrap analysis indicated that NPEs provided either equally good or more accurate and precise estimate of disease compared with the H-B scale at severities of 25+ to 75%. Inter-rater reliability using NPEs
was greater at 25+ to 75% actual disease severity compared with using
the H-B scale. Using NPEs compared with the H-B scale will more often result in more precise and accurate estimates of pecan scab severity, particularly when estimating actual disease severities of 25+ to 75%.
The most destructive disease of pecan (Carya illinoinensis (Wangenh.) K. Koch) in the southeastern United States is scab (caused by the plant-pathogenic fungus Fusicladium effusum G. Winter). Scab causes losses in both nut yield and quality, and can trigger near total fruit abortion in years when the disease is severe (14,31). The pathogen’s conidia are spread by wind and rain-splash, which infect foliage and fruit surfaces under suitable conditions (12,13,33), with expression of visible symptoms approximately 7 to 16 days later (12,33). The symptoms are characterized by discrete dark gray to black lesions that develop on shoots, leaves, or fruit. These lesions are often small but can coalesce, with symptoms forming over large surface areas of the leaves, fruit, or shoots (18).
Disease can be measured as either incidence or severity. Where incidence data (counts) are insufficient, measurement of disease severity is important, with these data often being used to assess yield loss, monitor epidemics, and assess germplasm for resistance (9,21). Measures of disease incidence on pecan are insufficient because virtually all fruit or leaves within a canopy of a susceptible cultivar can be infected, although there may be differences in severity. Unfortunately, there is often substantial error associated with estimates of disease severity (7,24). Various methods are used to assess disease severity, including direct estimates of the percent area diseased (nearest percent estimates [NPEs]) and interval scales to represent diseased areas (1,17,22). Interval rating scales can be useful for ranking numerous treatments—for example, screening germplasm for resistance (32)—but they are not appro-priate for the quantitative study of epidemics. The most widely used interval scale is the Horsfall-Barratt (H-B) scale (17) and its
various derivatives (1,11,18,21,30), which are interval scales that partition the percent severity scale into categories based on percent area diseased. The H-B scale is divided into 12 logarithmically increasing, then decreasing, categories symmetrical around 50%. Regardless of assessment method, the estimates of disease should be both accurate and reliable. Accuracy of an estimate is defined as the closeness of that estimate to the actual value (10,21,26), while reliability of an estimate is defined as the extent to which the same estimate obtained under different conditions yields similar results (10,21,26).
The H-B scale was developed based on theory from psychophys-ics and the so-called Weber-Fechner law that visual acuity is loga-rithmically related to the actual severity of disease (17), and is based on two separate laws, Weber’s law and Fechner’s law, the latter being incorrect (23). These nonlinear scales have been ques-tioned and recent data provide evidence that they do not improve accuracy or reliability of assessments compared with NPEs, and may reduce the accuracy and precision of individual assessments (3,4,9,11,16,21–23,25). Furthermore, experiments confirmed that estimates of disease are linearly related to actual disease (7,22,24). However, disease severity interval scales, such as the H-B scale, are still used and an apparently modified version of the H-B scale was developed as an aide to estimate scab severity on diseased pecan leaves and fruit shucks (the Hunter-Roberts scale; 18). Methods to assess pecan scab have been discussed and compared (2,5,34) and, overall, the H-B scale was not found to improve the accuracy, precision, reliability of, or time required to assess disease (5).
Little information exists on the characteristics of disease assess-ment over different actual disease severity ranges using either NPEs or an H-B-type scale, or whether there are more pronounced differences between the methods over particular ranges of disease. Although estimates of disease to the nearest percent can be very accurate and raters can discriminate small differences in disease (23), error (and variance) of NPEs associated with different actual disease severities has been explored and found to vary with actual disease severity (6,15,19,29); however, the ramifications for accuracy and reliability have not been quantified at different Corresponding author: C. H. Bock, E-mail [email protected]
Accepted for publication 30 December 2012.
http://dx.doi.org/10.1094 / PDIS-08-12-0781-RE
ranges of actual severity or between different rating methods over the interval ranges of an H-B type scale. Although NPEs do vary, certain data indicate that the error of midrange estimates can be much less than the categories imply (23). The objectives of this study were to (i) characterize estimates of pecan scab over ranges
of the H-B scale based on actual disease severities, (ii) compare the accuracy of NPEs and H-B estimates of pecan scab over ranges of the H-B scale based on actual disease severities, and (iii) compare inter-rater reliability of NPEs and H-B estimates over ranges of the H-B scale based on actual disease severities.
Fig. 1. Estimated and actual disease severity of pecan scab on two sets of images of scab-diseased pecan fruit valves by A, B, E, and F, inexperienced and C, D, G, and H,
experienced raters using either A, B, C, and D, nearest percent estimates (NPEs) or E, F, G, and H, the Horsfall-Barratt scale (H-B). The line represents the actual value of scab
severity in percent (the gaps in the line represent the groupings by actual disease severity using the Horsfall-Barratt categories 0 to 6, 6+ to 25, and 25+ to 75%, respectively).
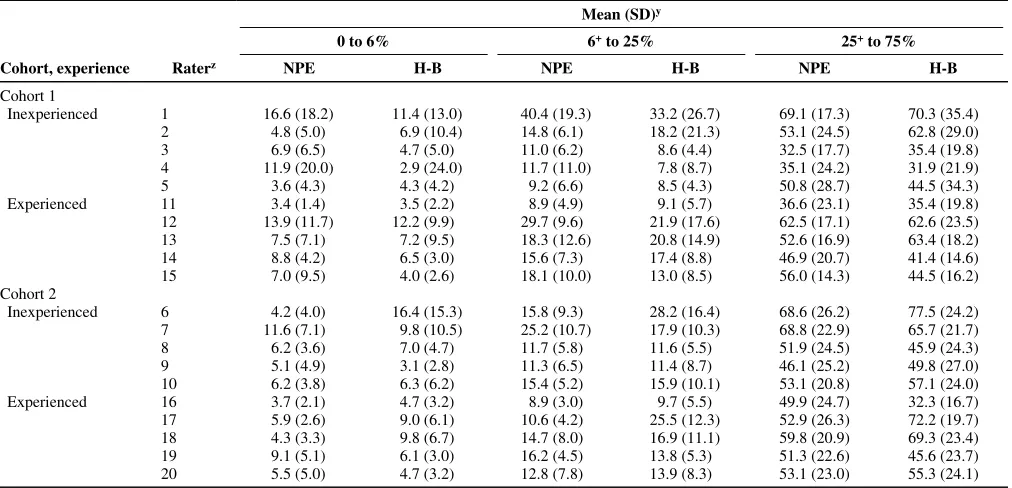
Table 1. Mean and standard deviation (SD) of estimates of scab severity in the ranges of 0 to 6, 6+ to 25, and 25+ to 75% actual diseased area on valves of pecan fruit by inexperienced or experienced raters using either nearest percent estimates (NPEs) or the Horsfall-Barratt (H-B) scale for two sets of images (cohort 1 and 2)
Mean (SD)y
0 to 6% 6+ to 25% 25+ to 75%
Cohort, experience Raterz NPE H-B NPE H-B NPE H-B
Cohort 1
Inexperienced 1 16.6 (18.2) 11.4 (13.0) 40.4 (19.3) 33.2 (26.7) 69.1 (17.3) 70.3 (35.4) 2 4.8 (5.0) 6.9 (10.4) 14.8 (6.1) 18.2 (21.3) 53.1 (24.5) 62.8 (29.0) 3 6.9 (6.5) 4.7 (5.0) 11.0 (6.2) 8.6 (4.4) 32.5 (17.7) 35.4 (19.8) 4 11.9 (20.0) 2.9 (24.0) 11.7 (11.0) 7.8 (8.7) 35.1 (24.2) 31.9 (21.9) 5 3.6 (4.3) 4.3 (4.2) 9.2 (6.6) 8.5 (4.3) 50.8 (28.7) 44.5 (34.3) Experienced 11 3.4 (1.4) 3.5 (2.2) 8.9 (4.9) 9.1 (5.7) 36.6 (23.1) 35.4 (19.8) 12 13.9 (11.7) 12.2 (9.9) 29.7 (9.6) 21.9 (17.6) 62.5 (17.1) 62.6 (23.5) 13 7.5 (7.1) 7.2 (9.5) 18.3 (12.6) 20.8 (14.9) 52.6 (16.9) 63.4 (18.2) 14 8.8 (4.2) 6.5 (3.0) 15.6 (7.3) 17.4 (8.8) 46.9 (20.7) 41.4 (14.6) 15 7.0 (9.5) 4.0 (2.6) 18.1 (10.0) 13.0 (8.5) 56.0 (14.3) 44.5 (16.2)
Cohort 2
Inexperienced 6 4.2 (4.0) 16.4 (15.3) 15.8 (9.3) 28.2 (16.4) 68.6 (26.2) 77.5 (24.2) 7 11.6 (7.1) 9.8 (10.5) 25.2 (10.7) 17.9 (10.3) 68.8 (22.9) 65.7 (21.7) 8 6.2 (3.6) 7.0 (4.7) 11.7 (5.8) 11.6 (5.5) 51.9 (24.5) 45.9 (24.3) 9 5.1 (4.9) 3.1 (2.8) 11.3 (6.5) 11.4 (8.7) 46.1 (25.2) 49.8 (27.0) 10 6.2 (3.8) 6.3 (6.2) 15.4 (5.2) 15.9 (10.1) 53.1 (20.8) 57.1 (24.0) Experienced 16 3.7 (2.1) 4.7 (3.2) 8.9 (3.0) 9.7 (5.5) 49.9 (24.7) 32.3 (16.7) 17 5.9 (2.6) 9.0 (6.1) 10.6 (4.2) 25.5 (12.3) 52.9 (26.3) 72.2 (19.7) 18 4.3 (3.3) 9.8 (6.7) 14.7 (8.0) 16.9 (11.1) 59.8 (20.9) 69.3 (23.4) 19 9.1 (5.1) 6.1 (3.0) 16.2 (4.5) 13.8 (5.3) 51.3 (22.6) 45.6 (23.7) 20 5.5 (5.0) 4.7 (3.2) 12.8 (7.8) 13.9 (8.3) 53.1 (23.0) 55.3 (24.1)
y Actual mean values of mean disease severity based on image analysis for leaves falling in the H-B categories with disease severity 0 to 6% for cohort 1 = 3.6 (SD = 1.5) and for cohort 2 = 3.8 (SD = 1.3), with disease severity 6+ to 25% for cohort 1 = 13.0 (SD = 4.6) and for cohort 2 = 12.9 (SD = 5.5), and with disease severity 25+ to 75% for cohort 1 = 46.5 (SD = 13.8) and for cohort 2 = 49.3 (SD = 15.3).
Materials and Methods
Disease measurement. The diseased pecan material (pecan fruit
valves), the image analysis process to obtain actual values, and the disease assessments were previously described (5,34). Estimated disease data are from two groups of five inexperienced raters (raters who were not familiar with plant diseases and had never assessed disease severity before), 17 to 19 years old; and one group of experienced raters (raters who were trained in plant pathology or entomology and had >15 years each of identifying and assessing disease severity and pest damage on plant parts), 48 to 63 years old. There were two cohorts of 38 images (disease severity 1 to 69% and 1 to 70% valve area diseased, respectively), each of which were assessed. The first cohort was assessed by one group of inexperienced raters (raters 1 to 5) and by the experienced raters (raters 11 to 15), while the second cohort of images was assessed by a second group of inexperienced raters (raters 6 to 10) and by the same experienced raters (who were numbered raters 16 to 20, to differentiate them from the first cohort of images assessed). To compare assessments by NPEs and the H-B scale, the raters were instructed first to assess disease using NPEs and second assess the same images directly using the H-B scale (where 0 to 11 represent 0, 0+ to 3, 3+ to 6, 6+ to 12, 12+ to 25, 25+ to 50, 50+ to 75, 75+ to 87, 87+ to 94, 94+ to 97, 97+ to 100, and 100% area diseased, respectively) to categorize severity.
The raters were provided with the same verbal instructions and reference sheet immediately prior to the assessments (5). The first reference sheet showed symptoms of the disease and described NPEs. The second sheet was a copy of the H-B scale with percent categories described. The inexperienced raters completed the two assessments within 1 h of each other, while the experienced raters completed the NPE assessments up to 1 year prior to doing the H-B assessments. Subsequent to assessments, the H-H-B scale bounda-ries were used to delineate groupings of actual disease severities for later analysis. Thus, the actual disease severity range was split in the range 0 to 6, 6+ to 25, and 25+ to 75% fruit valve area dis-eased, such that for 0 to 6% area disdis-eased, n = 13; 6+ to 25% area diseased, n = 17, and for 25+ to 75% area diseased, n = 8, for each rater.
Data analysis. Data were analyzed using SAS V9.2 (SAS
Sys-tems) and MS Excel 2007. Sample means and standard deviations for each rater and each cohort of images in the disease severity ranges of 0 to 6, 6+ to 25, and 25+ to 75% were calculated. To ex-plore whether raters exhibited similar abilities in estimation of sample means using NPEs and the H-B scale, regression analysis (PROC REG) was used to compare the relationship between (NPE–actual disease) and (H-B estimate–actual disease) for both mean disease severity and for the standard deviation of the mean for each actual severity range (0 to 6, 6+ to 25, and 25+ to 75%). The incidence of over- and underestimates based on the H-B scale was calculated, and mean absolute and relative errors were calcu-lated for each experience/image cohort group.
Lin’s concordance correlation (LCC; 20,22) was used to explore bias (both shift [υ] and location [µ] bias), accuracy (Cb), precision (r), and agreement (ρc) of estimates compared with the actual val-ues (21). First, the NPEs were compared with the H-B scale in each severity range 0 to 6, 6+ to 25, and 25+ to 75% for experi-enced and inexperiexperi-enced raters in each image cohort. This was done by calculating the difference between the means for assess-ment method (NPE – H-B) and performing an equivalence test (1,34,35) using bootstrapping to calculate 95% confidence inter-vals (CIs) for the difference between the means. In equivalence testing, equivalence (i.e., no difference between methods or groups) is the alternative hypothesis (H1) and the null hypothesis (H0) is nonequivalence (i.e., a difference between methods or groups) (12). Equivalence testing assumes a difference and tests for evidence that the means are the same (in this case, the CIs embrac-ing zero). In all analyses, 2,000 balanced bootstrap samples were taken and 95% CIs calculated (PROC SURVEYSELECT/PROC UNIVARIATE). Because the 95% CIs were calculated on the
difference between the means, if the CIs did not embrace zero, the difference was significant.
Second, the effect of disease severity range (0 to 6, 6+ to 25, and 25+ to 75%) for both assessment methods (NPEs and H-B esti-mates) on LCC measures of agreement (bias, accuracy, and preci-sion) were compared by calculating 95% CIs for the rater experi-ence/image cohort means, as described above. If the calculated 95% CIs did not overlap, the mean values were significantly differ-ent.
Inter-rater reliability in each severity range 0 to 6, 6+ to 25, and 25+ to 75% was measured using the coefficient of determination (R2) of pairwise comparisons of all individual raters within each experience/image cohort group. First, an equivalence test (as de-scribed above) was used to explore differences in inter-rater reli-ability by calculating the difference between the R2 for assessment method (NPE – H-B) and using bootstrapping to calculate 95% CIs for the difference between the means. If the 95% CIs did not em-brace zero, the difference was significant. Second, the effect of disease severity range (0 to 6, 6+ to 25, and 25+ to 75%) for both assessment methods (NPEs and H-B estimates) on the pairwise R2
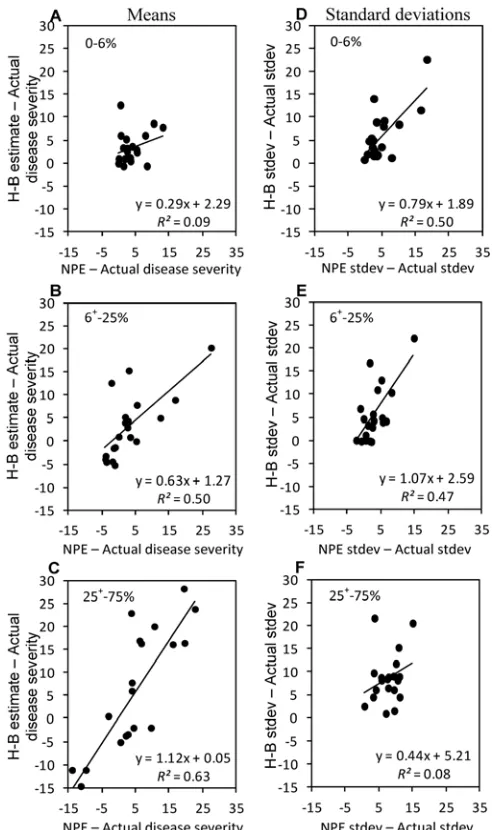
Fig. 2. Relationship between A–C, the difference of the mean nearest percent estimate (NPE) estimate minus actual mean disease and the difference of the
mean Horsfall-Barratt (H-B) estimate minus the actual mean disease; and D–F, the
were compared by calculating 95% CIs for the rater experi-ence/image cohort group means (as described above). If the calcu-lated 95% CIs did not overlap, the mean values were significantly different.
Results
Estimates of values in different category ranges. The
esti-mates by each rater using the NPEs and H-B scale show that, for each image cohort experienced rater, estimates tended to be slightly less scattered, and the H-B scale had the effect of forcing all estimates into the midpoint categories (Fig. 1). Inexperienced rater 1 showed a marked tendency to overestimate over the range of actual disease severities when estimating by NPEs or the H-B scale. Most other assessments followed patterns similar to each other, except for the H-B estimates by rater 6, who tended to over-estimate when using the H-B scale.
The mean estimate of disease within each actual disease severity range varied substantially depending on rater, although inexperi-enced raters tended to have the most extreme values compared with the actual values (Table 1). Inexperienced raters also tended to be the most variable, with the greatest standard deviations being associated with inexperienced raters. However, there was no obvi-ous consistent effect of the H-B scale on the mean estimates of severity or the accompanying standard deviation over any range of
actual disease severity. For all raters, the relationship of the differ-ence between the H-B estimate mean or the NPE estimate mean minus the actual disease severity (Fig. 2A–C) in the different ac-tual disease severity ranges showed that there was poor equiva-lence in the 0 to 6% severity range (R2 = 0.09) but the equivalence of the two rating scales improved as the disease severity range increased from 6+ to 25 and 25+ to 75% (R2 = 0.50 and 0.63, respectively). The equivalence of the difference in the standard deviation in these ranges was the opposite of the estimates of the mean (Fig. 2D–F). As severity increased, the equivalence of the two scales declined.
When using the H-B scale, although individual raters varied, there was no apparent tendency for greater over- or underestima-tion in any particular actual disease severity range (Table 2). No rater estimated all severities in the correct H-B categories, and only one rater got all estimates in the wrong categories in the 25+ to 75% range (rater 1).
Absolute and relative error in the different ranges. The mean
absolute error was least in the 0 to 6% range and greatest in the 25+ to 75% range (Fig. 3A and B). Across the whole range of severity, there was a logarithmic relationship between the mean absolute error and actual severity. On average, when assessing by either the H-B scale or NPEs, experienced raters had a lower absolute error compared with inexperienced raters, as indicated by the
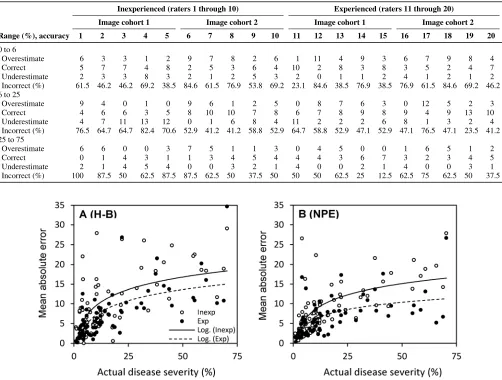
Table 2. Proportion of over- and underestimates using the Horsfall-Barratt (H-B) scale for both inexperienced and experienced raters estimating in the ranges of 0 to 6, 6+ to 25, and 25+ to 75% actual diseased area of pecan scab on valves of pecan fruit
Inexperienced (raters 1 through 10) Experienced (raters 11 through 20)
Image cohort 1 Image cohort 2 Image cohort 1 Image cohort 2
Range (%), accuracy 1 2 3 4 5 6 7 8 9 10 11 12 13 14 15 16 17 18 19 20
0 to 6
Overestimate 6 3 3 1 2 9 7 8 2 6 1 11 4 9 3 6 7 9 8 4
Correct 5 7 7 4 8 2 5 3 6 4 10 2 8 3 8 3 5 2 4 7
Underestimate 2 3 3 8 3 2 1 2 5 3 2 0 1 1 2 4 1 2 1 2
Incorrect (%) 61.5 46.2 46.2 69.2 38.5 84.6 61.5 76.9 53.8 69.2 23.1 84.6 38.5 76.9 38.5 76.9 61.5 84.6 69.2 46.2 6 to 25
Overestimate 9 4 0 1 0 9 6 1 2 5 0 8 7 6 3 0 12 5 2 3
Correct 4 6 6 3 5 8 10 10 7 8 6 7 8 9 8 9 4 9 13 10
Underestimate 4 7 11 13 12 0 1 6 8 4 11 2 2 2 6 8 1 3 2 4
Incorrect (%) 76.5 64.7 64.7 82.4 70.6 52.9 41.2 41.2 58.8 52.9 64.7 58.8 52.9 47.1 52.9 47.1 76.5 47.1 23.5 41.2 25 to 75
Overestimate 6 6 0 0 3 7 5 1 1 3 0 4 5 0 0 1 6 5 1 2
Correct 0 1 4 3 1 1 3 4 5 4 4 4 3 6 7 3 2 3 4 5
Underestimate 2 1 4 5 4 0 0 3 2 1 4 0 0 2 1 4 0 0 3 1
Incorrect (%) 100 87.5 50 62.5 87.5 87.5 62.5 50 37.5 50 50 50 62.5 25 12.5 62.5 75 62.5 50 37.5
Fig. 3. Mean absolute error (estimate minus true disease) of assessments of images for the combined data from image cohort 1 and 2 of scab-diseased valves of pecan fruit
by experienced and inexperienced raters using A, the Horsfall-Barratt scale (H-B) or B, nearest percent estimates (NPEs) to assess scab severity. Mean absolute error is the
average of all estimates for each actual severity after converting all error to absolute (positive) values. A logarithmic function was used to describe the data, where, for
inexperienced raters using the H-B scale, y = 4.57ln(x) – 1.08 (R2 = 0.41); for experienced raters using the H-B scale, y = 4.09ln(x) – 2.35 (R2 = 0.48); for inexperienced
logarithmic function fit to these data. Also, NPEs had slightly lower absolute error compared with H-B estimates for both inexperienced and experienced raters. In all ranges, there was a tendency to overestimate compared with underestimating which was greatest in the 0 to 6% range (data not shown), although the greatest mean over- and underestimates were in the 25+ to 75% range (data not shown). However, the relative error declined consistently with the actual disease severity range from the 0 to 6% range to the 25+ to 75% range (Fig. 4).
Comparison of NPEs and the H-B scale within severity ranges. Many of the measures of bias, accuracy, precision, and
agreement depended on the range of actual severity for both assessment methods and inexperienced and experienced raters (Fig. 5). Thus scale bias (υ) declined from very high values (>3.00) at 0 to 6% actual disease to close to 1.0 at 25+ to 75% actual dis-ease, suggesting that the tendency for a difference in variance be-tween actual and estimated values is greatest at low disease
severi-ties (which can be verified by referring to Table 1). Location bias (µ) was also greatest within the range 0 to 6% actual disease sever-ity, which reflects the tendency to overestimate, particularly at low disease severity. The tendency, on average, to overestimate was still evident at 6+ to 25 and 25+ to 75% actual disease severity. There was no evidence that the H-B scale reduced bias compared with NPEs. Both accuracy, as measured by the correction factor (Cb), and precision, measured by the correlation coefficient (r), proved with actual disease severity category; however, the im-provement was not affected by the H-B assessments. Overall agreement measured by LCC (ρc) also improved for both the experienced and inexperienced raters. Agreement was very poor at 0 to 6% actual disease severity and improved between 6+ to 25 and 25+ to 75% actual disease severity.
Between 0 and 6% actual disease there was a significant differ-ence using NPEs compared with the H-B scale in precision among inexperienced raters in image cohort 2, and in location bias among
Fig. 4. Mean relative error [(absolute error/actual disease severity) × 100] of assessments of two cohorts of images of scab-diseased valves of pecan fruit by experienced and
inexperienced raters using A, the nearest percent estimates (NPEs) or B, the Horsfall-Barratt scale (H-B). Mean relative error was based on the average of the errors for the
actual disease severity ranges 0 to 6, 6+ to 25, and 25+ to 75% area diseased.
experienced raters in image cohort 1 (Table 3). In these cases, the NPEs resulted in the greater precision (r = 0.46 versus 0.37) but the H-B scale reduced location bias (µ = 0.93 versus 1.32).
In the 6+ to 25% actual disease severity range (Table 4), there were significant difference between the NPE and H-B in cohort 1 assessed by inexperienced raters for location bias and accuracy. Use of the H-B scale resulted in reduced location bias (µ = –0.09 versus 0.40) but, overall, had reduced accuracy compared with the NPEs (Cb = 0.52 versus 0.69). In the second cohort of images, assessments by inexperienced raters using NPEs had significantly reduced scale bias compared with H-B estimates (υ = 1.36 versus 2.21). With cohort 1, experienced raters were more precise using the H-B scale compared with NPEs (r = 0.75 versus 0.59) and, with cohort 2, NPEs had less scale bias compared with H-B esti-mates (υ = 1.00 versus 1.54).
With disease severities of 25+ to 75% (Table 5), inexperienced raters assessing cohort 1 images exhibited greater scale bias using the H-B scale compared with NPEs (υ = 2.03 versus 1.63). With
experienced raters, there was no difference between NPE or H-B estimates. With the cohort 2 images, NPE estimates by inexperi-enced raters had reduced scale and location bias (υ = 1.57 versus 1.76 and µ = 0.44 versus 0.70, respectively), and increased accu-racy (Cb = 0.86 versus 0.84) and agreement (ρc = 0.67 versus 0.57) compared with using H-B estimates. With the cohort 2 experienced raters, estimates by NPEs were more accurate (Cb = 0.89 versus 0.70) and precise (r = 0.88 versus 0.71), and had better agreement (ρc = 0.78 versus 0.50 compared with using the H-B scale). These data suggest that either H-B or NPE estimates might be more accu-rate or precise at severity<25%. However, at severities >25 to <75%, NPEs invariably provided either equally or more accurate and precise estimates of disease severity compared with the H-B scale for both experienced and inexperienced raters.
Effect of disease severity on accuracy and precision of assess-ments. Scale bias (υ) was least and accuracy (Cb), precision (r), and agreement (ρc) greatest for estimates using NPEs in the categories 25+ to 75% range of actual disease severity compared with the
Table 3. Mean concordance statistics (bias, accuracy, precision, and agreement) for inexperienced and experienced raters with bootstrap analysis of the difference between means when using nearest percent estimates (NPEs) or the Horsfall-Barratt (H-B) scale to assess scab severity in the ranges of 0 to 6% actual disease on pecan fruit valvesw
Image cohort 1 Image cohort 2
Mean Mean
Rater, LCCx NPE H-B Diffy 95% CIsz NPE H-B Diff 95% CIs
Inexperienced
υ 7.52 5.31 2.216 –1.605–6.956 3.49 5.51 –2.005 –5.134–0.410
µ 1.12 0.60 0.515 –0.148–1.186 1.08 1.25 –0.159 –1.404–0.688
Cb 0.33 0.28 –0.063 –0.267–0.133 0.44 0.23 0.063 –0.149–0.305
r 0.35 0.40 0.066 –0.106–0.236 0.46 0.37 0.227 0.072–0.446
ρc 0.11 0.14 –0.030 –0.065–0.006 0.20 0.09 0.101 0.010–0.205
Experienced
υ 4.71 3.81 0.935 –0.789–3.000 2.69 3.31 –0.597 –0.226–0.984
µ 1.32 0.93 0.389 0.123–0.656 0.81 1.19 –0.367 –1.123–0.418
Cb 0.39 0.60 –0.136 –0.361–0.044 0.56 0.52 0.103 –0.135–0.349
r 0.71 0.52 0.106 –0.065–0.342 0.52 0.45 –0.003 –0.088–0.090
ρc 0.28 0.32 –0.050 –0.247–0.131 0.28 0.26 0.026 –0.124–0.182
w Bold text indicates a significant difference. x Lin’s concordance correlation (LCC) coefficient (ρ
c) combines both measures of precision (r) and accuracy (Cb) to measure the degree of agreement with the true value; υ = scale bias or slope shift (1 = no bias relative to the concordance line); µ = location bias or height shift (0 = no bias relative to the concordance line); the correction factor (Cb) measures how far the best–fit line deviates from 45° and, thus, is a measure of accuracy; and the correlation coefficient (r) measures precision.
y Mean of the difference between each rating.
z Confidence intervals (CIs) were based on 2,000 bootstrap samples. If the CIs embrace zero, the difference is not significant (α = 0.05).
Table 4. Mean concordance statistics (bias, accuracy, precision, and agreement) for inexperienced and experienced raters with bootstrap analysis of the difference between means when using nearest percent estimates (NPEs) or the Horsfall-Barratt (H-B) scale to assess scab severity in the range 6+ to 25% actual disease on pecan fruit valvesw
Image cohort 1 Image cohort 2
Mean Mean
Rater, LCCx NPE H-B Diffy 95% CIsz NPE H-B Diff 95% CIs
Inexperienced
υ 2.13 2.84 –0.698 –2.195–0.476 1.36 2.21 –0.859 –1.428– –0.325
µ 0.40 –0.09 0.488 0.115–0.832 0.39 0.47 –0.075 –0.794–0.532
Cb 0.69 0.52 0.166 0.018–0.346 0.81 0.68 0.135 –0.077–0.363
r 0.50 0.45 0.053 –0.270–0.334 0.54 0.54 –0.012 –0.298–0.316
ρc 0.34 0.27 0.066 –0.158–0.261 0.42 0.43 –0.013 –0.196–0.199
Experienced
υ 1.93 2.41 –0.482 –1.144–0.059 1.00 1.54 –0.0543 –1.014– –0.190
µ 0.71 0.38 0.341 –0.215–1.014 –0.11 0.35 –0.459 –1.278–0.184
Cb 0.67 0.63 –0.035 –0.161–0.0922 0.69 0.78 0.049 –0.168–0.283
r 0.59 0.75 –0.082 –0.192– –0.006 0.83 0.71 –0.023 –0.13–0.124
ρc 0.42 0.47 –0.052 –0.161–0.058 0.57 0.57 0.004 –0.216–0.263
w Bold text indicates a significant difference. x Lin’s concordance correlation (LCC) coefficient (ρ
c) combines both measures of precision (r) and accuracy (Cb) to measure the degree of agreement with the true value; υ = scale bias or slope shift (1 = no bias relative to the concordance line); µ = location bias or height shift (0 = no bias relative to the concordance line); the correction factor (Cb) measures how far the best–fit line deviates from 45° and, thus, is a measure of accuracy; and the correlation coefficient (r) measures precision.
y Mean of the difference between each rating.
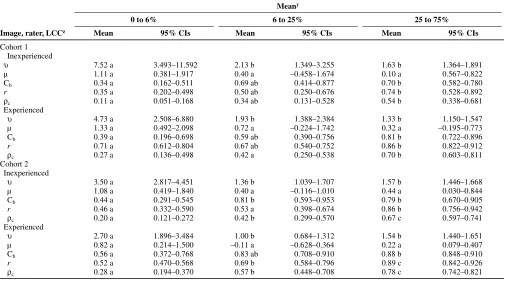
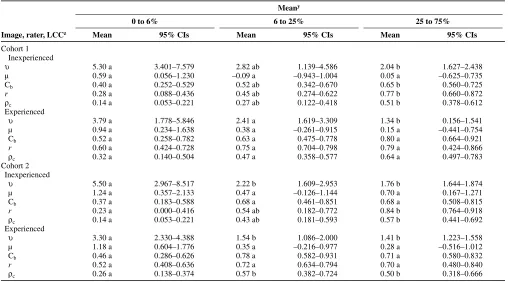
category 0 to 6% range (Table 6). There was no difference in location bias (µ) in estimates over any range of actual disease severity. Using H-B scale estimates (Table 7), inexperienced raters followed a pattern similar to the NPE estimates, except with accuracy (Cb) of the estimates, which was greatest in the 25+ to 75% range for
assess-ment of cohort 1 images, was the same across all ranges of actual disease severity for cohort 2. Experienced raters assessing cohort 1 images showed a significant difference between actual disease ranges only in scale bias (υ) but, in assessments of cohort 2 images, there were significant differences in scale bias (υ) and agreement (ρc).
Table 5. Mean concordance statistics (bias, accuracy, precision, and agreement) for inexperienced and experienced raters with bootstrap analysis of the difference between means when using nearest percent estimates (NPEs) or the Horsfall-Barratt (H-B) scale to assess scab severity in the ranges of 25+ to 75% actual disease on pecan fruit valvesw
Image cohort 1 Image cohort 2
Mean Mean
Rater, LCCx NPE H-B Diffy 95% CIsz NPE H-B Diff 95% CIs
Inexperienced
υ 1.63 2.03 –0.403 –0.897– –0.027 1.57 1.76 –0.190 –0.304– –0.073
µ 0.10 0.06 0.048 –0.258–0.321 0.44 0.70 –0.266 –0.524– –0.025
Cb 0.73 0.77 0.049 –0.024–0.125 0.86 0.84 0.111 0.041–0.186
r 0.70 0.65 –0.039 –0.134–0.036 0.79 0.68 0.017 –0.060–0.092
ρc 0.53 0.51 0.025 –0.076–0.124 0.67 0.57 0.101 0.029–0.177
Experienced
υ 1.33 1.34 –0.004 –0.270–0.284 1.54 1.41 0.130 –0.109–0.387
µ 0.31 0.16 –0.166 –0.295–0.549 0.22 0.28 –0.066 –0.720–0.607
Cb 0.86 0.79 0.018 –0.100–0.167 0.89 0.70 0.172 0.069–0.279
r 0.81 0.79 0.068 –0.010–00142 0.88 0.71 0.186 0.018–0.420
ρc 0.70 0.64 0.064 –0.080–0.201 0.78 0.50 0.277 0.103–0.487
w Bold text indicates a significant difference. x Lin’s concordance correlation (LCC) coefficient (ρ
c) combines both measures of precision (r) and accuracy (Cb) to measure the degree of agreement with the true value; υ = scale bias or slope shift (1 = no bias relative to the concordance line); µ = location bias or height shift (0 = no bias relative to the concordance line); the correction factor (Cb) measures how far the best–fit line deviates from 45° and, thus, is a measure of accuracy; and the correlation coefficient (r) measures precision.
y Mean of the difference between each rating.
z Confidence intervals (CIs) were based on 2,000 bootstrap samples. If the CIs embrace zero, the difference is not significant (α = 0.05).
Table 6. Effect of actual disease severity placed in Horsfall-Barratt (H-B) scale category ranges of 0 to 6, 6+ to 25, and 25+ to 75% on the bias, accuracy, precision, and agreement of estimates of pecan scab on valves of pecan fruit assessed by both inexperienced and experienced groups of raters estimating disease using nearest percent estimates (NPEs)
Meany
0 to 6% 6 to 25% 25 to 75%
Image, rater, LCCz Mean 95% CIs Mean 95% CIs Mean 95% CIs
Cohort 1
Inexperienced
υ 7.52 a 3.493–11.592 2.13 b 1.349–3.255 1.63 b 1.364–1.891
µ 1.11 a 0.381–1.917 0.40 a –0.458–1.674 0.10 a 0.567–0.822
Cb 0.34 a 0.162–0.511 0.69 ab 0.414–0.877 0.70 b 0.582–0.780
r 0.35 a 0.202–0.498 0.50 ab 0.250–0.676 0.74 b 0.528–0.892
ρc 0.11 a 0.051–0.168 0.34 ab 0.131–0.528 0.54 b 0.338–0.681
Experienced
υ 4.73 a 2.508–6.880 1.93 b 1.388–2.384 1.33 b 1.150–1.547
µ 1.33 a 0.492–2.098 0.72 a –0.224–1.742 0.32 a –0.195–0.773
Cb 0.39 a 0.196–0.698 0.59 ab 0.390–0.756 0.81 b 0.722–0.896
r 0.71 a 0.612–0.804 0.67 ab 0.540–0.752 0.86 b 0.822–0.912
ρc 0.27 a 0.136–0.498 0.42 a 0.250–0.538 0.70 b 0.603–0.811
Cohort 2
Inexperienced
υ 3.50 a 2.817–4.451 1.36 b 1.039–1.707 1.57 b 1.446–1.668
µ 1.08 a 0.419–1.840 0.40 a –0.116–1.010 0.44 a 0.030–0.844
Cb 0.44 a 0.291–0.545 0.81 b 0.593–0.953 0.79 b 0.670–0.905
r 0.46 a 0.332–0.590 0.53 a 0.398–0.674 0.86 b 0.756–0.942
ρc 0.20 a 0.121–0.272 0.42 b 0.299–0.570 0.67 c 0.597–0.741
Experienced
υ 2.70 a 1.896–3.484 1.00 b 0.684–1.312 1.54 b 1.440–1.651
µ 0.82 a 0.214–1.500 –0.11 a –0.628–0.364 0.22 a 0.079–0.407
Cb 0.56 a 0.372–0.768 0.83 ab 0.708–0.910 0.88 b 0.848–0.910
r 0.52 a 0.470–0.568 0.69 b 0.584–0.796 0.89 c 0.842–0.926
ρc 0.28 a 0.194–0.370 0.57 b 0.448–0.708 0.78 c 0.742–0.821
y Mean of the rater estimates.
z Image cohort, rater experience, and Lin’s concordance correlation (LCC) statistics. LCC coefficient (ρ
Inter-rater reliability. The inter-rater reliability of raters using
NPEs or the H-B scale showed no difference in the coefficient of determinations at 0 to 6 or 6+ to 25% ranges of actual severity (Table 8). However, at 25+ to 75%, actual disease severity estimated by both experienced raters and inexperienced raters for image cohort was more reliable using NPEs compared with the H-B scale (R2 = 0.81 versus 0.58, and R2 = 0.53 versus 0.40, respectively). Estimates of disease severity of image cohort 2 by inexperienced raters was more reliable using NPEs compared with the H-B scale (R2 = 0.88 versus 0.58). Bootstrapped 95% CIs of coefficients of determination for inter-rater reliability using NPEs showed significant differences in reliability of estimates of disease
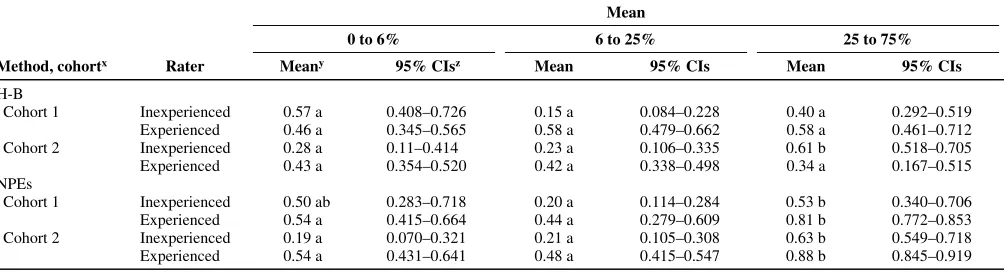
severity between the different actual disease severity categories, with estimates of actual disease in the range 25+ to 75% severity most often being more reliable compared with those <25% (Table 9). Estimates using the H-B scale were similarly unreliable in all actual disease severity categories, with the exception of inexperienced raters in image cohort 1, who demonstrated greater reliability at 25 to 75% actual severity compared with the other categories.
Discussion
The H-B scale did not provide a less biased, more accurate, or more precise estimate of actual pecan scab severity in any range of
Table 7. Effect of actual disease severity placed in Horsfall-Barratt (H-B) scale category ranges of 0 to 6, 6+ to 25, and 25+ to 75% on the bias, accuracy, precision, and agreement of estimates of pecan scab on valves of pecan fruit assessed by both inexperienced and experienced groups of raters estimating disease using the H-B category scale (subsequently converted to the category midpoint)
Meany
0 to 6% 6 to 25% 25 to 75%
Image, rater, LCCz Mean 95% CIs Mean 95% CIs Mean 95% CIs
Cohort 1
Inexperienced
υ 5.30 a 3.401–7.579 2.82 ab 1.139–4.586 2.04 b 1.627–2.438
µ 0.59 a 0.056–1.230 –0.09 a –0.943–1.004 0.05 a –0.625–0.735
Cb 0.40 a 0.252–0.529 0.52 ab 0.342–0.670 0.65 b 0.560–0.725
r 0.28 a 0.088–0.436 0.45 ab 0.274–0.622 0.77 b 0.660–0.872
ρc 0.14 a 0.053–0.221 0.27 ab 0.122–0.418 0.51 b 0.378–0.612
Experienced
υ 3.79 a 1.778–5.846 2.41 a 1.619–3.309 1.34 b 0.156–1.541
µ 0.94 a 0.234–1.638 0.38 a –0.261–0.915 0.15 a –0.441–0.754
Cb 0.52 a 0.258–0.782 0.63 a 0.475–0.778 0.80 a 0.664–0.921
r 0.60 a 0.424–0.728 0.75 a 0.704–0.798 0.79 a 0.424–0.866
ρc 0.32 a 0.140–0.504 0.47 a 0.358–0.577 0.64 a 0.497–0.783
Cohort 2
Inexperienced
υ 5.50 a 2.967–8.517 2.22 b 1.609–2.953 1.76 b 1.644–1.874
µ 1.24 a 0.357–2.133 0.47 a –0.126–1.144 0.70 a 0.167–1.271
Cb 0.37 a 0.183–0.588 0.68 a 0.461–0.851 0.68 a 0.508–0.815
r 0.23 a 0.000–0.416 0.54 ab 0.182–0.772 0.84 b 0.764–0.918
ρc 0.14 a 0.053–0.221 0.43 ab 0.181–0.593 0.57 b 0.441–0.692
Experienced
υ 3.30 a 2.330–4.388 1.54 b 1.086–2.000 1.41 b 1.223–1.558
µ 1.18 a 0.604–1.776 0.35 a –0.216–0.977 0.28 a –0.516–1.012
Cb 0.46 a 0.286–0.626 0.78 a 0.582–0.931 0.71 a 0.580–0.832
r 0.52 a 0.408–0.636 0.72 a 0.634–0.794 0.70 a 0.480–0.840
ρc 0.26 a 0.138–0.374 0.57 b 0.382–0.724 0.50 b 0.318–0.666
y Mean of the rater estimates.
z Image cohort, rater experience, and Lin’s concordance correlation (LCC) statistics. LCC coefficient (ρ
c) combines both measures of precision (r) and accuracy (Cb) to measure the degree of agreement with the true value. The 95% confidence intervals (CIs) were based on 2,000 bootstrap samples. If the 95% CIs of the means do not overlap, the difference is significant (α = 0.05). Thus, means within a row followed by the same letter are not significantly different. Parameters: υ = scale bias or slope shift (1 = no bias relative to the concordance line); µ = location bias or height shift (0 = no bias relative to the concordance line); correction factor (Cb) measures how far the best-fit line deviates from 45° and, thus, is a measure of accuracy; and correlation coefficient (r) measures precision.
Table 8. Inter-rater reliability over different actual disease severities placed in Horsfall-Barratt (H-B) scale category ranges of 0 to 6, 6+ to 25, and 25+ to 75% of estimates of pecan scab on two cohorts of valves of pecan fruit assessed by both inexperienced and experienced groups of raters using either nearest percent estimates (NPEs) or the Horsfall-Barratt scale (H-B)x
Image cohort 1 Image cohort 2
Mean Mean
Rater, severity NPE H-B Diffy 95% CIsz NPE H-B Diff 95% CIs
Inexperienced
0 to 6 0.50 0.57 –0.070 –0.363–0.233 0.19 0.28 –0.092 –0.291–0.126
6 to 25 0.20 0.15 0.045 –0.091–0.175 0.21 0.23 –0.020 –0.140–0.103
25 to 75 0.53 0.40 0.127 0.014–0.225 0.63 0.61 0.022 –0.054–0.090
Experienced
0 to 6 0.54 0.46 0.081 –0.125–0.287 0.54 0.44 0.106 –0.002–0.221
6 to 25 0.44 0.57 –0.139 –0.333–0.065 0.48 0.43 0.054 –0.037–0.155
25 to 75 0.81 0.58 0.230 0.083–0.371 0.88 0.34 0.544 0.362–0.722
x Bold text indicates a significant difference.
y Mean coefficient of determination (R2) of the rater estimates.
actual scab severity explored in this study, and often gave an inferior estimate of severity compared with NPEs. This observation is supported by previous studies (1,9,11,22). Although results based on the full range of the H-B scale had previously been reported (5), the differences between assessment methods and rater experience found herein over different actual disease severity ranges indicate where the H-B scale is least often accurate and reliable (25+ to 75% severity). There appears to be no advantage to the H-B scale over the severity ranges tested.
The mean estimates and standard deviations for each actual dis-ease severity range did not indicate that the H-B scale offered any advantage and, at low actual disease severity, there was little rela-tionship between the mean estimates by the two methods (suggest-ing that the H-B scale contributed another source of random error to the assessment process, beyond that already present in NPEs). At greater disease severities, estimates by the two methods were more comparable. However, the standard deviations of the mean estimates followed an opposite trend, with the standard deviations of the least severe actual disease severities tending to be most simi-lar between the two methods. The characteristics of the mean and standard deviation have ramifications for analysis (4) and, because H-B estimates do not demonstrably increase the accuracy of the mean or result in a standard deviation closer to the actual standard deviation over the tested ranges of actual disease severity, they are of questionable value. Nita et al. (22) reported means for NPEs and H-B data from six raters and found minor differences in the esti-mates of the means by the two methods but they based the H-B category directly on the NPE estimate, which invariably placed the H-B estimate in the same category as the original NPE. When raters are estimating disease severity using the H-B scale they might not always do that, especially if rating using the scale di-rectly (if not used didi-rectly, it seems pointless to estimate a percent, only to then place it in a category and then retransform to a mid-point for analysis at a later time). Indeed, in the current study, raters most often placed the H-B estimate in the incorrect category in all ranges of actual disease severity, further demonstrating the inaccuracies of H-B-type scales.
Overall, raters were more often accurate and precise using NPEs compared with using the H-B scale, particularly in the 25 to 75% range of actual disease severity (Tables 3–5), which is in agree-ment with results of simulation studies by Bock et al. (4), although there was little difference between the two methods at lower dis-ease severities (<25%) and either NPEs or the H-B scale might provide the most accurate or precise estimates. In the 25 to 75% range, where H-B categories are largest, the H-B scale was never better and often was inferior to the NPEs. This is most likely due to the ability of most raters to do a better job of assessing in these broad categories using NPEs compared with applying an H-B esti-mate (23). Furthermore, although NPEs might be incorrect, these
data demonstrate that, most often, raters, when using the H-B scale and whether experienced or not, will place the diseased fruit valve in the wrong category. Where the category intervals are wide, this can result in even greater error after midpoint conversion compared with NPEs.
LCC is sensitive to the relative error; as was seen in this study, disease estimates of low actual severity (<6% surface area) were highly biased, inaccurate, imprecise, and had poor agreement with the true values compared with estimates in the midrange, where relative error was less (and absolute error greatest). This demon-strates the importance of testing accuracy and precision over the full range of disease severity (0 to 100%), not just over a portion of the severity scale where the tendency of raters is to over-estimate (6,29). Without sufficient coverage of the full severity range, estimates of accuracy, precision, and agreement might be overly influenced by relative error at low disease severity. In the cases where LCC has been used to explore disease severity assessment, samples from a wide range of disease severities have been used (1,5,8,22).
The tendency to overestimate disease was clear throughout the range of disease severity assessed in this study. This tendency has been observed before (6,29) but no effective solutions have been identified to prevent this source of error. Considering that plant disease is often in the severity range 0 to 10%, it is worthy to con-sider ways of reducing this error. Perhaps standard area diagrams (34) and computer-aided training (25) can assist in reducing the absolute error at these low disease severities.
Different raters varied in their ability to assess disease, and some inexperienced raters were both accurate and precise. Conversely, experienced raters did not always provide the most accurate and precise estimates. However, on average, the estimates of accuracy, precision, and agreement based on LCC were most often numeri-cally closer to the ideal compared with inexperienced raters (Tables 6 and 7). The effect of rater experience has been observed before (1,5,22,27), and these results confirm the previous observations. However, it is important to remember that there is diversity in the innate ability of different raters to assess disease severity, and the ability of an individual rater can change. Assessment training and aides can help reduce this variability within and among individuals (1,25,34).
Inter-rater reliability was generally similar for NPEs and the H-B scale at actual disease severity <25% but NPEs resulted in better reliability in the range 25+ to 75%, which was true for one cohort of assessments for the inexperienced raters, and both cohorts of assessments for the experienced raters. Although inter-rater reli-ability has been explored (7,8,22,24,34), the characteristics of in-ter-rater reliability at different disease severities have not been studied, and these results suggest that inter-rater reliability is sensi-tive to the magnitude of actual disease severity, with greatest
inter-Table 9. Inter-rater reliability (measured by the coefficient of determination) over different actual disease severities placed in actual severity ranges of 0 to 6, 6+ to 25, and 25+ to 75% of estimates of pecan scab on two cohorts of valves of pecan fruit assessed by both inexperienced and experienced groups of raters
Mean
0 to 6% 6 to 25% 25 to 75%
Method, cohortx Rater Meany 95% CIsz Mean 95% CIs Mean 95% CIs
H-B
Cohort 1 Inexperienced 0.57 a 0.408–0.726 0.15 a 0.084–0.228 0.40 a 0.292–0.519 Experienced 0.46 a 0.345–0.565 0.58 a 0.479–0.662 0.58 a 0.461–0.712 Cohort 2 Inexperienced 0.28 a 0.11–0.414 0.23 a 0.106–0.335 0.61 b 0.518–0.705 Experienced 0.43 a 0.354–0.520 0.42 a 0.338–0.498 0.34 a 0.167–0.515 NPEs
Cohort 1 Inexperienced 0.50 ab 0.283–0.718 0.20 a 0.114–0.284 0.53 b 0.340–0.706 Experienced 0.54 a 0.415–0.664 0.44 a 0.279–0.609 0.81 b 0.772–0.853 Cohort 2 Inexperienced 0.19 a 0.070–0.321 0.21 a 0.105–0.308 0.63 b 0.549–0.718 Experienced 0.54 a 0.431–0.641 0.48 a 0.415–0.547 0.88 b 0.845–0.919
x Assessment method and image cohort.
y Mean coefficient of determination (R2) of the rater estimates.
rater reliability existing in the midrange of disease severity (as noted above, relative error being least in this range).
The logarithmic relationship observed between mean absolute error and actual disease severity is interesting considering that Horsfall and Barratt (17) based their scale on a logarithmic relationship. Perhaps this is the relationship they were referring to, rather than that between the estimate and the actual disease, which is linear (7,25). Relationships between actual disease severity, standard deviations of the estimate, coefficient of variation, or variance of the estimates have been studied previously (6,15) and the results of the current study were similar (data not shown).
Not only is the H-B scale based on faulty theory (23), it is also cumbersome, does not appear to be particularly rapid (5), and re-quires a midpoint reconversion before data can be analyzed using parametric statistics (11). Therefore, it is questionable whether the H-B scale or its derivatives offer any advantages in assessing sever-ity of pecan scab compared with NPEs. Furthermore, where a scale is to be used to measure disease severity for purposes other than ranking, it is appropriate to choose a scale with equal intervals (22,28). The percent ratio scale provides a realistic estimate of disease and also provides data that are amenable to more powerful parametric statistics; and, if needed, these data can be transformed prior to analysis to ensure normality and homogeneity of variance.
Acknowledgments
We thank students from the Morehouse University Upward Bound Program and colleagues at the USDA-ARS-SEFTNRL for taking the time necessary to assess the disease images.
Literature Cited
1. Bardsley, S. J., and Ngugi, H. K. 2012. Reliability and accuracy of visual methods used to quantify severity of foliar bacterial spot symptoms on peach and nectarine. Plant Pathol. Online publication. doi:10.1111/j.1365-3059.2012.02651.x
2. Bertrand, P. F., Brenneman, T. B., and Stevenson, K. C. 1999, Disease as-sessment and uniformity in rating methods. In: Pecan Industry: Current Situation and Future Challenges, Third National Pecan Workshop Proceed-ings. B. McGraw, E. H. Dean, and B. W. Wood, eds. U. S. Dep. Agric. Agric. Res. Serv. 1998-04.
3. Bock, C. H., Gottwald, T. R., Parker, P. E., Cook, A. Z., Ferrandino, F., Par-nell, S., and van den Bosch, F. 2009. The Horsfall-Barratt scale and severity estimates of citrus canker. Eur. J. Plant Pathol. 125:23-38.
4. Bock, C. H., Gottwald, T. R., Parker, P. E., Ferrandino, F., Welham, S., van den Bosch, F., and Parnell, S. 2010. Some consequences of using the Hors-fall-Barratt scale for hypothesis testing. Phytopathology 100:1031-1041. 5. Bock, C. H., Gottwald, T. R., and Wood, B. W. 2013. Pecan scab severity—
effects of assessment methods. Plant Dis. 97:675-684.
6. Bock, C. H., Parker, P. E., Cook, A. Z., and Gottwald, T. R. 2008. Char-acteristics of the perception of different severity measures of citrus canker and the relations between the various symptom types. Plant Dis. 92:927-939.
7. Bock, C. H., Parker, P. E., Cook, A. Z., and Gottwald, T. R. 2008. Visual rating and the use of image analysis for assessing different symptoms of cit-rus canker on grapefruit leaves. Plant Dis. 92:530-541.
8. Bock, C. H., Parker, P. E., Cook, A. Z., Riley, T., and Gottwald, T. R. 2009. Comparison of assessment of citrus canker foliar symptoms by experienced and inexperienced raters. Plant Dis. 93:412-424.
9. Bock, C. H., Poole, G., Parker, P. E., and Gottwald, T. R. 2010. Plant dis-ease severity estimated visually, by digital photography and image analysis, and by hyperspectral imaging. Crit. Rev. Plant Sci. 29:59-107.
10. Everitt, B. S. 1998. The Cambridge Dictionary of Statistics. Cambridge
University Press. Cambridge.
11. Forbes, G. A., and Korva, J. T. 1994. The effect of using a Horsfall-Barratt scale on precision and accuracy of visual estimation of potato late blight se-verity in the field. Plant Pathol. 43:675-682.
12. Garrett, K. A. 1997. Use of statistical tests of equivalence (bioequivalence tests) in plant pathology. Phytopathology 87:372-374.
13. Gottwald, T. R., and Bertrand, P. F. 1982. Patterns of diurnal and seasonal airborne spore concentrations of Fusicladium effusum and its impact on a pecan scab epidemic. Phytopathology 72:330-335.
14. Gottwald, T. R., and Bertrand, P. F. 1983. Effect of time of inoculation with Cladosporium caryigenum on pecan scab development and nut quality. Phy-topathology 73:714-718.
15. Hau, B., Kranz, J., and Konig, R. 1989. Fehler beim Schätzen von Be-fallsstärken bei Pflanzenkrankheiten. Z. Pflanzenkrankh. Pflanzenschutz 96:649-674.
16. Herbert, T. T. 1982. The rationale for the Horsfall-Barratt plant disease assessment scale. Phytopathology 72:1269.
17. Horsfall, J. G., and Barratt, R. W. 1945. An improved grading system for measuring plant disease. (Abstr.) Phytopathology 35:655
18. Hunter, R. E., and Roberts, D. D. 1978. A disease grading system for pecan scab. Pecan Q. 12:3-6.
19. Koch, H., and Hau, B. 1980. Ein psychologischer aspect beim schatzen von pflanzenkrankheiten. Z. Pflanzenkrankh. Pflanzenschutz 87:587-593. 20. Lin, L. I. 1989. A concordance correlation coefficient to evaluate
reproduci-bility. Biometrics 45:255–268.
21. Madden, L. V., Hughes, G., and van den Bosch, F. 2007. The Study of Plant Disease Epidemics. American Phytopathological Society, St. Paul, MN. 22. Nita, M., Ellis, M. A., and Madden, L. V. 2003. Reliability and accuracy of
visual estimation of Phomopsis leaf blight of strawberry. Phytopathology 93:995-1005.
23. Nutter, F. W., Jr., and Esker, P. D. 2006. The role of psychophysics in phyto-pathology. Eur. J. Plant Pathol. 114:199-213.
24. Nutter, F. W., Jr., Gleason, M. L., Jenco, J. H., and Christians, N. L. 1993. Accuracy, intra-rater repeatability, and inter-rater reliability of disease as-sessment systems. Phytopathology 83:806-812.
25. Nutter, F. W., Jr., and Schultz, P. M. 1995. Improving the accuracy and precision of disease assessments: selection of methods and use of computer-aided training programs. Can. J. Plant Pathol. 17:174-185.
26. Nutter, F. W., Jr., Teng, P. S., and Shokes, F. M. 1991. Disease assessment terms and concepts. Plant Dis. 75:1187-1188.
27. Parker, S. R., Shaw, M. W., and Royle, D. J. 1995. Reliable measurement of disease severity. Asp. Appl. Biol. 43:205–214.
28. Pethybridge, S. J., Hay, F. S., and Wilson, C. R, 2004. Pathogenicity of fungi commonly isolated from foliar disease in Tasmanian pyrethrum crops. Australas. Plant Pathol. 33:441-444.
29. Sherwood, R. T., Berg, C. C., Hoover, M. R., and Zeiders, K. E. 1983. Illusions in visual assessment of Stagonospora leaf spot of orchardgrass. Phytopathology 73:173-177.
30. Slopek, S. W. 1989. An improved method for estimating percent leaf area diseased using a 1 to 5 disease assessment scale. Can. J. Plant Pathol. 11:381-387.
31. Stevenson , K. L., and Bertrand, P. F. 2001. Within-season dynamics of yield loss due to pecan scab fruit infections. (Abstr.) Phytopathology 91:S85.
32. Subrahmanyam, P., McDonald, D., Gibbons, R. W., Nigam, S. N., and Nevill, D. J. 1982. Resistance to rust and late leafspot diseases in some genotypes of Arachis hypogea. Peanut Sci. 9:6-10.
33. Turechek, W. W., and Stevenson, K. L. 1998. Effects of host resistance, temperature, leaf wetness, and leaf age on infection and lesion development of pecan scab. Phytopathology 88:1294-1301.
34. Yadav, N. V. S., de Vos, S. M., Bock, C. H., and Wood, B. W. 2011. Devel-opment and validation of standard area diagrams to aide assessment of pe-can scab symptoms on pepe-can fruit. Plant Pathol. Online publication. doi:10.1111/j.1365-3059.2012.02641.x
![Fig. 4. Mean relative error [(absolute error/actual disease severity) × 100] of assessments of two cohorts of images of scab-diseased valves of pecan fruit by experienced and actual disease severity ranges 0 to 6, 6inexperienced raters using A, the nearest](https://thumb-us.123doks.com/thumbv2/123dok_us/8923113.1843547/6.612.59.555.449.725/relative-absolute-severity-assessments-diseased-experienced-severity-inexperienced.webp)