VOLUME 37, ARTICLE 6, PAGES 129
,
146
PUBLISHED 18 JULY 2017
http://www.demographic-research.org/Volumes/Vol37/6/ DOI: 10.4054/DemRes.2017.37.6
Research Article
The effect of contraception on fertility:
Is sub-Saharan Africa different?
John Bongaarts
© 2017 John Bongaarts.
This open-access work is published under the terms of the Creative Commons Attribution NonCommercial License 2. 0 Germany, which permits use, reproduction & distribution in any medium for non-commercial purposes, provided the original author(s) and source are given credit.
1 Introduction 130
2 Methods 131
2.1 TFR adjustments 131
2.2 CPR adjustments 132
2.3 Longitudinal analysis 133
3 Results 134
3.1 Cross-sectional analysis (unadjusted) 134
3.2 Cross-sectional analysis (adjusted) 136
3.3 Pooled cross sections 137
3.4 Trend analysis 138
4 Discussion and conclusion 142
The effect of contraception on fertility:
Is sub-Saharan Africa different?
John Bongaarts1
Abstract
BACKGROUND
Cross-sectional analyses of the relationship between contraceptive prevalence and the total fertility rate of developing countries show the expected strong negative correlation. However, this correlation is much weaker in sub-Saharan Africa than in the developing world as a whole.
OBJECTIVE
This paper aims to explain the unexpected weak effect of contraceptive use on fertility in sub-Saharan African countries by using different regression models to obtain unbiased effects.
METHOD
Using DHS survey data from 40 developing countries, the analysis consists of three steps: 1) examine the conventional cross-sectional TFR-CPR relationship by region at the time of the latest available surveys; 2) remove known technical flaws in the comparisons of fertility and contraceptive prevalence; and 3) analyze multiple observations of TFR and CPR per country using pooled OLS and fixed effect regressions.
RESULTS
The conventional cross-sectional analyses produce biased results, in part because technical factors, in particular postpartum overlap, create a downward bias in the effect of contraceptive prevalence on fertility in sub-Saharan Africa. In addition, and more importantly, the cross-sectional regression OLS parameters have a bias due to confounding country fixed effects. Technical adjustments and the use of fixed-effect models remove these biases.
CONCLUSION
A rise in contraceptive prevalence among fecund women has the same average effect on fertility in sub-Saharan Africa as in other regions of the developing world.
1. Introduction
Individuals who practice contraception intend to avoid pregnancy. It is therefore not surprising that the level of contraceptive use in a population is negatively and causally related to the level of fertility. Typically, the total fertility rate (TFR) is around six to seven births per woman in countries with no contraceptive use, while fertility is near two births per woman in countries in which the contraceptive prevalence rate (CPR) among women in union is around 75% (lower in populations with significant resort to abortion). This inverse relationship has been repeatedly documented using cross-sectional data from a large number of countries (Bongaarts 1984; Mauldin and Segal 1988; Jain et al. 2014; Tsui 2001; Westoff 1990; United Nations 2000).
It came, therefore, as a surprise when an analysis of DHS data from the 1990s by Westoff and Bankole (2001) found the cross-sectional fertility-inhibiting effect of the CPR to be very weak in sub-Saharan Africa. Specifically, in sub-Saharan countries with a high CPR the TFR was not much lower than in countries with a low CPR. Westoff and Bankole (2001) attempted to identify the causes of these anomalous results but concluded, “A variety of explanations were statistically evaluated. Confining the comparisons of the correlations in the two parts of the world to the use of modern methods reduces the difference but by no means erases it. None of the other explanations seem to shed any light.”
This result is consistent with studies of a few individual African countries where fertility is substantially higher than one would expect from the effect of contraceptive prevalence in other developing countries (Adamchak and Mbizvo 1990; Bongaarts 1987; Thomas and Mercer 1995; Jurczynska, Kuang, and Smith 2016). An example is Malawi, where according to 2010 DHS surveys the CPR was 46.1% and the corresponding TFR 5.7 births per woman (Jain et al. 2014). This observed fertility is 1.6 births per woman higher than the level expected from a regression line fitted to the TFR–CPR relationship in a large number of developing countries (Tsui 2001). Other countries in Africa also lie substantially above this regression line, suggesting that contraceptive use has a reduced impact on fertility in Africa compared to other regions in the developing world.
These findings are of concern to policymakers who have invested in family planning programs. If an increase in the CPR brought about by these programs has little effect on fertility in sub-Saharan Africa, then the case for such investments will be diminished.
3) explore the cross-sectional and longitudinal relationships between TFR and CPR with different regression models using multiple observations per country. As will be demonstrated, this approach provides valuable new insights into the discrepancies found for sub-Saharan Africa. In particular, the conventional cross-sectional regressions will be shown to give misleading estimates of the true impact of rising contraceptive prevalence on fertility.
2. Methods
The first step in this analysis is to update the cross-sectional plot Westoff and Bankole used to demonstrate a weak link between the TFR and CPR in sub-Saharan Africa and other regions of the developing world. The new plot will be based on the latest available DHS data on fertility and contraceptive prevalence in 40 developing countries. To simplify the analysis and to ensure robust results, the countries included met the following criteria: population over 2.5 million, survey sample size of married women over 3,000, never member of Soviet Union, and a minimum of two surveys undertaken more than five years apart.2 A total of 40 countries met these criteria, 24 in sub-Saharan
Africa, 11 in Asia and North Africa, and 5 in Latin America.
For each of these countries DHS estimates of the TFR (three years before the survey) and the contraceptive prevalence among women in union are directly estimated from the most recent available DHS survey data.3 OLS regressions are then used to
estimate the slope of the TFR–CPR relationship separately for all countries, for sub-Saharan countries, and for countries in other regions. These regressions will be referred to as the ‘basic model.’
The next step is to make a number of adjustments to the TFR and to the CPR estimates to address known technical issues that bias the basic model.
2.1 TFR adjustments
Errors in DHS fertility estimates. A recent examination of the quality and accuracy of fertility estimates from DHS surveys found large errors (some in excess of 10%) in a
2 Haiti and Yemen were also excluded because their trends in TFR and CPR were distorted by civil strife and
natural disasters
3 To maintain consistency over time and between countries, prevalence estimates are based on the following
number of countries, especially in Africa (Schoumaker 2014). These errors are usually the result of misreporting of the dates of recent births, with births being displaced into the past and thus yielding an underestimate of the TFR in the three years before the survey. To avoid this problem I rely here on TFR estimates from the UN, which makes adjustments when errors are evident and relies on multiple sources of data on fertility (Gerland 2014; United Nations 2015). This source provides annual estimates of the TFR from 1950 to 2016 for all countries, based on models fitted to available estimates from DHS surveys and other national sources.
Delayed impact of contraception. The basic model compares the CPR at the time of the survey with a TFR estimate for the period of three years before the survey. This comparison ignores the fact that a change in contraceptive use at a given point in time affects fertility nine months in the future. To be accurate the prevalence at the time of the survey should be compared with the TFR nine months later rather than with the TFR for the three years preceding the survey. When fertility is declining the former will be smaller than the latter. In many countries the TFR changes sufficiently slowly over time that this error is small, but in a number of countries with rapidly changing fertility the error can be substantial. This issue is addressed here by estimating the TFR nine months after the survey date by interpolating annual TFR estimates from the UN (this requires an estimate of fertility in the year after the DHS survey, which may be based on extrapolation for recent surveys).
2.2 CPR adjustments
Exposure to risk of pregnancy. The conventional contraceptive prevalence rate is measured among women in union (married or living together) while the TFR measures all births regardless of whether they occur in or out of union. This approach is becoming increasingly problematic, as extramarital sex and pregnancy have risen over time. To address this issue I measure prevalence among all women who are considered exposed (i.e., those who are in union as well as those who are sexually active, pregnant, or using contraception outside a union).
Overlap with postpartum infecundability. Fertility is not affected by the use of contraception among women who are not at risk of pregnancy because they are amenorrheic or are abstaining following a pregnancy (Adamchak and Mbizvo 1990; Stover 1998; Thapa et al. 1992; Bongaarts 2015). This overlap is therefore excluded in the adjusted prevalence estimates.
adjusted CPR is calculated as the weighted average of methods’ specific prevalence, with the weights given by the level of effectiveness of each method.
Remove confounding effects of variations in the age structure of women of reproductive age. The conventional CPR is obtained by dividing the number of contraceptive users by the number of married women aged 15–49. This estimate is affected by the distribution of women by age, since prevalence varies by age. By contrast, the TFR is not influenced by the age structure. To remove this dependency on the age distribution of women the adjusted CPR is calculated as the weighted average of age-specific prevalence rates. The weights reflect the fecundity level by age and are the same for all countries. This procedure removes the effect of variation among countries in the age structure of the population of women of reproductive age on the conventional CPR.
Details about the implementation of these adjustments can be found in Bongaarts (2015).
The adjusted estimates of the TFR and CPR will be referred to as TFR* and CPR* respectively. Each of the above adjustments slightly changes the regression relationship between fertility and prevalence observed in the basic model. The results of the basic model will be compared with the adjusted model.
2.3 Longitudinal analysis
The next part of the analysis again uses OLS to examine the relationship between the TFR* and CPR*, but pools estimates from three cross sections of data. Three data points are included for each country: 1) the latest available DHS survey; 2) the earliest available DHS survey, mostly in the 1990s; and 3) the year of the highest observed fertility in the UN time series of historical fertility estimates before the 1990s. The latter is a maximum that may occur any time between 1950 and 1990. Fertility in that year is assumed to be natural and contraceptive use is assumed absent. OLS regressions of the pooled set are compared with the regressions of the single cross section based on the most recent survey.
3. Results
3.1 Cross-sectional analysis (unadjusted)
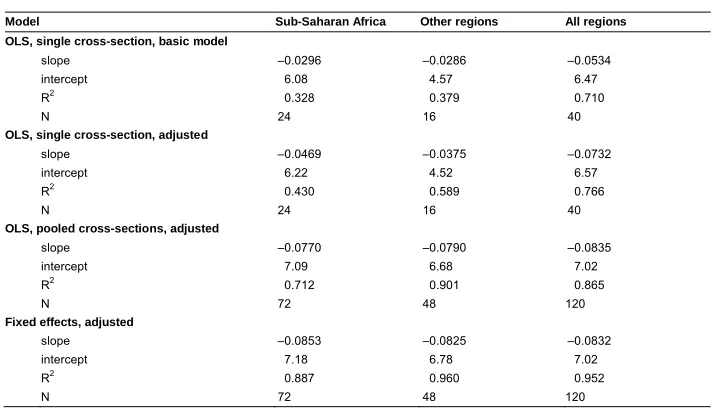
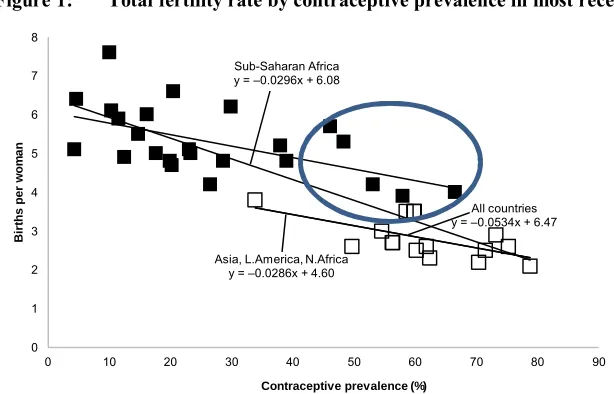
Figure 1 plots the TFR by the CPR from the most recent DHS survey. Points representing individual countries are given separately for sub-Saharan Africa (solid square markers) and other regions (open squares). Regression lines (OLS) are fitted to the data for all countries combined and separately for sub-Saharan Africa and the other regions. The regression coefficients are summarized in Table 1. For present purposes the slope of the regression line is the most salient indicator, as it measures the change in TFR for a one-percentage-point increase in the CPR. According to the regression for all developing countries, the slope equals –0.053. That is, a 10% increase in the CPR is associated with a decline of 0.53 births per woman in the TFR. This regression line appears to be plausible. The intercept equals 6.47 births per woman, which is close to the average of 6.58 births per women in the least-developed parts of the world in the 1950s (when CPR was near zero in these countries). Furthermore, extrapolating the regression line to 100% prevalence yields a TFR of 1.1 births per woman, which does not seem unreasonable since contraceptive failures occur even when contraception is universally practiced.
Table 1: Regression coefficients predicting the total fertility rate from contraceptive prevalence, by region, OLS and fixed effects models
Model Sub-Saharan Africa Other regions All regions
OLS, single cross-section, basic model
slope –0.0296 –0.0286 –0.0534 intercept 6.08 4.57 6.47
R2 0.328 0.379 0.710
N 24 16 40
OLS, single cross-section, adjusted
slope –0.0469 –0.0375 –0.0732 intercept 6.22 4.52 6.57
R2 0.430 0.589 0.766
N 24 16 40
OLS, pooled cross-sections, adjusted
slope –0.0770 –0.0790 –0.0835 intercept 7.09 6.68 7.02
R2 0.712 0.901 0.865
N 72 48 120
Fixed effects, adjusted
slope –0.0853 –0.0825 –0.0832 intercept 7.18 6.78 7.02
R2 0.887 0.960 0.952
By contrast, the slope for Africa is only –0.029, about half the value for all countries. This finding is consistent with the claim of Westoff and Bankole (2001) that the effect of the CPR on the TFR is substantially weaker in sub-Saharan Africa than predicted by the basic model for all countries.
The regression line for the other regions also has unexpected characteristics. First, the slope is –0.028, virtually the same as for sub-Saharan Africa and about half the slope for all countries. Second, the intercept is 4.57, which is implausible because in pretransitional years in the past, when contraception was nearly absent, fertility in countries in Asia, Latin America, and North Africa was typically around six births per woman.
These findings on differences in the regression results of different regions suggest confounding by other fertility-reducing factors. This hypothesis will be confirmed below.
Figure 1 also shows considerable deviation from the regression lines in a number of countries in sub-Saharan Africa. A full discussion of the reasons for these deviations is beyond the scope of this paper, but it is worth noting that the five sub-Saharan countries with the highest contraceptive prevalence (encircled) all lie above the general regression line for all countries and are all in eastern Africa: Malawi, Kenya, Rwanda, Zambia, and Zimbabwe. For example, Malawi has the largest deviation of 1.8 births per woman. The unexpectedly high fertility of these five high-prevalence countries is largely responsible for the low slope in the basic model for sub-Saharan Africa.
Figure 1: Total fertility rate by contraceptive prevalence in most recent DHS
Source: DHS data files.
Asia, L.America, N.Africa y = –0.0286x + 4.60
All countries y = –0.0534x + 6.47 Sub-Saharan Africa
y = –0.0296x + 6.08
0 1 2 3 4 5 6 7 8
0 10 20 30 40 50 60 70 80 90
B ir th s p e r w o m a n
3.2 Cross-sectional analysis (adjusted)
The next step is to examine the same regressions with adjusted estimates of prevalence and fertility. The results are summarized in Table 1. Figure 2 plots the adjusted TFR* by the CPR* and the related regression lines. For all countries the adjusted slope is –0.073, somewhat higher than in the basic model. The slope for the sub-Saharan Africa regression has improved from –0.028 in the basic model to –0.047, thus moving it substantially closer to the slope for all countries. The deviation of Malawi has declined from 1.8 to 1.2 births per woman. These results indicate that the adjustments have made a difference. However, the sub-Saharan Africa slope is still well below the estimate for all countries (–0.047 vs. –0.073). The intercept for other regions also remains implausibly low. The puzzle of the unexpected findings for sub-Saharan Africa is only partly solved by the technical adjustments made to the total fertility rate and contraceptive prevalence.
Figure 2: Total fertility rate by contraceptive prevalence in most recent DHS, with TFR and CPR adjustments
Source: DHS data files and UN 2015.
A comparison of the effect of the different adjustments on the differences between Figures 1 and 2 shows that the introduction of contraceptive effectiveness is a key cause of the increase in the slopes of all three regressions. This change is the result of replacing the prevalence of each country with a slightly lower adjusted prevalence to account for the fact that contraception on average is less than 100% effective in all countries. The comparison of basic and adjusted models also shows that the increase in
Asia, L.America, N.Africa y = –0.0375x + 4.52
All countries y = –0.0732x + 6.57 Sub-Saharan Africa
y = –0.0469x + 6.22
0 1 2 3 4 5 6 7 8 9
0 10 20 30 40 50 60 70 80
B ir th s p e r w o m a n
the slope is greater for sub-Saharan African countries than for other countries. This finding is mostly due to the elimination of postpartum overlap, which is much more common in sub-Saharan African countries with high CPR than elsewhere. The countries with the largest overlap are Malawi (10 percentage points of CPR) and Zimbabwe (13 percentage points of CPR).
3.3 Pooled cross sections
The preceding cross-sectional analyses relied on estimates from the most recent DHS only. Similar estimates are available from earlier surveys for the same countries, thus allowing a more comprehensive examination of the relationship between fertility and contraceptive prevalence. Figure 3 plots the TFR* by CPR* pooling three data points for each of the 40 countries. As noted, the three points are observations from the most recent survey, from the earliest available survey, and from the date of maximum fertility. The number of points plotted is therefore 120 (3x40).
Figure 3: Total fertility rate by contraceptive prevalence, with adjustments, three cross-sections
Source: DHS data files and UN 2015.
Asia, L.America, N.Africa y = –0.0790x + 6.68 Sub-Saharan Africa
y = –0.0770x + 7.09
0 1 2 3 4 5 6 7 8 9
0 10 20 30 40 50 60 70 80
B
ir
th
s
p
e
r
w
o
m
a
n
The pooled OLS regressions provide several notable findings. First, the slopes for all regional regressions have increased substantially. Second, these slopes are very similar to one another, and third, the difference in intercepts between sub-Saharan Africa and other regions has narrowed to 0.4 births per woman (7.09–6.68) compared with a much larger difference in the single cross-section in Figures 1and 2.
The major differences between the results of the single and pooled cross-sectional analyses strongly suggest that the regression estimates for the single cross section in Figures 1 and 2 are biased as the result of confounding factors. This bias will be addressed next.
3.4 Trend analysis
Figure 4 plots trends in TFR* by CPR*. Each country is represented by a line that connects three data points: from the pre-transitional high, to the first survey in the 1990s, to the latest survey. A key finding is that the trends in most countries are approximately linear. This is consistent with analytic models of the relationship between prevalence and fertility (Bongaarts and Potter 1983). Another notable feature of Figure 4 is that the trajectories of most individual countries run more or less parallel to one another. This means that as prevalence rises over time, countries with high pretransitional fertility tend to stay above the regional regression line and countries with low pretransitional fertility tend to stay below this regression line. The factors responsible for these deviations of individual countries from one another will not be examined here, but they are the combined effects of other proximate determinants of fertility such as fecundity, marriage pattern, postpartum amenorrhea or abstinence, frequency of intercourse, and abortion.
0 1 2 3 4 5 6 7 8 9
0 10 20 30 40 50 60 70 80
B
ir
th
s
p
e
r
w
o
m
a
n
Contraceptive prevalence %
Sub-Saharan Africa y = –0.0853+7.18 Figure 4: Trends in total fertility rate by contraceptive prevalence with
adjustments. Average fixed effects regression lines by region
Source: DHS data files and UN 2015.
The fixed-effect model also provides regression estimates for each country. Figure 5 compares fixed-effects model estimates with observed trends in three sub-Saharan countries: Kenya, Malawi, and Ghana. Each country subfigure includes three lines: 1) the observed trend in the TFR* (solid line), 2) the model estimates for the country (dashed line), and 3) the average model estimates for sub-Saharan Africa (dotted line). The difference between the dotted and dashed lines (which are parallel) represents the fixed effect of each country. It is positive in Malawi (0.53 births per woman) and Kenya (0.95) and negative in Ghana (–0.54). (See Blanc and Grey 2002 for a discussion of the Ghana case). The fixed effect regression models for each country fit quite well and the large differences between observed and estimated TFR* in cross-sectional regressions have been reduced to a few tenths of a birth per woman. A part of the remaining differences can be attributed to measurement errors.
Asia, L.America, N.Africa y = –0.0825+6.78
Kenya Malawi
Figure 5: Trends in total fertility rate by contraceptive prevalence with adjustments. Fitted fixed effects regression lines
0 1 2 3 4 5 6 7 8 9
0 10 20 30 40 50 60 70 80
B ir th s p e r w o m a n
Contraceptive prevalence (%) a) Malawi
Observed
Regression line, Malawi (fe) Regression line, SSA (fe)
0 1 2 3 4 5 6 7 8 9
0 10 20 30 40 50 60 70 80
B ir th s p e r w o m a n
Contraceptive prevalence (%)
b) Kenya
Observed
Regression line Kenya (fe) Regression line SSA (fe)
0 1 2 3 4 5 6 7 8
0 10 20 30 40 50 60 70 80
B ir th s p e r w o m a n
Contraceptive prevalence (%) c) Ghana
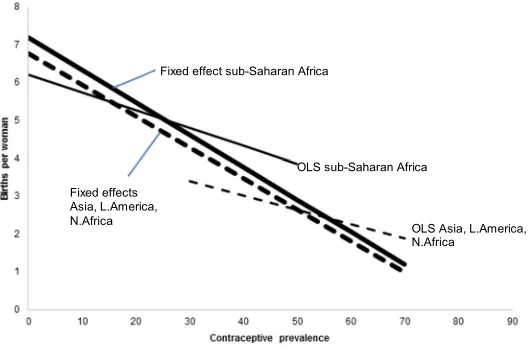
Figure 6 compares the main findings from the cross-sectional and longitudinal regressions. The heavier solid and dashed lines represent the average regression lines from the fixed effects models for sub-Saharan Africa and for other regions, while the thin solid and dashed lines represent the regression lines from the OLS models for sub-Saharan Africa and for other regions (all based on adjusted estimates of TFR* and CPR*). As noted above, the slopes for the fixed effects models are steeper than for the OLS models. There are two reasons why the cross-sectional adjusted results are biased downwards. First, the country trajectories are best described with fixed effects models, which means that each country has its own trajectory above or below (but parallel to) the average. The existence of fixed effects alone does not cause the cross-sectional results to be biased. This bias arises if the country fixed effects are correlated with the independent variable, which is contraceptive prevalence. This bias can be downward, zero, or upward, depending on whether the correlation between the fixed effects and prevalence is positive, zero, or negative. In the present case the cross-sectional slope is biased downward because the fixed effect is positively correlated with prevalence (e.g., the East African countries have positive fixed effects and they also have relatively high prevalence for sub-Saharan Africa). The single cross-sectional regressions are therefore a misleading guide for predicting or assessing the impact of changes in prevalence on fertility. The reason why the fixed effects are positively correlated with contraceptive prevalence is unclear and is not required for the estimation of the fixed effects model. This could be the subject of another study.
Figure 6: Regression lines from fixed effect and OLS models, adjusted estimates
Source: Calculated from DHS files and UN 2015.
Fixed effect sub-Saharan Africa
OLS sub-Saharan Africa
OLS Asia, L.America, N.Africa
4. Discussion and conclusion
The most important finding from this study is that the regression slopes of the longitudinal country trajectories in sub-Saharan Africa are not significantly different from the slopes for all regions or for other regions. This implies that a rise in contraceptive prevalence among fecund women in sub-Saharan Africa reduces fertility on average by approximately the same amount as elsewhere: Sub-Saharan Africa is not unique in this regard. However, despite the similar slopes, sub-Saharan countries on average have a slightly higher level of fertility than other regions for a given level of contraceptive prevalence. The difference ranges from 0.41 births per woman when CPR*=0 to 0.21 with CPR*=70%.
The conventional single cross-sectional regressions produce biased results for the impact of contraceptive effects on fertility in sub-Saharan Africa, for three reasons. First, technical factors, in particular post-partum overlap, bias the regression slopes downward compared to the regression for all countries. Second, the cross-sectional results are confounded by fertility differences between countries that are approximately constant over time. For example, most of East Africa has higher pretransitional fertility than other parts of the continent. This difference has been maintained after the transition onset and the TFR trajectories of many East African countries therefore lie slightly above, but are parallel to, the trajectories of other African countries. The differences in TFR trajectories between countries are due to differences in one or more of the other proximate determinants (including exposure to risk of pregnancy, postpartum infecundability, contraceptive effectiveness, frequency of intercourse, and biological fecundity), which tend to persist over time. Third, this difference plus the positive correlation of country effects with contraceptive prevalence yield an additional downward bias in the slope of the cross-sectional regression.
These biases are reduced or eliminated here by relying on adjusted estimates of fertility and contraceptive prevalence and by using fixed effect regressions. These models provide a much better fit to the data than the single cross-sectional regression. For example, in sub-Saharan Africa the latter has an R2 of 0.33 while the former has an
R2 of 0.89 (see Table 1). Future studies of the TFR–CPR relationship should preferably
use the technical adjustments proposed here and rely on longitudinal rather than cross-sectional analyses.
References
Adamchak, D.J. and Mbizvo, M.T. (1990). The relationship between fertility and contraceptive prevalence in Zimbabwe. International Family Planning Perspectives 16(3): 103–106.doi:10.2307/2133307.
Blanc, A.K. and Grey, S. (2002). Greater than expected fertility decline in Ghana: Untangling a puzzle.Journal of Biosocial Science 34(4): 475–495.doi:10.1017/ S0021932002004753.
Bongaarts, J. (1984). Implications of future fertility trends for contraceptive practice.
Population and Development Review 10(2): 341–352.doi:10.2307/1973086. Bongaarts, J. (1987). The proximate determinants of exceptionally high fertility.
Population and Development Review 13(1): 133–139.doi:10.2307/1972125. Bongaarts, J. (2015). Modeling the fertility impact of the proximate determinants: Time
for a tune-up. Demographic Research 33(19): 535–560. doi:10.4054/DemRes. 2015.33.19.
Bongaarts, J. and Potter, R.G. (1983). Fertility, biology and behavior: An analysis of the proximate determinants. New York: Academic Press.
Gerland, P. (2014). UN Population Division’s methodology in preparing base population for projections: Case study for India.Asian Population Studies 10(3): 274–303.doi:10.1080/17441730.2014.947059.
Jain, A., Ross, J., Gribble, J., and McGinn, E. (2014). Inconsistencies in the total fertility rate and contraceptive prevalence rate in Malawi. Washington, D.C.: Futures Group, Health Policy Project.
Jurczynska, K., Kuang, B., and Smith, E. (2016).Accounting for the mismatch between predicted and observed fertility in sub-Saharan Africa. Paper presented at the Population Association of America Annual Meeting, Washington, D.C., March 31–April 2, 2016.
Mauldin, W.P. and Segal, S.J. (1988). Prevalence of contraceptive use: Trends and issues.Studies in Family Planning 19(6): 335–353.doi:10.2307/1966628. Schoumaker, B. (2014). Quality and consistency of DHS fertility estimates, 1990 to
2012. Rockville: ICF International (DHS Methodological Reports No. 12). Stover, J. (1998). Revising the proximate determinants of fertility framework: What
Thapa, S., Kumar, S., Cushing, J., and Kennedy, K. (1992). Contraceptive use among postpartum women: Recent patterns and programmatic implications.
International Family Planning Perspectives 18(3): 83–92.doi:10.2307/2133407. Thomas, N. and Mercer, C. (1995). An examination of the fertility/contraceptive
prevalence anomaly in Zimbabwe.Genus 51(3–4): 179–203.
Tsui, A.O. (2001). Population policies, family planning programs, and fertility: The record.Population and Development Review 27(Supplement): 184–204.
United Nations (2000). Levels and trends of contraceptive use as assessed in 1998. New York: United Nations.
United Nations (2015). World population prospects: The 2015 revision. New York: United Nations.
Westoff, C.F. (1990). Reproductive preferences and fertility rates.International Family Planning Perspectives 16(3): 84–89+96.