Open Access
Research
Effect of long-term exposure of SH-SY5Y cells to morphine: a whole
cell proteomic analysis
Jérémie Neasta
1, Sandrine Uttenweiler-Joseph
2, Karima Chaoui
1,
Bernard Monsarrat
2, Jean-Claude Meunier
1and Lionel Moulédous*
1Address: 1Unité Mécanismes d'action des substances opioïdes, Institut de Pharmacologie et de Biologie Structurale, Centre National de la
Recherche Scientifique UMR 5089, 205 route de Narbonne, 31077 Toulouse cedex 04, France and 2Unité Spectrométrie de masse et structure des
biomolécules, Institut de Pharmacologie et de Biologie Structurale, Centre National de la Recherche Scientifique UMR 5089, 205 route de Narbonne, 31077 Toulouse cedex 04, France
Email: Jérémie Neasta - [email protected]; Sandrine Uttenweiler-Joseph - [email protected]; Karima Chaoui - [email protected]; Bernard Monsarrat - [email protected]; Jean-Claude Meunier - [email protected]; Lionel Moulédous* - [email protected] * Corresponding author
Abstract
Background: Opiate addiction reflects plastic changes that endurably alter synaptic transmission within relevant neuronal circuits. The biochemical mechanisms of these adaptations remain largely unknown and proteomics-based approaches could lead to a broad characterization of the molecular events underlying adaptations to chronic drug exposure.
Results: Thus, we have started proteomic analyses of the effects of chronic morphine exposure in a recombinant human neuroblastoma SH-SY5Y clone that stably overexpresses the μ-opioid receptor. Cells were treated with morphine for 6, 24 and 72 hours, the proteins were separated by 2-D gel electrophoresis and stained with Coomassie blue, and the protein map was compared with that obtained from untreated cells. Spots showing a statistically significant variation were selected for identification using mass spectrometric analyses.
Conclusion: A total of 45 proteins were identified, including proteins involved in cellular metabolism, cytoskeleton organization, vesicular trafficking, transcriptional and translational regulation, and cell signaling.
Background
Opiate addiction, a pathological form of learning and memory associated with repeated drug use or administra-tion, reflects neuronal adaptive/plastic changes that endurably alter synaptic transmission within relevant cir-cuits in the central nervous system [1-4]. The biochemical mechanisms underlying the functional and structural adaptations to chronic opiate exposure remain largely unknown. Elucidating them in details is important, as this is expected to reveal novel pharmacological strategies for
preventing formation and/or expression of dependence, with potential benefits for the treatment of chronic pain and addiction.
The biochemical mechanisms of drug dependence have begun to be examined globally by using DNA microarray-and/or proteomics-based approaches. Thus, DNA micro-array-based approaches have been used in order to study gene expression induced by drugs of abuse [5], including opiates [6,7], but interpretation of the results is limited –
Published: 21 December 2006
Proteome Science 2006, 4:23 doi:10.1186/1477-5956-4-23
Received: 19 September 2006 Accepted: 21 December 2006
This article is available from: http://www.proteomesci.com/content/4/1/23
© 2006 Neasta et al; licensee BioMed Central Ltd.
Proteome Science 2006, 4:23 http://www.proteomesci.com/content/4/1/23
mRNA levels do not necessarily reflect proteins levels [8] – and no information about post-transcriptionally modi-fied proteins is provided. In principle, proteomics-based approaches could lead to a much broader characterization of the molecular events underlying drug dependence. Yet, the successful application of differential proteomics to identify drug-induced protein changes in the central nerv-ous system represent a technical challenge because of its cellular heterogeneity [9].
Obviously, sample heterogeneity is much less of a prob-lem in cultured clonal cell lines than in nerve tissue. Thus, we have started proteomic analyses of the effects of chronic morphine exposure in a recombinant human neuroblastoma SH-SY5Y clone that stably overexpresses the μ-opioid (MOP) receptor. Wild-type SH-SY5Y cells express low levels of MOP receptor, and even lower (3- to 4-fold) levels of delta opioid (DOP) receptor [10], and are only poorly responsive to both acute and long-term mor-phine treatment [11]. In marked contrast, in MOP recep-tor-overexpressing cells, acute morphine is much more potent and efficacious in inhibiting forskolin-elicited pro-duction of cAMP, and chronic morphine induces a higher degree of adenylate cyclase sensitization, a hallmark of opiate dependence, than in the parent (wild type) cells [11]. The dramatically increased responsiveness of MOP-overexpressing over wild-type cells is an indication that the observed effects are MOP receptor- rather than DOP receptor-mediated. The cells were treated with morphine for 6, 24 and 72 hours, the proteins were separated by 2-D electrophoresis (2-2-DE) and stained with colloidal Coomassie blue, and the protein map was compared with that obtained from untreated cells. Spots showing a statis-tically significant variation were selected for identification using a combination of MALDI-TOF MS (matrix-assisted laser desorption/ionization time of flight mass spectrom-etry) and nanoLC-ESI-Q-TOF MS/MS (liquid-chromatog-raphy electrospray ionization quadrupole time of flight) analyses. A total of 45 proteins were found to have varied in abundance in the course of long-term exposure to mor-phine, including proteins involved in cellular metabo-lism, cytoskeleton organization, vesicular trafficking, transcriptional and translational regulation, and cell sign-aling.
Results
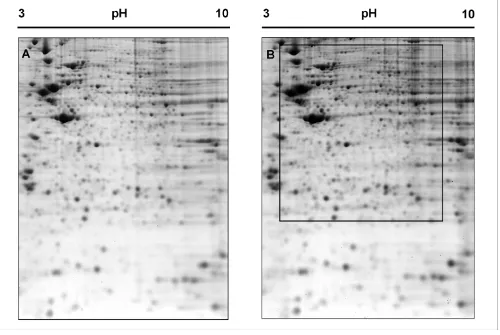
Figure 1 shows a representative bi-dimensional map of the proteome of untreated (control) neuroblastoma SH-SY5Y cells. Colloidal Coomassie blue protein staining, followed by automatic feature detection and manual edit-ing enabled visualization of about 950 individual spots on a 2-D gel.
The protein map of neuroblastoma cells having been treated with 1 μM morphine for 6 hours was compared
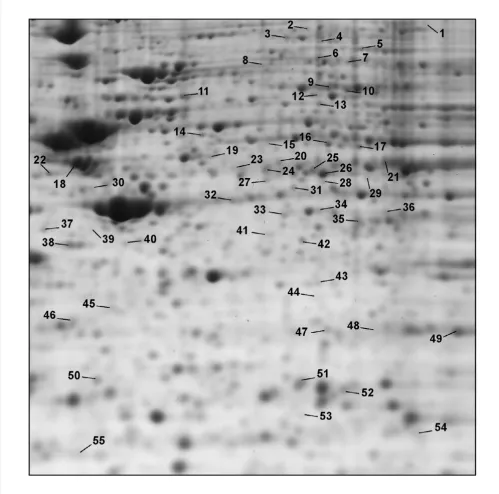
with that of untreated cells. A 6 h treatment with mor-phine was selected since such treatment was previously shown to elicit nearly maximum sensitization of ade-nylate cyclase, an index of opiate dependence, in these cells [11]. As shown on Figure 1, the protein pattern from 6 h-treated cells was globally very similar to that of control cells. After image analysis, the abundance of each spot was estimated relative to the abundance of all spots in the gel (see Methods). Four control gels were matched with four 6 h morphine-treatment gels and the spots showing a sta-tistically significant variation in relative abundance (Stu-dent t test, p < 0.05) were selected for i(Stu-dentification by mass spectrometry. Eighteen spots displayed such signifi-cant variation: 11 spots were upregulated by a factor 1.22 to 2.03 following morphine treatment, while 7 spots were downregulated by a factor 0.35 to 0.75. These spots were cut from a gel, digested by trypsin and analyzed by pep-tide mass fingerprinting using MALDI-TOF mass spec-trometry. When peptide mass fingerprinting data was not sufficient for confident identification, trypsin digests were also analyzed using nanoLC-ESI-MS/MS. The combina-tion of these two methods enabled the unambiguous identification of 18 proteins whose name, accession number, change in relative abundance and MS data are summarized on Table 1. Spot numbers in this table refer to the ones in Figure 2, which depicts the location of every spot that was identified in this study on a representative 2-D gel. Spot 11 could not be identified while spot 24 con-tained a mixture of 2 proteins.
We next examined the proteome effects of exposing the neuroblastoma cells to morphine (1 μM) for longer peri-ods of time, i.e. 24 and 72 hours. Twenty one spots were found to display a significant variation in relative abun-dance after a 24 h morphine treatment: 11 spots were upregulated by a factor 1.18 to 1.84, whilst 10 spots were downregulated by a factor 0.45 to 0.84. Among these, 18 spots could be attributed to one protein, and 3 spots con-tained a mixture of 2 proteins (Table 2). 2 spots with sim-ilar molecular weights but different pIs contained the same protein (α-enolase). The relative volume of these 2 spots varied in opposite direction after morphine treat-ment suggesting a change in post-translational modifica-tion, possibly phosphorylation. Twenty-five spots displayed a significant variation in relative abundance after a 72 h morphine treatment: 5 spots were upregulated by a factor 1.1 to 1.79, whilst 20 spots were downregu-lated by a factor of 0.45 to 0.84. Among these, 21 could be attributed to one protein, 2 contained a mixture of 2 pro-teins, and 2 could not be identified (Table 3).
syn-thase subunit B and bifunctional purine biosynthesis protein were upregulated at 6 and 24 h. Rab7 was down-regulated at 6 and 24 h while guanine nucleotide binding protein β subunit 2-like 1 (also known as RACK1) was downregulated at 6 and 72 h. Adenylosuccinate syn-thetase 2 was upregulated at 6 h and downregulated at 72 h. Septin 11 and spot 24 containing a mixture of Rab GDI
β and mitochondrial-processing peptidase β were upregu-lated at 6 h, returned to baseline at 24 h and showed only a minor upregulation at 72 h. Finally, only malate dehy-drogenase was downregulated at each time point.
Discussion
Overall, the present whole cell proteomic analysis has identified 53 proteins from 55 spots whose relative vol-ume is modified upon morphine treatment in SH-SY5Y cells. Once mixtures are excluded, 45 morphine-respon-sive proteins can be classified according to cellular func-tion (see Addifunc-tional file 1). These are involved in cell metabolism, organization of the cytoskeleton, vesicle
traf-ficking, transcriptional regulation, protein translation, folding and degradation, and cell signaling.
The pattern of morphine-responsive proteins appears to be dependent on the duration of morphine treatment (compare Tables 1, 2 and 3), indicating that cellular adap-tation to chronic morphine is a dynamic process. Such dynamic adaptation has previously been documented in the striatum of chronically morphine-treated rats, wherein various members of the Fos family of transcrip-tion factors are sequentially upregulated, implying that distinct sets of genes are regulated over time [3]. Alterna-tively, it is possible that changes could have been missed at some time point due to technical limitation. For exam-ple, RACK1 was found to be downregulated at each time point but this downregulation reached statistical signifi-cance only for the 6 and 72 h time points. The difficulty to detect subtle variations in low abundance proteins is a well known limitation of large scale proteomic studies. Thus, the present whole cell analysis failed to detect
2-DE pattern of untreated (A) and 6 h morphine-treated (B) SH-SY5Y cells
Figure 1
Proteome Science 2006, 4:23 http://www.proteomesci.com/content/4/1/23
changes in heterotrimeric G protein β subunits and pro-hibitin whose relative abundance was previously shown to be decreased in the detergent-resistant membrane (DRM) raft fraction isolated from morphine-treated cells [11]. This is readily explained by the fact that standard sample preparation for 2-DE (the present study), which involves incubation with Triton X-100 at 4°C followed by high speed centrifugation, has eliminated the DRM raft fraction and the proteins which this fraction is enriched in, including heterotrimeric G protein subunits [11]. In addition, the present study has focused onto the ~950 most abundant and soluble proteins of the cell, which represent only 1 to 10% of the total protein species likely to be expressed in a cell. This illustrates the necessity of combining both whole cell and sub-proteome targeted analyses to obtain a clear picture of the proteome of a given cell type.
Four recently published proteomic analyzes have addressed chronic morphine effects in the brain [12-15]. Seven of our morphine-responsive proteins, or closely related isoforms, were also found to be modified in these studies: ATP synthase beta chain, vacuolar ATP synthase subunit B, malate dehydrogenase, triosephosphate iso-merase, rab GDP dissociation inhibitor beta, peptidyl-prolyl isomerase, and septin-11. These are indications that at least some of the brain protein changes associated with chronic morphine treatment in vivo can be reproduced in our cellular model in vitro after a relatively short time of
morphine exposure. Conversely, some of the new changes identified in our present in vitro study may provide hints as to what neuronal processes may be regulated upon chronic morphine treatment in vivo.
Ascribing a precise role for the identified proteins in medi-ating specific chronic morphine effects in neurons would be too speculative at this stage. However it appears note-worthy to highlight possible links between selected pro-teins identified in this study and known effects of chronic morphine. Similar to what was recently described for cocaine [16], some of morphine transcriptional effects could be mediated at the level of histone acetylation and chromatin remodeling since two histone acetyltransferase subunits (RuvB-like 1 and histone acetyltransferase type B subunit 2) are upregulated after 24 h of treatment. The variation in 20S proteasome subunit composition observed after 72 h of morphine is consistent with previ-ous studies demonstrating a role for the ubiquitin/protea-some pathway in mediating chronic morphine effects [11,17].
Such transcriptional and post-translational regulations can lead to numerous changes in cellular function among which alterations in cellular architecture [18,19], vesicle trafficking [4] and signal transduction pathways are essen-tial for drug-induced neuronal plasticity. Regarding neu-ronal architecture and synaptic remodelling, potentially interesting morphine targets are ERM proteins, septins
Table 1: Proteins whose abundance in SH-SY5Y cells is regulated after 6 h of morphine treatment
Spot # Protein Accession # (a) MW (Da) Variation (% of control) (b)
MALDI peptides % coverage MS/MS peptides (c)
2 Elongation factor G 1 Q96RP9 83506 42 ± 11 13 16
3 Ezrin P15311 69268 165 ± 26 10 15
5 Lamin A/C P02545 74139 203 ± 21 18 32
9 Bifunctional purine biosynthesis protein P31939 65088 122 ± 16 14 30
11 no identification 52 ± 10
14 Vacuolar ATP synthase subunit B, brain
isoform P21281 56501 151 ± 17 18 54
15 Rho-GTPase-activating protein 1 Q07960 50461 166 ± 44 4
17 Septin-11 Q9NVA2 49267 141 ± 19 13 37
18 ATP synthase beta chain P06576 56560 35 ± 9 10 48
24 Rab GDP dissociation inhibitor beta Mitochondrial-processing peptidase beta subunit
P50395 O75439
50663 55072
136 ± 16 14
12
36 25
27 Synaptic vesicle membrane protein VAT-1
homolog Q99536 41920 141 ± 17 7 31
28 Adenylosuccinate synthetase 2 P30520 50097 147 ± 14 5
36 40 kDa peptidyl-prolyl cis-trans isomerase Q08752 40632 174 ± 42 12 26
44 Malate dehydrogenase, cytoplasmic P40925 36295 50 ± 9 11 32
49 Guanine nucleotide binding protein beta subunit 2-like 1
P63244 35077 75 ± 15 15 69
52 Platelet-activating factor acetylhydrolase IB gamma
Q15102 25734 70 ± 14 5
53 Triosephosphate isomerase P60174 26538 186 ± 60 13 65
54 Ras-related protein Rab-7 P51149 23490 56 ± 13 13 65
aSwiss-Prot primary accession number bMean ± S.D., control refers to untreated cells.
[20] and Rho-GTPase-activating protein 1 [21]. Concern-ing vesicular transport, the SNAP-alpha downregulation observed in our study is consistent with the recent obser-vation that chronic morphine could induce an inhibition of SNARE complex formation [22]. Morphine could also act at the level of small GTPases of the rab family which
are essential for vesicle trafficking. The observed increase in rab GDP dissociation inhibitor beta after 72 h of mor-phine could result in an alteration of the amount of active rab proteins available for neurotransmitter release [23]. These data are all consistent with chronic morphine mod-ifying neurotransmitter secretion and synapse efficacy.
Close-up from a representative 2-D gel showing the spots whose abundance in SH-SY5Y cells is regulated after chronic mor-phine treatment
Figure 2
Proteome Science 2006, 4:23 http://www.proteomesci.com/content/4/1/23
Finally, chronic morphine induced a change in abun-dance of several signaling proteins: heterotrimeric G pro-tein subunit α i2, serine-threonine kinase receptor associated protein and receptor for activated C kinase 1 (RACK1). The downregulation of Gα i2 has already been described in our previous study [11] and will not be dis-cussed further. The observed upregulation of serine-threo-nine kinase receptor associated protein provides a new link between morphine signaling and the phosphatidyli-nositol 3-kinase/Akt pathway [24]. RACK1 downregula-tion in brains of morphine-treated rats has been described previously but it has only been discussed in terms of changes in PKC activity since it was its only known func-tion at this time [25]. Since then, RACK1 has been charac-terized as a scaffolding protein for many proteins involved in cell signaling [26]. Alterations in RACK1 abundance could thus coordinate changes in distinct signaling path-ways and its role in molecular adaptations to drugs of abuse deserves further investigation [27].
Conclusion
In conclusion, our differential proteomics study has iden-tified several candidate proteins that could be implicated in the molecular adaptation of neurons to chronic mor-phine treatment. In particular, changes in vesicular
traf-ficking and proteasome-dependent protein degradation are known to be critical for various forms of synaptic plas-ticity such as long term potentiation or depression [28,29]. These adaptations as well as their role in the development of drug dependence have now to be vali-dated in animal models of addiction.
Methods
Cell culture and treatment
Human SH-SY5Y neuroblastoma cells were transfected with N-terminal T7-tagged human MOP receptor in pRC-CMV using lipofectamine [11]. Stably transfected G418-resistant cells were grown in high glucose DMEM (Gibco BRL) containing 10% fetal calf serum, 50 μg/ml gentami-cine (Gibco BRL), and 400 μg/ml G418 (Gibco BRL), in 5% CO2 at 37°C. Cells in 14 cm dishes were treated by diluting morphine sulphate directly in the culture medium. The cell density was adjusted so that the cultures were nearly confluent at the end of each treatment. For 72 h treatment, medium was changed and fresh morphine was added every day. Four independent experiments were performed for each treatment time.
Table 2: Proteins whose abundance in SH-SY5Y cells is regulated after 24 h of morphine treatment
Spot # Protein Accession # (a) MW (Da) Variation (% of control) (b)
MALDI peptides % coverage MS/MS peptides (c)
1 ATP-dependent RNA helicase DDX1 Q92499 82432 54 ± 10 27 32
7 Glycerol-3-phosphate dehydrogenase,
mitochondrial P43304 80815 75 ± 7 15 22
9 Bifunctional purine biosynthesis protein P31939 65088 118 ± 11 14 30 14 Vacuolar ATP synthase subunit B, brain
isoform
P21281 56501 131 ± 13 18 54
16 RuvB-like 1 Q9Y265 50228 144 ± 32 16 66
19 4-trimethylaminobutyraldehyde dehydrogenase
WD-repeat protein 12
P49189
Q9GZL7 5380248190 145 ± 24 1512 3225
20 Alpha-enolase P06733 47038 45 ± 15 18 60
21 Alpha-enolase P06733 47038 184 ± 53 6
22 Histone acetyltransferase type B subunit 2 Q16576 47820 145 ± 65 10 30 30 Heterogeneous nuclear riboprotein F
Eucaryotic translation initiation factor 3 subunit 5
O00303 4585337654 181 ± 60 127 4232
32 Beta-succinyl CoA synthetase Q7Z503 43611 74 ± 10 15 35
33 Galactokinase P51570 42272 58 ± 9 15 43
35 Acyl-CoA hydrolase O00154 41796 166 ± 33 11 44
37 Arsenical pump-driving ATPase O43681 38793 167 ± 29 8 26
38 Serine-threonine kinase receptor associated protein
Q9Y3F4 38756 164 ± 31 14 48
41 Protein phosphatase 2A, regulatory subunit B'
Calponin-3
Q15257 Q15417
40682 36561
65 ± 8 10
7
30 30
42 Biliverdin reductase A P53004 33428 84 ± 6 12 44
44 Malate dehydrogenase, cytoplasmic P40925 36295 49 ± 25 11 32
46 Annexin A5 P08758 35806 152 ± 41 18 70
51 Endoplasmic reticulum protein ERp29 P30040 28993 76 ± 14 8 46
54 Ras-related protein Rab-7 P51149 23490 58 ± 12 13 65
aSwiss-Prot primary accession number bMean ± S.D., control refers to untreated cells.
Sample preparation for 2-DE
Following treatment, the culture medium was removed and the cells were scraped into PBS and centrifuged at 1000 × g for 10 min at 4°C. The supernatant was dis-carded and the pellet was frozen and stored at -80°C for 2 hours. Cells were then resuspended in 500 μl of lysis buffer [50 mM Tris-HCl pH 7.4, 150 mM NaCl, 10 mM EDTA, proteinase inhibitors (Complete Mini tablets, Roche) and 1% (v:v) Triton X-100 (Sigma)], and protein extraction allowed to proceed for 3 h at 4°C. The extract was centrifuged at 20,000 × g for 20 min at 4°C in order to remove cell debris and insoluble material. The superna-tant was delipidated and desalted using methanol/chloro-form precipitation by mixing with 2 ml of methanol, 500
μl of chloroform and 1.5 ml of water, and centrifuging at 20,000 × g for 5 min, at room temperature. The pellet was washed with 1.5 ml of methanol and vacuum-dried. Pro-teins were then resuspended in 400 μl of 2-DE buffer (Cel-lular and Organelle Membrane Solubilizing Reagent, Sigma), reduced for 1 h at room temperature by adding tributylphosphine to a final concentration of 5 mM, and alkylated in the dark for 1.5 h at room temperature by
adding iodoacetamide to a final concentration of 15 mM. Protein concentration was determined by using the Brad-ford assay (Biorad).
Two-dimensional gel electrophoresis
The reduced and alkylated protein samples (300 μg) were used to rehydrate 13 cm pH 3–10 NL Immobilized pH Gradient (IPG) strips (Amersham Biosciences). 1.2 μl of IPG buffer pH 3–10 NL (Amersham Biosciences) and 2 μl of 1% (w:v) orange G were added to 250 μl of sample before application to the strip. Strips were focused on the IPGphor IEF (isoelectrofocusing) Cell (Amersham Bio-sciences) for 80000 Vh. After 6 h of passive rehydration and 6 h of active rehydration (30 V), the voltage was set to 300 V for 4 h. It was then increased from 300 to 8000 V during 8 h, followed by additional hours at 8000 V (until the desired volt × hour product is reached). Focused IPG strips were equilibrated in SDS-equilibration buffer con-taining 6 M urea, 2% (w:v) SDS, 50 mM Tris-HCl (pH 8.8), 30% (v:v) glycerol and 0.01% (w/v) bromophenol blue as a tracking dye for 2 × 10 min. The equilibrated strips were loaded onto 16 × 16 cm, 1 mm thick, 12%
Table 3: Proteins whose abundance in SH-SY5Y cells is regulated after 72 h of morphine treatment
Spot # Protein Accession # (a) MW (Da) Variation (% of control) (b)
MALDI peptides % coverage MS/MS peptides (c)
4 Radixin P35241 68564 50 ± 17 4
6 no identification 48 ± 23
8 Heat shock cognate 71 kDa protein P11142 70898 172 ± 48 11 23
10 Lamin A/C P02545 74139 78 ± 15 22 30
12 T-complex protein 1, zeta subunit P40227 57893 57 ± 17 15 29
13 Dihydropyrimidinase-related Q14195 61963 57 ± 21 13 40
protein 3
17 Septin-11 Q9NVA2 49267 110 ± 3 13 37
23 Rab GDP dissociation inhibitor beta P50395 50663 179 ± 61 11 34
24 Rab GDP dissociation inhibitor beta Mitochondrial-processing peptidase beta subunit
P50395
O75439 5066355072 114 ± 6 1412 3625
25 Proliferation-associated protein 2G4 Q9UQ80 43787 54 ± 20 15 44
26 Elongation factor 1-gamma P26641 49988 89 ± 5 16 36
28 Adenylosuccinate synthetase 2 P30520 50097 73 ± 16 5
29 Elongation factor 1-gamma
tRNA-nucleotidyltransferase 1 Q96Q11P26641 4998850340 51 ± 27 119 2419
31 Ornithine aminotransferase. P04181 48535 84 ± 3 14 37
34 Septin-2 Q15019 41487 72 ± 15 12 36
39 Ubiquitin-like 1 activating enzyme
E1A Q9UBE0 38450 45 ± 14 11 35
40 Guanine nucleotide binding protein,
alpha inhibiting activity polypeptide 2 Q96C71 40493 65 ± 8 9 37
43 3-mercaptopyruvate
sulfurtransferase P25325 33047 69 ± 9 6
44 Malate dehydrogenase, cytoplasmic P40925 36295 73 ± 16 11 32
45 Alpha-soluble NSF attachment protein
P54920 33247 45 ± 12 8 45
47 Nuclear protein Hcc-1 P82979 23540 77 ± 9 9 41
48 no identification 49 ± 32
49 Guanine nucleotide binding protein beta subunit 2-like 1
P63244 35077 74 ± 9 15 69
50 Proteasome subunit alpha type 3 P25788 28302 73 ± 13 8 46
55 Proteasome subunit beta type 6 P28072 25358 143 ± 11 7 23
aSwiss-Prot primary accession number bMean ± S.D., control refers to untreated cells.
Proteome Science 2006, 4:23 http://www.proteomesci.com/content/4/1/23
polyacrylamide SDS gels. Runs were performed at 10 mA/ gel (SE600 Ruby, Amersham Biosciences) until the bromophenol blue reached the bottom of the gel. Gels were then stained overnight using Coomassie colloidal blue (1 g/l, Sigma) and destained for 1 h in 1% (v/v) acetic acid solution.
Image analysis
Gels were scanned using a GS-800 Calibrated Densitome-ter (Biorad) and analyzed using ImageMasDensitome-ter Platinum software (Amersham Biosciences). Spots were detected on quadruplicate gels and manually edited. Normalization was performed by dividing the volume (OD × surface) of each spot by the total volume of every spot on the gel to give a %volume value. Gels were then matched and each group of equivalent spots was compared. In a preliminary experiment, 4 independent control gel were compared. Pair-wise comparison of spot %volumes gave linear regressions of the type y = ax + b where a = 1.03 ± 0.06 and b = -0.0019 ± 0.0034, and a correlation coefficient of 0.95 ± 0.011. Average coefficient of variation (SD/mean × 100) for all spot %volumes was 19.8 ± 10.1. This level of repro-ducibility is indicative of a statistical power of 80 to 90% for a sample size of 4 and a 0.05 p-value [30]. Having assessed the reliability of our analyses, %volumes of spots from control gels were compared to those of spots from treated gels using a Student unpaired t test. Groups of spots showing a statistically significant difference in rela-tive volume (p < 0.05, df = 6) between control and mor-phine-treated samples were first visually controlled in order to make sure that %volume changes were not due to spot detection or matching errors. Confirmed spots were then selected for identification by mass spectrometry.
In-gel protein digestion
Spots of interest were manually excised from a represent-ative gel. The gel pieces were washed with water and destained first in 160 μl of 50% (v:v) acetronitrile (ACN) in water then in 160 μl of 50% (v:v) ACN in 0.1 M NH4HCO3, dehydrated with 80 μl ACN and dried in a vac-uum centrifuge. Gel pieces were rehydrated in a sufficient covering volume of modified trypsin solution (12.5 ng/μl in 12.5 mM NH4HCO3; Promega) and incubated over-night at 37°C. Prior to peptide extraction, 0.5 μl of the tryptic digest was spotted onto the MALDI target plate. Peptides were extracted two times at 37°C for 30 min with shaking, first using 50% 25 mM NH4HCO3 /50% ACN
and then 5% formic acid/50% ACN in water. The peptide mixture was concentrated in a vacuum centrifuge to a final volume of about 10 μl.
MALDI-TOF MS analysis
TOF MS analyses were performed on a MALDI-TOF/TOF instrument (4700 Proteomics Analyzer; Applied Biosystems, Foster City, CA). 0.5 μl of tryptic digest
super-natant was loaded onto the MALDI target plate and air dried. 0.3 μl of matrix solution (α -cyano-4-hydroxycin-namic acid; 5 mg/ml in H2O/acetonitrile/TFA, 50:50:0.1) was then added. Mass spectra were acquired in an auto-mated positive reflector mode from m/z 700 to m/z 3500. Trypsin autolytic peptides (m/z 842.51 and 2211.10) were used to internally calibrate each spectrum to a mass accu-racy within 30 ppm. Spectra were analyzed using GPS Explorer (version 3.5, Applied Biosystems) which acts as an interface between the Oracle database containing raw spectra and a local copy of the Mascot search engine (ver-sion 2.0 ; Matrix Science, London, U.K.). Peptide peaks with a signal/noise ratio greater than 10 were searched against human sequences in the Swiss-Prot database (Release 48 from September 2005 ; 194 317 entries). No missed cleavage was allowed and the data were searched using carbamidomethylation of cysteine as fixed modifi-cation whereas oxidation of methionine and N-acetyla-tion of the proteins were considered as variable modifications. A protein was considered correctly identi-fied if the Protein Score Confidence Interval calculated by the GPS Explorer Results Browser was greater than 99% (see Additional file 2).
NanoLC-ESI-Q-TOF MS/MS analysis
protein acetylation were allowed as variable modifica-tions. Identification was considered positive if the protein was identified on the bases of at least two peptides with a score greater then the significance threshold score deter-mined by the Mascot Search program (>36) (see Addi-tional file 2).
Competing interests
The author(s) declare that they have no competing inter-ests.
Authors' contributions
All authors read and approved the final manuscript.
JN carried out the proteomic studies, data analysis, and participated in drafting the manuscript.
SU carried out the mass spectrometric studies and helped to draft the manuscript.
KC participated in experiment and data analysis.
BM supervised mass spectrometric experiments.
JCM participated in the design of the study and in drafting the manuscript.
LM designed the study, supervised experiments and data analysis, and drafted the manuscript.
Additional material
Acknowledgements
This work was supported by CNRS ("Protéomique et Génie des Protéines" programme grant PGP 03/057). Financial support from the Région Midi-Pyrénées and the Génopôle Toulouse/Midi-Midi-Pyrénées to BM is also grate-fully acknowledged.
References
1. Koob GF, Le Moal M: Plasticity of reward neurocircuitry and the 'dark side' of drug addiction. Nat Neurosci 2005,
8:1442-1444.
2. Meunier JC: Opioid receptors, tolerance and dependence.
Therapie 1992, 47:495-502.
3. Nestler EJ: Molecular basis of long-term plasticity underlying addiction. Nat Rev Neurosci 2001, 2:119-128.
4. Williams JT, Christie MJ, Manzoni O: Cellular and synaptic adap-tations mediating opioid dependence. Physiol Rev 2001,
81:299-343.
5. Rhodes JS, Crabbe JC: Gene expression induced by drugs of abuse. Curr Opin Pharmacol 2005, 5:26-33.
6. Ammon S, Mayer P, Riechert U, Tischmeyer H, Hollt V: Microarray analysis of genes expressed in the frontal cortex of rats chronically treated with morphine and after naloxone pre-cipitated withdrawal. Brain Res Mol Brain Res 2003, 112:113-125. 7. McClung CA, Nestler EJ, Zachariou V: Regulation of gene expres-sion by chronic morphine and morphine withdrawal in the locus ceruleus and ventral tegmental area. J Neurosci 2005,
25:6005-6015.
8. Gygi SP, Rochon Y, Franza BR, Aebersold R: Correlation between protein and mRNA abundance in yeast. Mol Cell Biol 1999,
19:1720-1730.
9. Williams K, Wu T, Colangelo C, Nairn AC: Recent advances in neuroproteomics and potential application to studies of drug addiction. Neuropharmacology 2004, 47 Suppl 1:148-166. 10. Kazmi SM, Mishra RK: Comparative pharmacological
proper-ties and functional coupling of mu and delta opioid receptor sites in human neuroblastoma SH-SY5Y cells. Mol Pharmacol
1987, 32:109-118.
11. Mouledous L, Neasta J, Uttenweiler-Joseph S, Stella A, Matondo M, Corbani M, Monsarrat B, Meunier JC: Long-term morphine treat-ment enhances proteasome-dependent degradation of G beta in human neuroblastoma SH-SY5Y cells: correlation with onset of adenylate cyclase sensitization. Mol Pharmacol
2005, 68:467-476.
12. Kim SY, Chudapongse N, Lee SM, Levin MC, Oh JT, Park HJ, Ho IK:
Proteomic analysis of phosphotyrosyl proteins in morphine-dependent rat brains. Brain Res Mol Brain Res 2005, 133:58-70. 13. Prokai L, Zharikova AD, Stevens SM Jr.: Effect of chronic
mor-phine exposure on the synaptic plasma-membrane subpro-teome of rats: a quantitative protein profiling study based on isotope-coded affinity tags and liquid chromatography/mass spectrometry. J Mass Spectrom 2005, 40:169-175.
14. Li KW, Jimenez CR, van der Schors RC, Hornshaw MP, Schoffelmeer AN, Smit AB: Intermittent administration of morphine alters protein expression in rat nucleus accumbens. Proteomics 2006,
6:2003-2008.
15. Bierczynska-Krzysik A, Bonar E, Drabik A, Noga M, Suder P, Dylag T, Dubin A, Kotlinska J, Silberring J: Rat brain proteome in mor-phine dependence. Neurochem Int 2006, 49:401-406.
16. Kumar A, Choi KH, Renthal W, Tsankova NM, Theobald DE, Truong HT, Russo SJ, Laplant Q, Sasaki TS, Whistler KN, Neve RL, Self DW, Nestler EJ: Chromatin remodeling is a key mechanism under-lying cocaine-induced plasticity in striatum. Neuron 2005,
48:303-314.
17. Rambhia S, Mantione KJ, Stefano GB, Cadet P: Morphine modula-tion of the ubiquitin-proteasome complex is neuroprotec-tive. Med Sci Monit 2005, 11:BR386-396.
18. Robinson TE, Gorny G, Savage VR, Kolb B: Widespread but regionally specific effects of experimenter- versus self-administered morphine on dendritic spines in the nucleus accumbens, hippocampus, and neocortex of adult rats. Syn-apse 2002, 46:271-279.
19. Liao D, Lin H, Law PY, Loh HH: Mu-opioid receptors modulate the stability of dendritic spines. Proc Natl Acad Sci U S A 2005,
102:1725-1730.
20. Cheng L, Itoh K, Lemmon V: L1-mediated branching is regulated by two ezrin-radixin-moesin (ERM)-binding sites, the RSLE region and a novel juxtamembrane ERM-binding region. J Neurosci 2005, 25:395-403.
21. Threadgill R, Bobb K, Ghosh A: Regulation of dendritic growth and remodeling by Rho, Rac, and Cdc42. Neuron 1997,
19:625-634.
22. Xu NJ, Yu YX, Zhu JM, Liu H, Shen L, Zeng R, Zhang X, Pei G: Inhi-bition of SNAP-25 phosphorylation at Ser187 is involved in chronic morphine-induced down-regulation of SNARE com-plex formation. J Biol Chem 2004, 279:40601-40608.
23. Goody RS, Rak A, Alexandrov K: The structural and mechanistic basis for recycling of Rab proteins between membrane com-partments. Cell Mol Life Sci 2005, 62:1657-1670.
Additional file 1
Functional classification of proteins regulated by chronic morphine. Click here for file
[http://www.biomedcentral.com/content/supplementary/1477-5956-4-23-S1.pdf]
Additional file 2
Complete mass spectrometry data for identification. Click here for file
Publish with BioMed Central and every scientist can read your work free of charge
"BioMed Central will be the most significant development for disseminating the results of biomedical researc h in our lifetime."
Sir Paul Nurse, Cancer Research UK
Your research papers will be:
available free of charge to the entire biomedical community
peer reviewed and published immediately upon acceptance
cited in PubMed and archived on PubMed Central
yours — you keep the copyright
Submit your manuscript here:
http://www.biomedcentral.com/info/publishing_adv.asp
BioMedcentral
Proteome Science 2006, 4:23 http://www.proteomesci.com/content/4/1/23
24. Seong HA, Jung H, Choi HS, Kim KT, Ha H: Regulation of trans-forming growth factor-beta signaling and PDK1 kinase activ-ity by physical interaction between PDK1 and serine-threonine kinase receptor-associated protein. J Biol Chem
2005, 280:42897-42908.
25. Escriba PV, Garcia-Sevilla JA: Parallel modulation of receptor for activated C kinase 1 and protein kinase C-alpha and beta iso-forms in brains of morphine-treated rats. Br J Pharmacol 1999,
127:343-348.
26. McCahill A, Warwicker J, Bolger GB, Houslay MD, Yarwood SJ: The RACK1 scaffold protein: a dynamic cog in cell response mechanisms. Mol Pharmacol 2002, 62:1261-1273.
27. Ron D, Jurd R: The "ups and downs" of signaling cascades in addiction. Sci STKE 2005, 2005:re14.
28. Kennedy MJ, Ehlers MD: Organelles and trafficking machinery for postsynaptic plasticity. Annu Rev Neurosci 2006, 29:325-362. 29. Ehlers MD: Activity level controls postsynaptic composition
and signaling via the ubiquitin-proteasome system. Nat Neu-rosci 2003, 6:231-242.
30. Molloy MP, Brzezinski EE, Hang J, McDowell MT, VanBogelen RA: