R E S E A R C H A R T I C L E
Open Access
Comparison of logistic-regression based
methods for simple mediation analysis with
a dichotomous outcome variable
Judith J. M. Rijnhart
1*, Jos W. R. Twisk
1, Iris Eekhout
1,2and Martijn W. Heymans
1Abstract
Background:Logistic regression is often used for mediation analysis with a dichotomous outcome. However, previous studies showed that the indirect effect and proportion mediated are often affected by a change of scales in logistic regression models. To circumvent this, standardization has been proposed. The aim of this study was to show the relative performance of the unstandardized and standardized estimates of the indirect effect and proportion mediated based on multiple regression, structural equation modeling, and the potential outcomes framework for mediation models with a dichotomous outcome.
Methods: We compared the performance of the effect estimates yielded by the three methods using a simulation
study and two real-life data examples from an observational cohort study (n= 360).
Results:Lowest bias and highest efficiency were observed for the estimates from the potential outcomes framework and for the crude indirect effectaband the proportion mediatedab/(ab+c’) based on multiple regression and SEM. Conclusions:We advise the use of either the potential outcomes framework estimates or theabestimate of the indirect effect and theab/(ab+c’) estimate of the proportion mediated based on multiple regression and SEM when mediation analysis is based on logistic regression. Standardization of the coefficients prior to estimating the indirect effect and the proportion mediated may not increase the performance of these estimates.
Keywords:Mediation analysis, Indirect effect, Proportion mediated, Multiple regression, Structural equation modeling, Potential outcomes framework, Dichotomous outcome
Background
Epidemiologists are often interested in the relationship between an exposure and an outcome. The pathways underlying such a relationship, however, often remain unknown. These unknown pathways can be assessed using mediation analysis. Mediation analysis decomposes the total effect of an exposure on an outcome (c path) into a direct effect (c’ path in Fig. 1) and indirect effect (aandb paths in Fig.1). This makes mediation analysis especially useful for disentangling mechanisms of disease development, and for identifying important intermediate factors in establishing treatment effects [1].
In simple mediation models, as visualized in Fig.1, the indirect effect can be calculated as either the product of the a and b paths (i.e. the product-of-coefficients ap-proach), or as the difference between thec and c’paths (i.e. the difference-between-coefficients approach). In addition, a proportion mediated can be calculated using one of the following approaches: 1) divide the indirect effect ab by the sum of ab and the direct effect c’, 2) divide the indirect effect ab by the total effect c, or 3) subtract the direct effect c’ divided by the total effect c from 1 [2]. Multiple regression analysis and Structural Equation Modeling (SEM) can both be used to estimate the paths in Fig.1.
In general, when the mediator and outcome are both continuous, the product-of-coefficients and difference-between-coefficients approach for calculating the indirect effect and the three approaches for calculating the * Correspondence:[email protected]
1Department of Epidemiology and Biostatistics, Amsterdam UMC, Location
VU University Medical Center, P.O. Box 7057, 1007, MB, Amsterdam, The Netherlands
Full list of author information is available at the end of the article
proportion mediated will lead to the same results [2]. However, previous simulation studies showed that the different estimates of the indirect effect and propor-tion mediated will no longer coincide when the out-come is dichotomous and logistic regression analysis is used to estimate the paths in Fig.1[2,3].
To limit the discrepancies between the different ap-proaches for calculating the indirect effect and propor-tion mediated, several authors proposed to standardize the logistic regression coefficients. MacKinnon and Dwyer [3] proposed the use ofy-standardization, Kenny [4] pro-posed the use of full-standardization, and MacKinnon and colleagues [2] proposed the use of the standardized logistic solution. Standardization equalizes the scales of the coeffi-cients across multiple different logistic regression models to make the coefficients comparable. Another regression-based method that has been proposed for estimating the indirect effect and proportion mediated is the potential out-comes framework. This framework provides definitions of causal effects, which can be used to decompose the total ef-fect into a causal direct and indirect efef-fect without requir-ing standardization of the coefficients [5].
It remains unclear which (standardized) approach for calculating the indirect effect and proportion mediated is preferred in what situation, and when the potential outcomes framework should be preferred over multiple regression and SEM. Therefore, our aim is to show the relative performance of the unstandardized and stan-dardized estimates of the indirect effect and proportion mediated based on multiple regression, SEM, and the potential outcomes framework for models with a dichot-omous outcome and 1) a continuous mediator, and 2) a dichotomous mediator.
Methods Aim
The aim of this paper is to show the relative performance of the unstandardized and standardized estimates of the indirect effect and proportion mediated based on multiple regression, SEM, and the potential outcomes framework for models with a dichotomous outcome and 1) a continu-ous mediator, and 2) a dichotomcontinu-ous mediator.
Simulation set up
To assess the relative performance of the compared methods, we simulated data for two types of mediation models with a dichotomous outcome; 1) with a continu-ous normally distributed mediator with a mean of 0 and variance of 1, and 2) with a dichotomous mediator. For both the dichotomous mediator and the dichotomous outcome three prevalence rates were simulated: 0.10, 0.30, and 0.50. Therefore, three conditions were created with a continuous mediator and dichotomous outcome, and nine conditions with a dichotomous mediator and dichotomous outcome. The exposure was a normally distributed continuous variable with a mean of 0 and a variance of 1 in all conditions. The dichotomous medi-ator and outcome where generated directly from a logis-tic model. Furthermore, in each condition the a, b, and c’paths in the underlying population model were set to 0.6, reflecting a medium-to-large effect size [2]. The standardized effect estimates were yielded by standardiz-ing the crude effect estimates in each simulated sample.
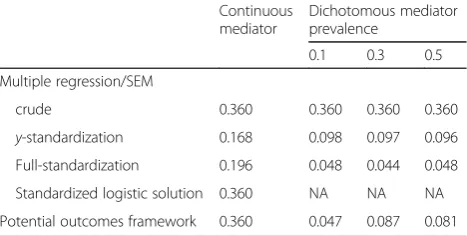
Table 1 provides an overview of the true underlying estimates of the indirect effect for each simulated condi-tion. The true values for the standardized effect esti-mates were calculated by applying the standardization equations to the true underlying crude effect estimates [2, 6]. In all conditions the true proportion mediated in multiple regression and SEM equaled 0.375. For the po-tential outcomes framework the true proportion mediated Fig. 1Path diagram of a relatively simple mediation model
Table 1True underlying indirect effect estimates for each simulated condition
Continuous mediator
Dichotomous mediator prevalence
0.1 0.3 0.5
Multiple regression/SEM
crude 0.360 0.360 0.360 0.360
y-standardization 0.168 0.098 0.097 0.096
Full-standardization 0.196 0.048 0.044 0.048
Standardized logistic solution 0.360 NA NA NA
Potential outcomes framework 0.360 0.047 0.087 0.081
was 0.375 for the condition with a continuous mediator, and 0.119, 0.127, and 0.073 for the conditions with a di-chotomous mediator with a prevalence of 0.5, 0.3, and 0.1 respectively. For each condition, 500 simulated samples of 1000 subjects were generated. All simulations were per-formed using STATA statistical software release 14 [7].
Performance measures
The performance of each method was evaluated using the (absolute) bias and Mean Squared Error (MSE). The bias is calculated as the average difference between the effect estimates in the simulated samples and the true underlying effect. A negative bias indicates that the method underestimates the true underlying effect, and a positive bias indicates that the method overestimates the true underlying effect. The MSE is calculated as the aver-age squared difference between the effect estimates in the simulated samples and the true underlying effect. The MSE represents the amount of variasbility in the effect es-timates. So the higher the MSE, the higher the variability is and thus the lower the efficiency of the method is [8].
Real-life data examples
To demonstrate the similarities and differences between the effect estimates yielded by the compared methods, two real-life data examples from a longitudinal observa-tional cohort study were used. The aim of this longitu-dinal study was to follow up the natural growth, health, and lifestyle in a representative sample of 698 Dutch adolescents [9]. In total, ten measurement rounds were performed between 1976 and 2006. Our data example was based on the measurement round in the year 2000, when the participants were in their 30s. The exposure was the sum of four skinfolds in centimeters, which is an indicator of body fatness. The outcome was carotid distensibility (CD), which is a measure of carotid artery elasticity. The association between the sum of four skin-folds and CD was thought to be mediated by heart rate. Heart rate was analyzed as both a continuous and a di-chotomous measure. Heart rate and CD were dichoto-mized by splitting them at the median. The analytical cohort consisted of 360 participants. The statistical ana-lyses were performed with STATA statistical software release 14 [7]. The STATA package ‘paramed’was used to apply the potential outcomes framework [10].
Methods for statistical mediation analysis Multiple regression and SEM
Equations1,2, and3can be used to fit simple mediation models, as shown in Fig.1, with multiple regression and SEM [11]. The difference between multiple regression and SEM is that with multiple regression separate models are fitted for each equation, whereas with SEM eqs. 2 and 3 can be fitted simultaneously in one model
[12]. When the mediator is continuous, eqs.1and 3are fitted with logistic regression and eq. 2 with linear re-gression. When the mediator is dichotomous, all equa-tions are fitted with logistic regression.
Y¼i1þcX ð1Þ
M¼i2þaX ð2Þ
Y¼i3þc0XþbM ð3Þ
Where, in eq.1, Y represents the outcome, andcX rep-resents the slope of the exposure. In eq.2, M represents the mediator, andaX represents the slope of the exposure. In eq. 3, Y represents the outcome, c′X represents the slope of the exposure, andbM represents the slope of the mediator. In all equationsirepresents the intercepts.
The discrepancies between the different estimates of the indirect effect and proportion mediated in multiple regression and SEM are caused by a change of scales of the coefficients in nested logistic models [13]. This change of scales happens when variables are added to a logistic regression model, and even happens when these variable are not related to the independent variable in the model. Because of this change of scales of the coefficients in logis-tic regression analysis after adding a potential mediator that is highly related to the outcome, the indirect effect and proportion mediated based on the crude coefficients from logistic regression might not be reliable indicators for the presence of a mediated effect. Even when there truly is mediation, the magnitude of the estimates of the indirect effect and proportion mediated will be affected by the change of scales of the coefficients.
To equalize the scales of the coefficients across logistic regression models, y-standardization, full-standardization, and the standardized logistic solution have been proposed [2–4]. Both y-standardization and full-standardization can be applied regardless of whether the mediator is continuous or dichotomous, however with a continuous mediator thea coefficient does not have to be standardized [6, 14]. The standardized logistic solution can only be applied when the mediator is continuous [2]. The three standardization methods will be discussed in more detail below.
divided by the SD of the dependent variable in that equa-tion. The SDs of the dependent variables in eqs.1,2, and 3can be derived using eqs.4,5, and6, respectively [2,6].
SD Yð Þ ¼1 pffiffiffiffiffiffiffiffiffiffiffiffiffiffiffiffiffiffiffiffiffiffiffiffiffiffiffiffiffiffiffiffiffiffiffiffic2VAR Xð Þ þπ2=3 ð4Þ
SD Mð 2Þ ¼pffiffiffiffiffiffiffiffiffiffiffiffiffiffiffiffiffiffiffiffiffiffiffiffiffiffiffiffiffiffiffiffiffiffiffiffiffia2VAR Xð Þ þπ2=3 ð5Þ
SDðY3Þ ¼
ffiffiffiffiffiffiffiffiffiffiffiffiffiffiffiffiffiffiffiffiffiffiffiffiffiffiffiffiffiffiffiffiffiffiffiffiffiffiffiffiffiffiffiffiffiffiffiffiffiffiffiffiffiffiffiffiffiffiffiffiffiffiffiffiffiffiffiffiffiffiffiffiffiffiffiffiffiffiffiffiffiffiffiffiffiffiffiffiffiffiffiffiffiffiffiffiffiffiffiffiffiffiffi
c′2V ARðXÞ þb2V ARðMÞ þ2bc′COVðXMÞ þπ2=3 q
ð6Þ
Where in Eq.4,SD(Y1) represents the SD of the out-come in eq.1,crepresents theccoefficient in eq.1, and VAR(X) represents the variance of the exposure. In eq. 5, SD(M2) represents the SD of the mediator in eq. 2, a represents the a coefficient in equation 2, and VAR(X) represents the variance of the exposure. In eq. 6, SD(Y3) represents the SD of the outcome in eq. 3, c′ represents the c’ coefficient from equation 3, VAR(X) is the variance of the exposure,brepresents theb coefficient from equation 3,VAR(M) represents the vari-ance of the mediator, andCOV(XM) represents the covari-ance between the exposure and mediator. In all equationsπ equals the number pi.
Full-standardization Full-standardization replaces both the scale of the dependent and independent variable with SDs [15]. Therefore, the SD of both the
independ-ent and dependent variable will be 1. After
full-standardization, the coefficients represent the SDs change in the dependent variable for one SD increase in the independent variable. However, it is important to note that this interpretation does not make sense when the exposure is dichotomous, for example one SD change in a treatment [15]. To perform full-standardization, the coeffi-cients from eqs.1,2, and3are multiplied by the SD of the independent variable and then divided by the SD of the dependent variable. The SDs of the independent variables can be derived in the ordinary way, and the SDs of the dependent variables can be derived using eqs.4,5, and6.
The standardized logistic solution The standardized logistic solution replaces the scale of the c coefficient with the scale of thec’coefficient using eq7. [1,2].
cstandardized¼c
ffiffiffiffiffiffiffiffiffiffiffiffiffiffiffiffiffiffiffiffiffiffi
1þb
2σ2 MX π2=3 s
ð7Þ
Wherecstandardizedis the standardizedccoefficient,cis
the c coefficient from eq. 1, b is the b coefficient from eq.3, σ2
MX is the residual variance from eq.2, and π 2
/3 is the error variance of the standard logistic distribution with π representing the number pi. Because in logistic
regression no residual variance is being estimated, the standardized logistic solution can only be applied when the mediator is continuous.
Potential outcomes framework
The potential outcomes framework provides definitions of the mediated effect that can be used to decompose the total effect of an exposure on an outcome into causal direct and indirect effects [5]. The potential out-comes framework therefore explicitly assumes that there are no unobserved confounders of the relation-ships in the mediation model. There are several ways in which the potential outcomes framework can be used to estimate direct and indirect effects [16–18]. In this paper we focus on the logistic-regression based method as described by VanderWeele and Vansteelandt [18]. Under the assumption of no unobserved confounders, no exposure-mediator interaction, and a low outcome prevalence (i.e. 10% or lower), the indirect effect for mediation models with a dichotomous outcome is de-fined as the product of the a and b coefficients from eqs. 2 and 3 [19]. Furthermore, in this situation, the direct effect equals the c’coefficient from eq. 3. Under
the no unobserved confounders and no
exposure-mediator interaction assumptions, the indir-ect and dirindir-ect effindir-ect odds ratios for mediation models with a dichotomous mediator and outcome can be cal-culated using eqs.8and9[19].
Indirect effect OR¼ðð1þexpði2ÞÞð1þexpðbþi2þaÞÞ
1þexpði2þaÞÞð1þexpðbþi2ÞÞ ð8Þ
Direct effect OR¼ expð Þc0 ð9Þ
Wherei2represents the intercept from eq.2,brepresents
thebcoefficient from eq.3,arepresents theacoefficient in eq.2, andc′represents thec’coefficient from eq.3.
The total effect is defined as either the product of the direct and indirect effect when the effect estimates are on the odds ratio scale, or as the summation of the dir-ect and indirdir-ect effdir-ect when the effdir-ect estimates are on the log odds ratio scale [19].
Results
Simulation study
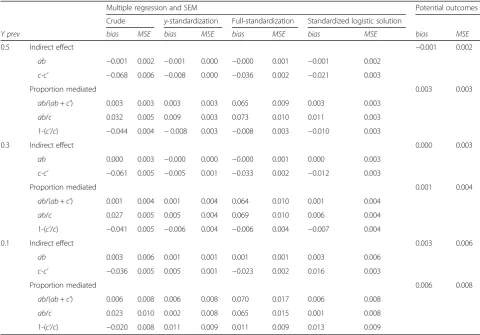
Continuous mediator
When the mediator was continuous (Table 2), the esti-mates based on the potential outcomes framework and the crude indirect effect ab and proportion mediated
ab/(ab + c’)based on multiple regression and SEM
gen-erally had the lowest bias and highest efficiency. All standardization methods decreased bias and increased efficiency of the c-c’ estimate compared to the crude c-c’ estimate based on multiple regression and SEM. Y-standardization and the standardized logistic solution both decreased bias and increased efficiency of theab/c and 1-(c’/c) estimates compared to the crude ab/c and 1-(c’/c) estimates based on multiple regression and SEM. However, full-standardization was not able to decrease bias and increase efficiency in the proportion mediated es-timates based on multiple regression and SEM. These re-sults were observed across all three outcome prevalences.
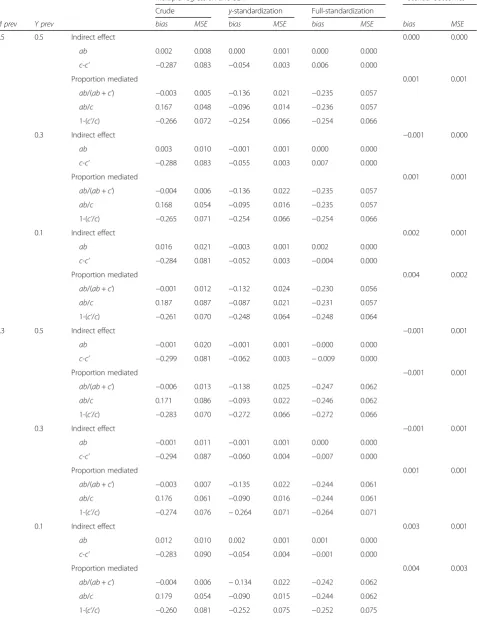
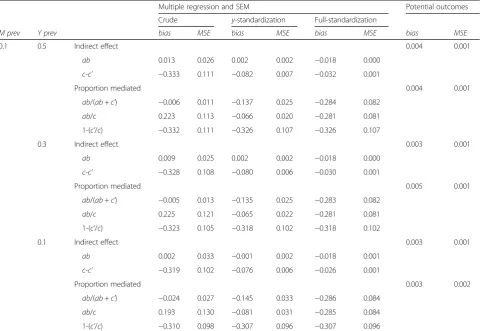
Dichotomous mediator
When the mediator is dichotomous (Table 3), the esti-mates based on the potential outcomes framework and the crude indirect effect ab and proportion mediated
ab/(ab + c’) based on multiple regression and SEM are
both unbiased with respect to their own true values. The standardization methods did decrease bias and increase efficiency in thec-c’estimate, but the performance of the standardized proportion mediated estimates was worse than the performance of the crude proportion mediated estimates based on multiple regression and SEM. Even though the estimates based on the potential outcomes framework and the crude indirect effect ab and propor-tion mediated ab/(ab + c’) based on multiple regression and SEM are unbiased and efficient with respect to their own true values, differences were observed between the effect estimates based on the potential outcomes frame-work and multiple regression and SEM.
Real-life data examples
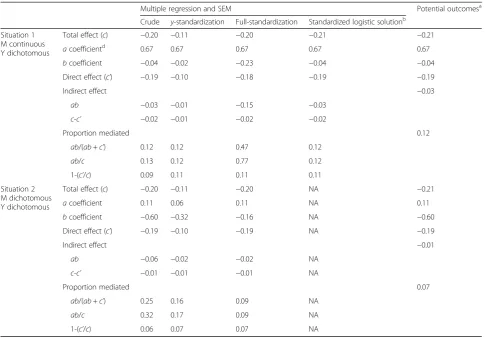
Table4shows the results yielded for the real-life data ex-amples. As in the simulation study, multiple regression and SEM yielded exactly the same results. When the mediator was continuous, the estimates of the indirect effect (−0.03) and proportion mediated (0.12) in the potential outcomes framework equaled the crude indirect effect ab and the proportion mediated ab/(ab + c’) in multiple regression and SEM. The indirect effect of −0.03 corresponds to an
Table 2Bias and efficiency yielded by the three compared methods for models with a continuous mediator
Multiple regression and SEM Potential outcomes
Crude y-standardization Full-standardization Standardized logistic solution
Y prev bias MSE bias MSE bias MSE bias MSE bias MSE
0.5 Indirect effect −0.001 0.002
ab −0.001 0.002 −0.001 0.000 −0.000 0.001 −0.001 0.002
c-c’ −0.068 0.006 −0.008 0.000 −0.036 0.002 −0.021 0.003
Proportion mediated 0.003 0.003
ab/(ab+c’) 0.003 0.003 0.003 0.003 0.065 0.009 0.003 0.003
ab/c 0.032 0.005 0.009 0.003 0.073 0.010 0.011 0.003
1-(c’/c) −0.044 0.004 −0.008 0.003 −0.008 0.003 −0.010 0.003
0.3 Indirect effect 0.000 0.003
ab 0.000 0.003 −0.000 0.000 −0.000 0.001 0.000 0.003
c-c’ −0.061 0.005 −0.005 0.001 −0.033 0.002 −0.012 0.003
Proportion mediated 0.001 0.004
ab/(ab+c’) 0.001 0.004 0.001 0.004 0.064 0.010 0.001 0.004
ab/c 0.027 0.005 0.005 0.004 0.069 0.010 0.006 0.004
1-(c’/c) −0.041 0.005 −0.006 0.004 −0.006 0.004 −0.007 0.004
0.1 Indirect effect 0.003 0.006
ab 0.003 0.006 0.001 0.001 0.001 0.001 0.003 0.006
c-c’ −0.036 0.005 0.005 0.001 −0.023 0.002 0.016 0.003
Proportion mediated 0.006 0.008
ab/(ab+c’) 0.006 0.008 0.006 0.008 0.070 0.017 0.006 0.008
ab/c 0.023 0.010 0.002 0.008 0.065 0.015 0.001 0.008
1-(c’/c) −0.020 0.008 0.011 0.009 0.011 0.009 0.013 0.009
Table 3Bias and efficiency yielded by the three compared methods for models with a dichotomous mediator
Multiple regression and SEM Potential outcomes
Crude y-standardization Full-standardization
M prev Y prev bias MSE bias MSE bias MSE bias MSE
0.5 0.5 Indirect effect 0.000 0.000
ab 0.002 0.008 0.000 0.001 0.000 0.000
c-c’ −0.287 0.083 −0.054 0.003 0.006 0.000
Proportion mediated 0.001 0.001
ab/(ab+c’) −0.003 0.005 −0.136 0.021 −0.235 0.057
ab/c 0.167 0.048 −0.096 0.014 −0.236 0.057
1-(c’/c) −0.266 0.072 −0.254 0.066 −0.254 0.066
0.3 Indirect effect −0.001 0.000
ab 0.003 0.010 −0.001 0.001 0.000 0.000
c-c’ −0.288 0.083 −0.055 0.003 0.007 0.000
Proportion mediated 0.001 0.001
ab/(ab+c’) −0.004 0.006 −0.136 0.022 −0.235 0.057
ab/c 0.168 0.054 −0.095 0.016 −0.235 0.057
1-(c’/c) −0.265 0.071 −0.254 0.066 −0.254 0.066
0.1 Indirect effect 0.002 0.001
ab 0.016 0.021 −0.003 0.001 0.002 0.000
c-c’ −0.284 0.081 −0.052 0.003 −0.004 0.000
Proportion mediated 0.004 0.002
ab/(ab+c’) −0.001 0.012 −0.132 0.024 −0.230 0.056
ab/c 0.187 0.087 −0.087 0.021 −0.231 0.057
1-(c’/c) −0.261 0.070 −0.248 0.064 −0.248 0.064
0.3 0.5 Indirect effect −0.001 0.001
ab −0.001 0.020 −0.001 0.001 −0.000 0.000
c-c’ −0.299 0.081 −0.062 0.003 −0.009 0.000
Proportion mediated −0.001 0.001
ab/(ab+c’) −0.006 0.013 −0.138 0.025 −0.247 0.062
ab/c 0.171 0.086 −0.093 0.022 −0.246 0.062
1-(c’/c) −0.283 0.070 −0.272 0.066 −0.272 0.066
0.3 Indirect effect −0.001 0.001
ab −0.001 0.011 −0.001 0.001 0.000 0.000
c-c’ −0.294 0.087 −0.060 0.004 −0.007 0.000
Proportion mediated 0.001 0.001
ab/(ab+c’) −0.003 0.007 −0.135 0.022 −0.244 0.061
ab/c 0.176 0.061 −0.090 0.016 −0.244 0.061
1-(c’/c) −0.274 0.076 −0.264 0.071 −0.264 0.071
0.1 Indirect effect 0.003 0.001
ab 0.012 0.010 0.002 0.001 0.001 0.000
c-c’ −0.283 0.090 −0.054 0.004 −0.001 0.000
Proportion mediated 0.004 0.003
ab/(ab+c’) −0.004 0.006 −0.134 0.022 −0.242 0.062
ab/c 0.179 0.054 −0.090 0.015 −0.244 0.062
odds ratio of 0.97, which indicates that for one unit increase in the sum of four skinfolds the odds of being in the high CD group decreases by a factor of 0.97 via an increase in average heart rate. This indirect effect explained 12% of the total effect of sum of four skinfolds on CD.
When the mediator was dichotomous, the crude ab and ab/(ab +c’) estimates based on multiple regression and SEM were−0.06 and 0.25 respectively. This indirect effect estimate corresponds to an odds ratio of 0.94, in-dicating that for one unit increase in the sum of four skinfolds the odds of being in the high CD group de-creases by a factor of 0.94 via an increased odds of being in the high average heart rate group. This indirect effect explained 25% of the total effect of sum of four skinfolds on CD. The indirect effect and proportion mediated based on the potential outcomes framework were−0.01 and 0.07 respectively. This indirect effect estimate corre-sponds to an odds ratio of 0.99, indicating that for one unit increase in the sum of four skinfolds the odds of be-ing in the high CD group decreases by a factor of 0.99 via an increased odds of being in the high average heart rate group. This indirect effect explained 7% of the total effect of sum of four skinfolds on CD.
Discussion
The aim of this paper was to show the relative perform-ance of different methods to estimate the indirect effect and proportion mediated for mediation models with a dichotomous outcome. The effect estimates based on the potential outcomes framework and the crude indir-ect effindir-ect estimate ab and the crude proportion medi-atedab/(ab+c’) based on multiple regression and SEM perform well in all situations. When the mediator was continuous, the effect estimates in the potential out-comes framework and in multiple regression/SEM coin-cided, but this was not the case when the mediator was dichotomous. Standardization of the coefficients from multiple regression/SEM prior to estimating the indirect effect and the proportion mediated does generally not increase the performance of these estimates.
For both models with a continuous or a dichotomous mediator and across all prevalence rates of the mediator and outcome, the crude indirect effect estimate c-c’and the crude estimates of the proportion mediatedab/cand 1-(c’/c) performed worse than the crude ab and ab/ (ab + c’) estimates. We found that, compared to the crude estimates, standardization only decreased bias and Table 3Bias and efficiency yielded by the three compared methods for models with a dichotomous mediator(Continued)
Multiple regression and SEM Potential outcomes
Crude y-standardization Full-standardization
M prev Y prev bias MSE bias MSE bias MSE bias MSE
0.1 0.5 Indirect effect 0.004 0.001
ab 0.013 0.026 0.002 0.002 −0.018 0.000
c-c’ −0.333 0.111 −0.082 0.007 −0.032 0.001
Proportion mediated 0.004 0.001
ab/(ab+c’) −0.006 0.011 −0.137 0.025 −0.284 0.082
ab/c 0.223 0.113 −0.066 0.020 −0.281 0.081
1-(c’/c) −0.332 0.111 −0.326 0.107 −0.326 0.107
0.3 Indirect effect 0.003 0.001
ab 0.009 0.025 0.002 0.002 −0.018 0.000
c-c’ −0.328 0.108 −0.080 0.006 −0.030 0.001
Proportion mediated 0.005 0.001
ab/(ab+c’) −0.005 0.013 −0.135 0.025 −0.283 0.082
ab/c 0.225 0.121 −0.065 0.022 −0.281 0.081
1-(c’/c) −0.323 0.105 −0.318 0.102 −0.318 0.102
0.1 Indirect effect 0.003 0.001
ab 0.002 0.033 −0.001 0.002 −0.018 0.001
c-c’ −0.319 0.102 −0.076 0.006 −0.026 0.001
Proportion mediated 0.003 0.002
ab/(ab+c’) −0.024 0.027 −0.145 0.033 −0.286 0.084
ab/c 0.193 0.130 −0.081 0.031 −0.285 0.084
1-(c’/c) −0.310 0.098 −0.307 0.096 −0.307 0.096
increased efficiency in thec-c’estimate of the indirect ef-fect and theab/cand 1-(c’/c) estimates of the proportion mediated. In line with our findings, previous studies only advised standardization of the coefficients when calculat-ing the indirect effect as c-c’and the proportion medi-ated as ab/c or 1-(c’/c) [2–4]. This is advice is relevant when the indirect effect is phrased in terms of a differ-ence in coefficients [2]. Furthermore, when the mediator was dichotomous, the standardized estimates of the pro-portion mediated performed worse than the crude esti-mates in terms of bias and efficiency. Furthermore, it is important to note that both y-standardization and full-standardization may hamper a clinically meaningful interpretation of the indirect effect [15].
That multiple regression and SEM yielded exactly the same estimates of the indirect effect and proportion medi-ated can be explained by their mathematical equivalence [20]. Furthermore, when the mediator is continuous and in the absence of exposure-mediator interaction, the formulas for calculating the indirect effect and proportion mediated
in the potential outcomes framework are mathematically equivalent to theabandab/(ab+c’) estimates in multiple regression and SEM [18]. However, when the mediator is dichotomous, there is a discrepancy between the indirect effect estimate in the potential outcomes framework and in multiple regression and SEM. This discrepancy is caused by the differences in the formulas of the indirect effect used by the two methods when the mediator is dichotom-ous [21]. Further research is needed to assess why and when these two formulas lead to different indirect effect estimates.
Change of scales in logistic models
The systematic underestimation of the c-c’ estimate of the indirect effect can be explained by the change of scales of the coefficients in nested logistic models. The scale of the coefficients in logistic models is dependent on the total variance of the dependent variable [3]. The total variance in a variable is a combination of explained and unexplained variance. When a particular variable is
Table 4Application of the three compared methods to the real-life data examples
Multiple regression and SEM Potential outcomesa
Crude y-standardization Full-standardization Standardized logistic solutionb
Situation 1 M continuous Y dichotomous
Total effect (c) −0.20 −0.11 −0.20 −0.21 −0.21
acoefficientd 0.67 0.67 0.67 0.67 0.67
bcoefficient −0.04 −0.02 −0.23 −0.04 −0.04
Direct effect (c’) −0.19 −0.10 −0.18 −0.19 −0.19
Indirect effect −0.03
ab −0.03 −0.01 −0.15 −0.03
c-c’ −0.02 −0.01 −0.02 −0.02
Proportion mediated 0.12
ab/(ab+c’) 0.12 0.12 0.47 0.12
ab/c 0.13 0.12 0.77 0.12
1-(c’/c) 0.09 0.11 0.11 0.11
Situation 2 M dichotomous Y dichotomous
Total effect (c) −0.20 −0.11 −0.20 NA −0.21
acoefficient 0.11 0.06 0.11 NA 0.11
bcoefficient −0.60 −0.32 −0.16 NA −0.60
Direct effect (c’) −0.19 −0.10 −0.19 NA −0.19
Indirect effect −0.01
ab −0.06 −0.02 −0.02 NA
c-c’ −0.01 −0.01 −0.01 NA
Proportion mediated 0.07
ab/(ab+c’) 0.25 0.16 0.09 NA
ab/c 0.32 0.17 0.09 NA
1-(c’/c) 0.06 0.07 0.07 NA
Abbreviations: SEMstructural equation modeling,Mmediator variable,Youtcome variable,NAnot available
a
The output of the potential outcomes framework contains odds ratios, the coefficients in the table are log transformed to make the coefficients comparable to the coefficients yielded by multiple regression and SEM
b
The standardized logistic solution cannot be applied to mediation models with a dichotomous mediator variable
d
added to a linear regression model, the unexplained ance decreases with the same amount as the explained vari-ance increases. However, in a logistic regression model a standard logistic distribution is assumed, in which the un-explained variance is fixed at 3.29 [22]. So, the total amount of variance in the dependent variable must increase when an added variable explains some of the variance in the dependent variable. Consequently, also the scale of the coefficients in the model will increase.
The change of scales becomes a problem when medi-ation is investigated. Suppose we add a potential mediator, that is highly related to the outcome, to a logistic regres-sion model with an exposure variable. The strong relation-ship between the mediator and outcome variable will force the total amount of variance in the outcome variable to increase. To deal with this increased total variance, the scale of the coefficients in the model will increase as well. This increase in the coefficient for the exposure variable would also happen when there is no mediation at all, i.e. when the relationship between the exposure and mediator variable is equal to zero. In that case the increase in the coefficient for the exposure variable would be completely attributable to the increase in the total amount of variance in the outcome variable and not to mediation [23].
When there truly is mediation, the change of scales in logistic models will bias the c-c’ estimate of the indirect effect. Because the mediator explains at least a part of the total effect of the exposure on the outcome, the direct effect (c’coefficient) is expected to be lower than the total effect (ccoefficient). However, at the same time the mag-nitude of the coefficient for the direct effect will increase because of the addition of the mediator to the model. Consequently, thec-c’estimate will be a systematic under-estimation of the true (positive) indirect effect. Previous simulation studies showed that the magnitude of this underestimation depends on both the strength of the rela-tionship between the mediator and outcome, and on the sample size [2, 3]. Furthermore, it is important to note that even when the true mediated effect equals zero, the indirect effect based onc-c’will likely be nonzero and thus a misleading estimate of the true indirect effect.
Significance testing
Often researchers are interested in using statistical tests to test for the presence of a mediated effect. Further-more, it has been suggested that when the outcome prevalence is higher than 10%, the indirect effect esti-mates can only be used to test for the presence of a me-diated effect instead of interpreting the indirect effect estimate itself [21]. It should, however, be noted that the statistical significance of an indirect effect does not say anything about its clinical relevance [24]. The clinical relevance of an indirect effect can only be assessed through its magnitude. Unfortunately, the magnitude of the indirect
effect based on logistic models will often be affected by unobserved heterogeneity. To avoid the problem of unob-served heterogeneity in the interpretation of the indirect effect, the use of alternative models has been proposed, such as linear probability models, average marginal effects models, and log-linear models [19,22]. Further research is needed to assess the usefulness of these models for medi-ation analysis with a dichotomous outcome.
Strengths and limitations
To our knowledge this is the first paper extensively com-paring unstandardized and standardized estimates of the indirect effect and proportion mediated based on multiple regression, SEM, and the potential outcomes framework for models with a dichotomous outcome. In our simula-tion study we assessed multiple condisimula-tions based on the prevalence of the mediator and outcome, as the potential outcomes framework assumes the outcome to be rare. Our study showed that the bias and efficiency of the esti-mates of the indirect effect and proportion mediated across all prevalence rates are low. However, it is import-ant to note that the odds ratios from the potential out-comes framework won’t approximate risk ratios for high prevalence rates, i.e. 10% to 50% [18].
For the sake of simplicity, we did not include con-founders in the simulated models. However, we believe that the results in this paper also apply for models that do in-clude confounders. In practice it is important to consider potential confounders of all relationships in the mediation model. In all three methods compared in this paper, the es-timates of the indirect effect and proportion mediated can be adjusted for confounding by adding the potential con-founders to all fitted regression equations [25–27].
Conclusions
In general, standardization of the coefficients prior to esti-mating the indirect effect and the proportion mediated may not increase the performance of these estimates. We there-fore recommend to either use the estimates based on the potential outcomes framework or the crude ab estimate andab/(ab+c’) estimate of the indirect effect and propor-tion mediated, respectively, based on multiple regression and SEM. For models with a continuous mediator, these estimates from multiple regression and SEM coincide with the estimates from the potential outcomes framework. When the mediator is dichotomous, the estimates based on the potential outcomes framework deviate from the esti-mates based on multiple regression and SEM. Further re-search is needed to assess why and when these methods lead to different effect estimates.
Abbreviations
Acknowledgements
We want to thank the board and participants of the Amsterdam Growth and Health Longitudinal Study for providing us their data, and allowing us to use their data for the real-life data examples in this study.
Funding
This work was supported by the department of Epidemiology and Biostatistics of the Amsterdam UMC, location VU University Medical Center. The funding body had no influence on the study design, analysis and interpretation of the data, or the writing of the manuscript.
Availability of data and materials
The datasets generated and analyzed during the current study are available from the corresponding author on reasonable request.
Authors’contributions
JR, JT, and MH conceived and designed the study idea. JT was responsible for the data acquisition. JR and IE analyzed and interpreted the data. JT and MH provided comments and consultation on the analyses and interpreted the data. JR wrote the first draft of the manuscript. All authors contributed to the writing of the manuscript, read and approved the final manuscript. JT and MH supervised the study.
Ethics approval and consent to participate
The study protocol of the Amsterdam Growth and Health Longitudinal Study was approved by the Medical Ethics Committee of the VU University Medical Center Amsterdam, and written informed consent was obtained from all participants.
Consent for publication
Not applicable.
Competing interests
Martijn W. Heymans is a member of the editorial board of BMC Medical Research Methodology. The authors declare that they have no competing interests.
Publisher’s Note
Springer Nature remains neutral with regard to jurisdictional claims in published maps and institutional affiliations.
Author details 1
Department of Epidemiology and Biostatistics, Amsterdam UMC, Location VU University Medical Center, P.O. Box 7057, 1007, MB, Amsterdam, The Netherlands.2Department of Child Health, Netherlands Organization for Applied Scientific Research TNO, Schipholweg 77, 2316, ZL, Leiden, The Netherlands.
Received: 23 February 2018 Accepted: 27 December 2018
References
1. MacKinnon DP. Introduction to statistical mediation analysis. New York: Routledge; 2008.
2. MacKinnon DP, Lockwood CM, Brown CH, Wang W, Hoffman JM. The intermediate endpoint effect in logistic and probit regression. Clinical Trials. 2007;4(5):499–513.
3. MacKinnon D, Dwyer J. Estimating mediated effects in prevention studies. Eval Rev. 1993;17(2):144–58.
4. Kenny DA. Mediation with dichotomous outcomes. Research Note, University of Connecticut; 2008.
5. Pearl J. Direct and indirect effects. In: Proceedings of the seventeenth conference on uncertainty in artificial intelligence. San Francisco: Morgan Kaufmann publishers Inc., 2001; 2001. p. 411–420.
6. Winship C, Mare RD. Regression models with ordinal variables. Am Sociol Rev. 1984:512–25.
7. StataCorp: Stata statistical software: release 14. Edited by station C. Thousand Oaks: StataCorp LP; 2015.
8. Carsey TM, Harden JJ. Monte Carlo simulation and resampling methods for social science: Sage Publications; 2013.
9. Wijnstok NJ, Hoekstra T, van Mechelen W, Kemper HC, Twisk JW. Cohort profile: the Amsterdam growth and health longitudinal study. Int J Epidemiol. 2013;42(2):422–9.
10. Emsley R, Liu H. PARAMED: Stata module to perform causal mediation analysis using parametric regression models. Statistical software components. Boston: Boston College Department of Economics; 2013. 11. Judd CM, Kenny DA. Process analysis estimating mediation in treatment
evaluations. Eval Rev. 1981;5(5):602–19.
12. Baron RM, Kenny DA. The moderator–mediator variable distinction in social psychological research: conceptual, strategic, and statistical considerations. J Pers Soc Psychol. 1986;51(6):1173.
13. Greenland S, Robins JM. Identifiability, exchangeability, and epidemiological confounding. Int J Epidemiol. 1986;15(3):413–9.
14. McKelvey RD, Zavoina W. A statistical model for the analysis of ordinal level dependent variables. J Math Sociol. 1975;4(1):103–20.
15. Long JS. Regression models for categorical and limited dependent variables. Thousand Oaks: Sage Publications; 1997.
16. Imai K, Keele L, Tingley D. A general approach to causal mediation analysis. Psychol Methods. 2010;15(4):309–34.
17. Muthén BO, Muthén LK, Asparouhov T. Regression and mediation analysis using Mplus. Los Angeles: Muthén & Muthén; 2017.
18. VanderWeele TJ, Vansteelandt S. Odds ratios for mediation analysis for a dichotomous outcome. Am J Epidemiol. 2010;172(12):1339–48.
19. Valeri L, VanderWeele TJ. Mediation analysis allowing for exposure–mediator interactions and causal interpretation: theoretical assumptions and
implementation with SAS and SPSS macros. Psychol Methods. 2013;18(2):137. 20. Iacobucci D, Saldanha N, Deng X. A meditation on mediation: evidence that
structural equations models perform better than regressions. J Consum Psychol. 2007;17(2):139–53.
21. VanderWeele TJ. Explanation in causal inference: methods for mediation and interaction. New York: Oxford University Press; 2015.
22. Mood C. Logistic regression: why we cannot do what we think we can do, and what we can do about it. Eur Sociol Rev. 2010;26(1):67–82.
23. Mare RD. Response: statistical models of educational stratification—Hauser and Andrew's models for school transitions. Sociol Methodol. 2006;36(1):27–37. 24. Gardner MJ, Altman DG. Confidence intervals rather than P values:
estimation rather than hypothesis testing. BMJ. 1986;292(6522):746–50. 25. Hayes AF. Introduction to mediation, moderation, and conditional process
analysis: a regression-based approach. New York: Guilford Press; 2018. 26. Imai K, Keele L, Tingley D, Yamamoto T. Unpacking the black box of causality:
learning about causal mechanisms from experimental and observational studies. American Political Science Review. 2011;105(04):765–89.