R E S E A R C H
Open Access
Selected parameters of the corneal deformation
in the Corvis tonometer
Robert Koprowski
1*, Anita Lyssek-Boron
2, Anna Nowinska
2, Edward Wylegala
2, Henryk Kasprzak
3and Zygmunt Wrobel
1* Correspondence:robert. [email protected] 1Department of Biomedical
Computer Systems, University of Silesia, Faculty of Computer Science and Materials Science, Institute of Computer Science, ul. Będzińska 39, Sosnowiec 41-200, Poland Full list of author information is available at the end of the article
Abstract
Introduction:Contemporary ophthalmology knows many methods of measuring
intraocular pressure, namely the methods of non-contact and impression applanation tonometry. In non-contact applanation tonometers, e.g. the Corvis, the corneal flattening is caused by an air puff. Image registration of the corneal deflection performed by a tonometer enables to determine other interesting biomechanical parameters of the eye, which are not available in the tonometer. The measurement of new selected parameters is presented in this paper.
Material and method:Images with anM×N×Iresolution of 200 × 576 × 140 pixels were acquired from the Corvis device in the source recording format *.cst. A total of 13'400 2D images of patients examined routinely in the Clinical Department of Ophthalmology, in District Railway Hospital in Katowice, Poland, were analysed in accordance with the Declaration of Helsinki. A new method has been proposed for the analysis of corneal deflection images in the Corvis tonometer with the use of the Canny edge detection method, mathematical morphology methods and context-free operations.
Results:The resulting image analysis tool allows determination of the response of the cornea and the entire eyeball to an air puff. The paper presents the method that enables the measurement of the amplitude of curvature changes in the frequency range from 150 to 500 Hz and automatic designation of the eyeball movement direction. The analysis of these data resulted in 3 new features of dynamics of the eye reaction to an air puff. Classification of these features enabled to propose 4 classes of deformation. The proposed algorithm allows to obtain reproducible results fully automatically at a time of 5 s per patient using the Core i5 CPU M460 @ 2.5GHz 4GB of RAM.
Conclusions:The paper presents the possibility of using a profiled algorithm of image analysis, proposed by the authors, to measure additional cornea deformation
parameters. The new tool enables automatic measurement of the additional new parameters when using the Corvis tonometer. A detailed clinical examination based on this method will be presented in subsequent papers.
Keywords:Eye biomechanics, Corvis tonometer, Image processing, Measurement
Automation, Segmentation
Introduction
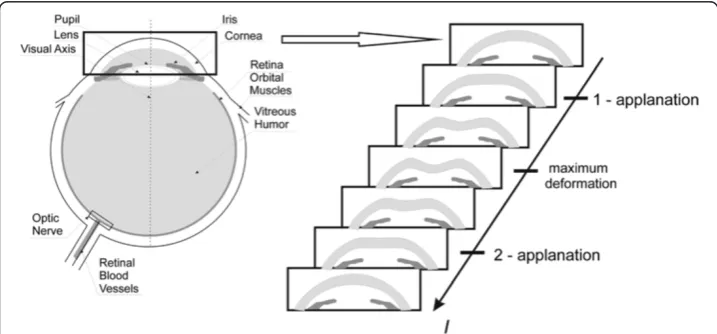
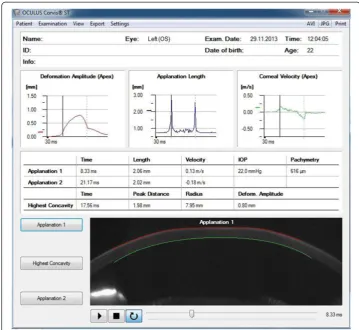
Contemporary ophthalmology knows many methods of measuring intraocular pressure. These include non-contact and impression applanation tonometry. They are based on the Imbert-Fick law. Knowing the physical strength necessary to flatten a sphere and the surface of the flattening, it is possible to determine the pressure inside the sphere. Non-contact applanation tonometers, e.g. the Corvis, use this rule. In this tonometer, the flattening of the cornea is caused by an air puff - Figure 1. The device measures the cornea thickness, deflection amplitude, applanation length, corneal deflection speed, intra-ocular pressure. In addition, the information about places of applanation, pachymetry and other data are provided - Figure 2. The locations of applanation (temporary cornea flat-tening during a convex-concave transition and vice versa) enable to determine two appla-nation timest1andt2. In Ocular Response Analyzer (ORA) the air pressure valuesP1and
P2are read in applanation timest1andt2, and then the value (P1+P2)/2 is calculated. This
value after linear calibration is the value of the intraocular pressure IOP. The Corvis ton-ometer also records sequence of images of the corneal deflection (resulting from the air puff). The sequence of images enables to get much more information using the methods of image analysis and processing. Such analysis allows to obtain three-dimensional recon-struction of corneal deflection in one of time ranges. On this basis, it is possible to deter-mine the locations of applanation, the corneal deformation rate or the entire eyeball response to the air puff.
Analysis of images from the Corvis tonometer in the original software is based on designation of the outer and inner edges of the cornea profile. The edge detection methods of Roberts, Sobel and Prewitt can be all applied here. The Canny filter or local thresholding dependent on local brightness changes can be also used with equally good results. Additionally, the visible cross-sections of the iris which are often the brightest visible area are problematic here. All these methods based on a typical standard ap-proach, enable to detect the corneal deformation in only one selected place (usually the main axis of fixation). From a biomechanical point of view, other locations of the
corneal deformation or determination of the eyeball reaction to the air puff are also of interest. These parameters are not adequately described in the known publications in terms of both image analysis and processing as well as biomechanics.
The papers published so far are related to the analysis of corneal biomechanical pa-rameters for the data derived mainly from the ORA device [1,2]. In [1], measurements of several populations indicate that corneal hysteresis, a biomechanical measure, varied over a dynamic range of 1.8 to 14.6 mmHg and was only weakly correlated with corneal thickness (r2= 0.12). This is related to the observation that some subjects with relatively thick corneas have less-than-average corneal hysteresis. For the cornea itself, the effect of the patient's age [3-6], glaucoma [7] or wound healing [8] on its biomechanical pa-rameters is also considered. Predictive numerical simulation of corneal biomechanical parameters was considered in an equally interesting way in [9]. In this paper, twenty-four corneal buttons were tested under posterior inflation conditions while monitoring their behaviour using non-contact methods. The measurement methods of the ultra-structure of the corneal stroma were presented in [10]. There are also very interesting studies profiled to the cornea analysis of Brazilian patients [11] or children with the use of the ORA tonometer [12,13]. A group of authors in [14] presented a correlation
between hysteresis generated in a tonometer and pachymetry. By contrast, in [15] the same hysteresis as in [16] was presented in correlation with the glaucoma damage. The paper [17] deals with these issues (hysteresis), but in the Reichert ORA device. There exists also a well-known group of papers concerning the analysis of biomechanical pa-rameters of the cornea in keratoconic eyes [18] or LASIK [19]. Moreover, there are de-scriptions of other tests of the cornea which contribute to the understanding of the biomechanical properties such as the comparison of the corneal strip extensometry presented in [20].
Last year has appeared series of papers dealing with application of Corvis noncontact tonometer to examine both IOP value as well as biomechanical parameters of the cor-nea, related to the corneal deformation [21-24]. However, Corvis tonometer gives more possibilities of corneal measurements after application of additional algorithms and procedures of data processing.
Therefore, there is a need to propose a dedicated automatic algorithm enabling mea-surements performed at out of axis places of the corneal deformation or determination of the eyeball response to an air puff during pressure measurement. The proposed dedi-cated algorithm and the results obtained from its use are discussed in detail later in the paper.
Material
Images with an M×N×I resolution of 200 × 576 × 140 pixels were acquired from the Corvis device in the source recording format *.cst (they can be converted to a sequence of images *.bmp, *.jpg or a film *.avi). The patients ranging from 17 to 63 years of age were healthy (32 people including 16 women) and ill (16 people including 9 women). The group of ill patients suffered from either AMD or other diseases that cause abnormal pressure in the eye. A total of 96 eyes were examined and for each one a sequence of 140 images was obtained - which accounted for 13'400 2D images for analysis. The patients were examined during tests performed routinely in the Clinical Research Department of Ophthalmology, in District Railway Hospital in Katowice, Poland, in accordance with the Declaration of Helsinki. All the patient data have been anonymised.
Method
Pre-processing
Pre-processing of input imagesLGRAY(m,n,i), wherem-rowm∈(1,M),n-columnn∈(1,N),i
The first oneinvolves analysis of brightness for each column of the imageLM(m,n =
const,i = const). Each column is subjected to binarization operation with a threshold set automatically according to the Otsu formula [25], i.e.:
LBðm;n;iÞ ¼ 10 otherif LMðm;n;iÞ>ðvr∙prðn;iÞÞ
ð1Þ
where: pr(n,i) - binarization threshold set automatically according to the Otsu formula
form∈(1,M),
vr- automatic correction factor chosen arbitrarily at 0.5.
According to formula (1) binarization threshold is determined on the basis of two values: pr(n,i) which is the binarization threshold according to the Otsu andvr which was chosen arbitrarily. Factorvris the correction factor resulting from the image speci-ficity LM(m,n,i). There is a necessity of the correction of the threshold value pr(n,i) by 50% (0.5) due to high contrast of the corneal edges occurring in some cases. The result-ing binary image LB(m,n,i) is analysed to enable determination of the outer edge of the cornea. One of the simplest methods is the calculation of the XOR value between two images. LB(m,n,i) is one image and the other one is the result of its morphological erosion LE(m,n,i) = min(LB(m,n,i)) with a structural elementSEsizedMSE×NSE×ISE= 3 × 3 × 3 pixels. It results in the matrixLK(m,n,i):
LKðm;n;iÞ ¼ minSE ðLBðm;n;iÞÞ
∨ðLBðm;n;iÞÞ ð2Þ
Since only the outer limit is determined, its contour LP(1)(n,i) can be defined as follows:
LRðm;n;iÞ ¼ m0 otherif LKðm;n;iÞ ¼1
ð3Þ
Lð Þ1
P ðn;iÞ ¼ minmðLR0ðm;n;iÞÞ otherif LKðm;n;iÞ ¼1
ð4Þ
The results are, to a large extent, influenced by the brightness of the iris cross-section which, in turn, affects the overvaluation of the threshold valuepr. As a result, the proper edge of the cornea is not properly recognized. For the analysed 13'400 2D images, the above method of edge detection works well in about 80% of cases. The value of 80% of cases was defined as the number of correctly detected corneal contours in all analyzed cases (13'400 2D images). The correctly detected corneal contour was described as not having any dis-continuity points and the difference of the position of each contour point was below 10 pixels (maximum displacement of the contour line) between following series images.
The other approach involves using the well-known Canny edge detection method. The obtained result LC(m,n,i) of edge detection, for the arbitrarily selected parameters of the threshold (0.1) and standard deviation of the Gaussian filter (0.99), requires fur-ther correction. This adjustment only involves morphological closing, i.e.:
LWðm;n;iÞ ¼ min
SE maxSE ðLCðm;n;iÞÞ
ð5Þ
in about 90% of cases for the analysed 13'400 2D images. The definition of the correctly detected corneal contours were analogous to the previously described method.
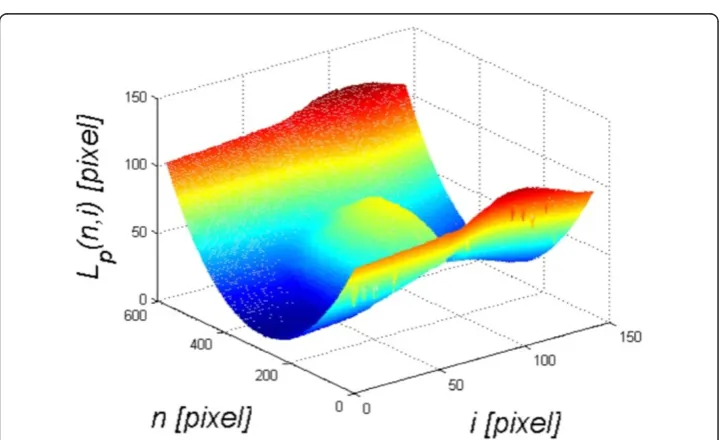
Incorrectly detected cornea outer edges coincide for both methods, (LP(1)(n,i)) andLP(2)(n,i)), and for this reason they cannot be mutually complementary. Due to better edge detec-tion in the case of the second method (Canny), it was used further (LP(n,i) for simplifi-cation). The results are shown in Figure 3.
Processing
The outer edge of the cornea LP(n,i), determined in image pre-processing, forms the basis for further analysis. Automatic designation of two important parameters, namely the correction of the cornea deformation curve and the rapidly changing cornea de-formation in dynamic states when applying force, is described below.
Cornea deformation correction
Under the influence of a pressure impulse from the Corvis tonometer, the cornea is de-formed and the entire eyeball moves in the eye socket. For proper evaluation and inter-pretation of the results, displacement of the entire eyeball should be separated from the deflection curve of the cornea. For this purpose, in the first step, the shape of the cor-nea visible in timet= 0 (fori= 1) is removed, i.e.:
LTðn;iÞ ¼LPðn;iÞ−LPðn;1Þ ð6Þ
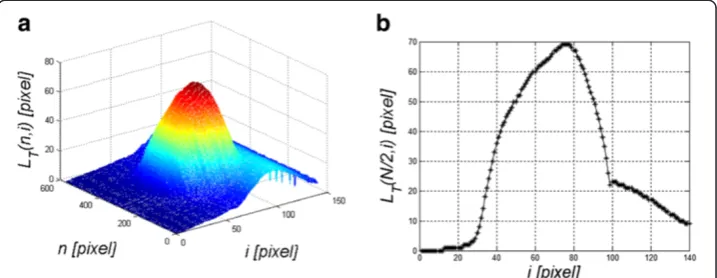
The resulting imageLT(n,i) and the graphLT(N/2,i) are shown in Figure 4. The graph LT(N/2,i) consists of two parts of the response: corneal deflection LTR(N/2,i) and the eyeball reactionLTO(N/2,i) to an air-puff stimulus, in general:
LTðn;iÞ ¼LTOðn;iÞ þLTRðn;iÞ ð7Þ
Figure 3Example of a cornea outer edge detection result.The imageLP(n,i) results from the Canny
The separation of these two waveforms (LTR(N/2,i) andLTO(N/2,i)) fromLT(N/2,i) is possible owing to the analysis of the visible contour of the cornea on the left and right borders of the image, i.e.:
LTOðn;iÞ ¼LTðN;NiÞ−−LTð1;iÞ
1 ∙ðn−1Þ þLTð1;iÞ ð8Þ
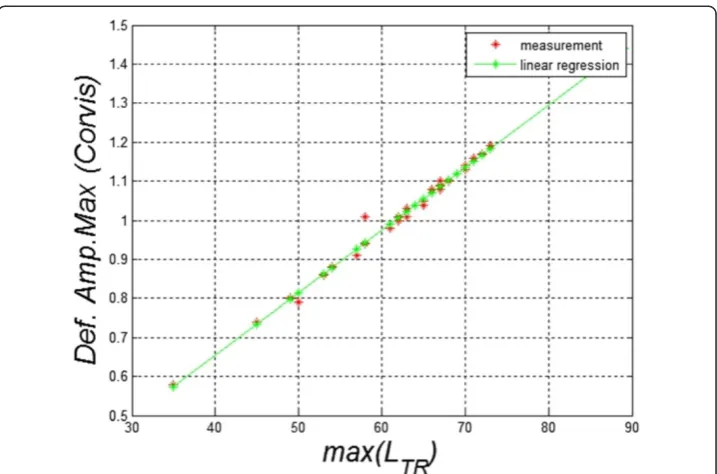
The waveform LTO(n,i) at the pointN/2 defined with the formula (8) can be subtracted fromLT(N/2,i) (formula (7)). The correctness of the algorithm was pre-verified by determin-ing the correlation between the maximum amplitude of deviation calculated by the Corvis software and the same quantity determined from the equation (7) -max(LTR). The results ob-tained are shown in Figure 5 - the error calculated as the mean standard deviation is less than 1%. Next, image analysis results are shown in Figure 6. These results (Figure 6) are extremely interesting from the point of view of biomechanics of the eye. The movement of the eyeball in response to a pressure impulse can be observed. As a result, it is possible to correct the waveform of the cornea deformation itself. Also the symmetry in the waveforms LTR(N/2,i) and LTO(N/2,i) is quite clearly visible - Figure 7. Separation of the eyeball displacement LTO(n,i) from the waveform of the cornea deformationLT(n,i) allows to measure another new parameter - rapidly changing cornea deformations visible during force application.
Rapidly changing cornea deformations during force application
Rapidly changing cornea deformations (with a frequency above 150 Hz) are directly visible in Figure 4. These deformations are not measured by the Corvis tonometer and they con-tain significant information about the biomechanical parameters of the eye (in particular the cornea). Their measurement is possible owing to the profiled image analysis algorithm.
The image LTR(n,i), resulting from the previous processing stage, undergoes an oper-ation which involves the removal of a slowly changing deformoper-ation. For this purpose, the image resulting from morphological opening is subtracted from the imageLTR(n,i), i.e.:
LQðn;iÞ ¼LTRðn;iÞ−max
SE2 minSE2ðLTRðn;iÞÞ
for a structural elementSE2sizedNSE2×ISE2= 33 × 33 pixels. The size of the structural
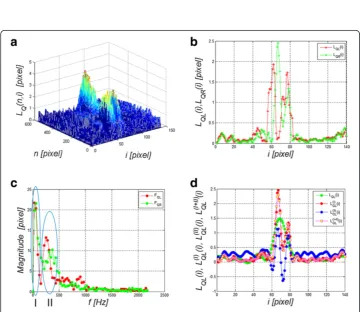
elementSE2is matched to the low-frequency range, lasting more than a few dozen mil-liseconds. The resulting image LQ(n,i) is shown in Figure 8a, whereas Figure 8b pre-sents the graphsLQL(i) andLQR(i). The results of FFT (Fast Fourier Transform), namely
FQRandFQL, of the graphsLQL(i) andLQR(i) are shown in Figure8c, whereas Figure8d
presents individual componentsLQL(I)(i) andLQL(II)(i) as well as their sumLQL(I+II)(i) of the
waveformLQL(i). The individual componentsLQL(I)(i) andLQL(II)(i) were obtained from har-monics marked in Figure8c with areas I and II. These are respectively: I- constant and slowly changing component (below 150 Hz) and II- component responsible for periodic
Figure 5Correlation between the maximum amplitude of the cornea deformation calculated with the Corvis software and the author’s algorithm.These results confirm the correctness of the adopted algorithm of analysis and processing of image sequences and their reading from the format *.cst. On this basis, other parameters described in the paper were further determined and calculated.
Figure 6Examples of analysis results - the imageLTO(n,i) is the eyeball displacement.Additionally, the graph on the righta)shows the waveformsLTO(1,i) andLTO(N,i). Using the methods of image analysis
Figure 7WaveformLT(n,i),LTO(n,i) andLTR(n,i).Separation of the waveforms (LTO(n,i) andLTR(n,i)) enabled
separation of the entire eyeball reaction from the cornea response to an air-puff stimulus. Therefore, further analysis and measurement of properties specific for each of them is possible.
Figure 8Sample result - the imageLQ(n,i) and its frequency analysis.Figurea)showsLQ(n,i),b)shows
graphsLQL(i) andLQR(i),c)shows frequency analysisFQRandFQLof the graphsLQL(i) andLQR(i),d)shows
rapidly changing (after the above 200 Hz) positions of the cornea on the left side rela-tive to the axis of symmetry (LQL(i)). The analysis of the graphsFQRandFQL(Figure8c)
provides very valuable information regarding the frequency range of the cornea changes under the influence of an air puff. It should be noted that the frequency range for the analysed cases of 96 eyes is 150 to 500 Hz.
A block diagram of the proposed algorithm is shown in Figure 9.
Results
On the basis of the proposed algorithm, a pattern LV(n,i) of the response of the cornea and the entire eyeball to an air puff was created:
LVðn;iÞ ¼LTOðN=2;iÞ þ max
SE2 minSE2 ðLTRðn;iÞÞ
ð10Þ
The obtained images of 96 eyes were compared to the pattern created for each eye separately:
LΔðn;iÞ ¼LTðn;iÞ−LVðn;iÞ ð11Þ
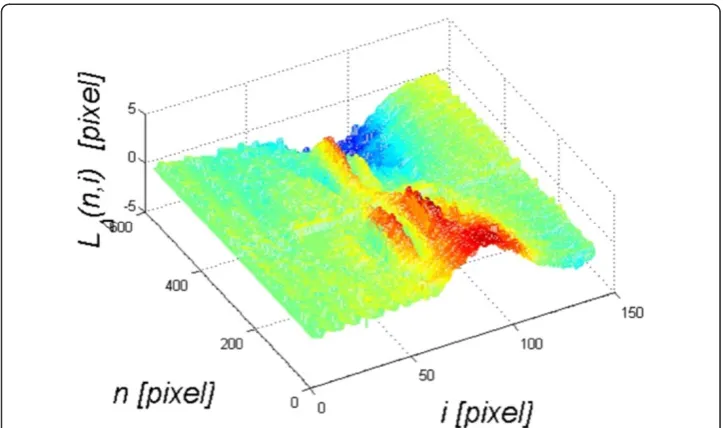
A sample result, the error LΔ(n,i), is shown in Figure 10. LΔ(n,i) is the basis for fur-ther analysis. Based onLΔ(n,i), the following new features are calculated:
w(1) - the maximum amplitude of the eyeball deflection during force application:
wð Þ ¼1 maxi∈ð Þ1;I;n∈f1;NgðLΔðn;iÞÞ ð12Þ
w(2) - the maximum amplitude in the spectra FQR and FQL for the frequency range from 150 to 500 Hz. With a fixed number of frames per second during registration with the Corvis tonometer (one frame every 23μs), it is:
wð Þ ¼2 maxi∈ð7;15Þ FQRð Þi ;FQLð Þi ð13Þ
w(3) - the duration of the rapidly changing (from 150 to 500 Hz) cornea deformations calculated as a time range with a threshold of 80% of the maximum amplitude -Figure 10.
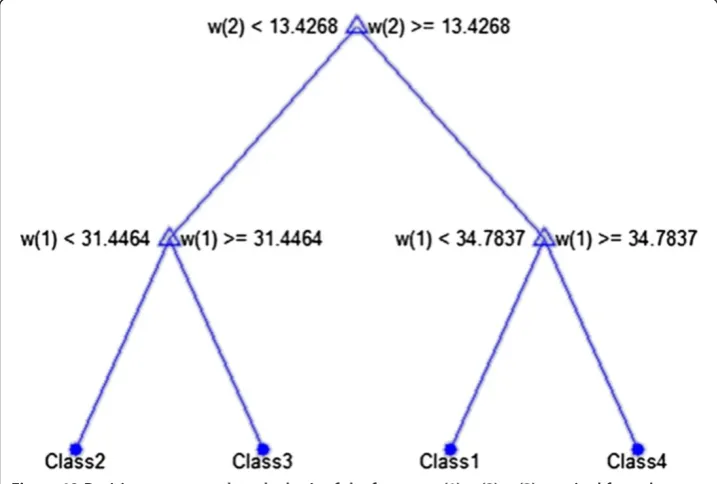
Table 1 Summary of sample featuresw(1),w(2) andw(3) for 10 eyes (only the right ones) and their division into classes according to the proposed classifier
No w(1) w(2) w(3) Class
1 37.2 2.5 17.0 1
2 15.0 3.2 16.8 2
3 13.1 4.3 22.0 2
4 25.6 5.0 19.5 2
5 20.2 28.6 28.6 3
6 13.9 16.3 30.6 3
7 38.2 3.2 24.2 1
8 48.4 20.3 25.1 4
9 21.0 25.5 25.6 3
10 20.7 5.2 23.9 2
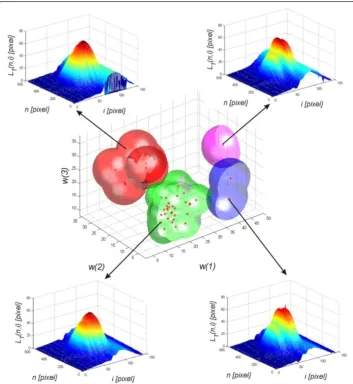
is no need to trim the tree–there is no concern that the decision tree will be overfit to the data. For the analysed number of cases, all classification results are correct. The number of the eyes classified as Class 1 is 6 (Figure 11 - red), Class 3–2 (Figure 11 blue), Class 4 – 2 (Figure 11 magenta), and the rest belongs to Class 2 (Figure 11 green). An increase in the number of the analysed eyes (patients) may, in the future, give more reliable results and provide additional evidence as to the number of classes. The individual classes, depending on the range of feature values (w(1), w(2) andw(3)) which is characteristic for them, define various types of reactions of the entire eyeball to a stimulus and different amplitudes of rapidly changing deformations of the cornea itself. A sample graph of the dependence of the maximum displacement of the entire eyeballw(1) on the cornea deformationmax(LTR) for each class is shown in Figure 13. Both the features as well as the division into classes can be further used not only as an additional diagnostic tool but they can also enrich the existing software of the Corvis tonometer.
Critical summary
The paper presents the possibility of using the profiled algorithm of image analysis, proposed by the authors, to measure additional parameters of the corneal deform-ation. This algorithm enables separation of the eyeball reaction from the corneal de-flection during force application. In addition, measurements of rapidly changing cornea deformations (from 150 to 500 Hz) were proposed. These measurements allowed to propose a pattern individually for each eye. The pattern, in turn, helped to determine deviations individually for each eye. On the basis of these deviations,
the features w(1), w(2) and w(3) as well as the classifier (decision tree) allowing a division into four classes were calculated.
The paper only presents a tool for automatic measurement of additional new parame-ters when using the Corvis tonometer. A detailed clinical examination based on this method will be presented in subsequent papers. In addition, the accuracy and repeat-ability of measurements for one patient and a phantom, the correlation of features (pri-marilyw(1)) for a single patient and the right and left eyes and the effect of the patient position during the test on the result, both IOP as well as the other features, will be verified. The issue of analysis of symmetry, or its lack, in the dynamic response of the entire eyeball to an air-puff stimulus, is quite interesting and remains open. The ana-lysis of corneal deflection parallel in other cross-sections is an open topic here. From a practical point of view, higher harmonics (above 2 kHz), that for the current sampling frequency (every 23 μs) are difficult to analyse, are also interesting. Moreover, the pre-sented methods of image analysis and processing may be carried out in another way, in another dedicated algorithm, for example, with the use of random methods of analysis of layers in tomographic eye images [26,27], the methods of mathematical morphology [28] or others [29]. The final choice of the analysis method is highly dependent on the results obtained in practice, which is an important element given the large inter-individual variability. Indeed, biomechanical parameters of the cornea, measured in dy-namic states, still represent a new area of interdisciplinary research.
Abbreviations
ROI:Region Of Interest; IOP: Intraocular Pressure; FFT: Fast Fourier Transform; LASIK: Laser-Assisted in situ Keratomileusis.
Competing interests
The authors declare that they have no competing interests.
Authors’contributions
RK suggested the algorithm for image analysis and processing, implemented it and analysed the images, wrote the full text of the manuscript. AL, AN, EW, ZW performed the acquisition the images from Corvis and HK consulted the obtained results. All authors have read and approved the final manuscript.
Acknowledgements
No outside funding was received for this study.
Author details
1Department of Biomedical Computer Systems, University of Silesia, Faculty of Computer Science and Materials
Science, Institute of Computer Science, ul. Będzińska 39, Sosnowiec 41-200, Poland.2Ophthalmology Clinic, Medical
University of Silesia, District Railway Hospital in Katowice, Katowice, Poland.3Institute of Physics, Wroclaw University of
Technology, Wybrzeze Wyspianskiego 27, Wroclaw 50-370, Poland.
Received: 19 March 2014 Accepted: 29 April 2014 Published: 3 May 2014
References
1. Luce DA:Determining in vivo biomechanical properties of the cornea with an ocular response analyzer.J Cataract Refract Surg2005,31(1):156–162.
2. Kobayashi AS, Staberg LG, Schlegel WA:Viscoelastic properties of human cornea.Exp Mech1973,12:497–503. 3. Malik NS, Moss SJ, Ahmed N, Furth AJ, Wall RS, Meek KM:Ageing of the human corneal stroma: structural and
biochemical changes.Biochim Biophys Acta1992,1138(3):222–228.
4. Sherrard ES, Novakovic P, Speedwell L:Age-related changes of the corneal endothelium and stroma as seen in vivo by specular microscopy.Eye (Lond)1987,1(Pt2):197–203.
5. Kotecha A, Elsheikh A, Roberts CR, Zhu HG, Garway-Heath DF:Corneal thicknessand age-related biomechanical properties of the cornea measured with the ocular response analyzer.Invest Ophthalmol Vis Sci2006,47(12):5337–5347.
6. Valbon BF, Ambrósio-Jr R, Fontes BM, Alves MR:Effects of age on corneal deformation by non-contact tonometry integrated with an ultra-high-speed (UHS) Scheimpflug camera.Arq Bras Oftalmol2013,76(4):229–232. 7. Brown KE, Congdon NG:Corneal structure and biomechanics: impact on the diagnosis and management of
glaucoma.Curr Opin Ophthalmol2006,17(4):338–343.
8. Dupps WJ, Wilson SE:Biomechanics and wound healing in the cornea.Exp Eye Res2006,83(4):709–720. 9. Elsheikh A, Alhasso D, Rama P:Assessment of the epithelium’s contribution to corneal biomechanics.Exp Eye
Res2008,86(2):445–451.
10. Meek KM, Leonard DW:Ultrastructure of the corneal stroma: a comparative study.Biophys J1993,64(1):273–280. 11. Fontes BM, Ambrosio R Jr, Alonso RS, Jardim D, Velarde GC, Nose W:Corneal biomechanical metrics in eyes
with refraction of−19.00 to +9.00 D in healthy brazilian patients.J Refract Surg2008,24(9):941–945. 12. Kirwan C, O’Keefe M, Lanigan B:Corneal hysteresis and intraocular pressure measurement in children using
the Reichert ocular response analyzer.Am J Ophthalmol2006,142(6):990–992.
13. Shah S, Laiquzzaman M, Bhojwani R, Mantry S, Cunliffe I:Assessment of the biomechanical properties of the cornea with the ocular response analyzer in normal and keratoconic eyes.Invest Ophthalmol Vis Sci 2007,48(7):3026–3031.
14. Touboul D, Roberts C, Kerautret J, Garra C, Maurice-Tison S, Saubusse E, Colin J:Correlation between corneal hysteresis intraocular pressure, and corneal central pachymetry.J Cataract Refract Surg2008,34(4):616–622.
15. Congdon NG, Broman AT, Bandeen-Roche K, Grover D, Quigley HA:Central corneal thickness and corneal hysteresis associated with glaucoma damage.Am J Ophthalmol2006,141(5):868–875.
16. Gatinel D, Chaabouni S, Adam PA, Munck J, Puech M, Hoang-Xuan T:Corneal hysteresis, resistance factor, topography, and pachymetry fter corneal lamellar flap.J Refract Surg2007,23(1):76–84.
17. Shah S, Laiquzzaman M, Cunliffe I, Mantry S:The use of the Reichert ocular response analyser to establish the relationship between ocular hysteresis, corneal resistance factor and central corneal thickness in normal eyes.Cont Lens Anterior Eye2006,29(5):257–262.
18. Ortiz D, Pinero D, Shabayek MH, Arnalich-Montiel F, Alió JL:Corneal biomechanical properties in normal, post-laser in situ keratomileusis, and keratoconic eyes.J Cataract Refract Surg2007,33(8):1371–1375.
19. Pepose JS, Feigenbaum SK, Qazi MA, Sanderson JP, Roberts CJ:Changes in corneal biomechanics and intraocular pressure following LASIK using static, dynamic, and noncontact tonometry.Am J Ophthalmol2007,
143(1):39–47.
20. Elsheikh A, Anderson K:Comparative study of corneal strip extensometry and inflation tests.J R Soc Interface 2005,2(3):177–185.
21. Reznicek L, Muth D, Kampik A, Neubauer AS, Hirneiss C:Evaluation of a novel Scheimpflug–based non–contact tonometer in healthy subjects and patents with ocular hypertension and glaucoma.Br J Ophthalmol2013,
97(11):1410–1414.
22. Hon Y, Lam AKC:Corneal deformation measurement using scheimpflug noncontact tonometer.Optometry & Vistion Science2013,90(1):e1–e8.
23. Leung CKS, Ye C, Weinreb RN:An ultra high-speed Scheimpflug camera for evaluation of corneal deformation response and its impact on IOP measurement.Investigative Ophtalmology & Visual Science2013,54(4):2885–2892. 24. Kling S, Marcos S:Contributing factors to corneal deformation in air puff measurements.Investigative
Ophtalmology & Visual Science2013,54(7):5078–5085.
25. Otsu N:A threshold selection method from gray-level histograms.IEEE Trans Sys, Man, Cyber1979,9(1):62–66. 26. Koprowski R, Wrobel Z:Identification of layers in a tomographic image of an eye based on the canny edge
27. Koprowski R, Wróbel Z:Layers recognition in tomographic eye image based on random contour analysis. Computer recognition systems 3.Adv Intell Soft Comput2009,57:471–478.
28. Korzynska A, Iwanowski M:Multistage morphological segmentation of bright-field and fluorescent microscopy images.Opt-Electron Rev2012,20(2):87–99.
29. Wilczyński S, Ptaszkiewicz M, Pierzchała E, Pilawa B, SwakońJ, Olko P:Electron paramagnetic resonance studies of gamma irradiated azithromycin.Current Topics in Biophysics2008,31:1–4.
doi:10.1186/1475-925X-13-55
Cite this article as:Koprowskiet al.:Selected parameters of the corneal deformation in the Corvis tonometer.
BioMedical Engineering OnLine201413:55.
Submit your next manuscript to BioMed Central and take full advantage of:
• Convenient online submission
• Thorough peer review
• No space constraints or color figure charges
• Immediate publication on acceptance
• Inclusion in PubMed, CAS, Scopus and Google Scholar
• Research which is freely available for redistribution