JIEM, 2014 – 7(4): 891-918 – Online ISSN: 2014-0953 – Print ISSN: 2014-8423 http://dx.doi.org/10.3926/jiem.1129
Systemic Assessment Framework of a Learning Organization's
Competitive Positioning
Wissam EL Hachem
1, Ramy Harik
2, Joseph Khoury
31
University of Bergen, Department of Geography, System Dynamics Group (Norway)
2
University of South Carolina, Ronald E. McNair Center for Aerospace Innovation and Research, Columbia (USA)
3
Methode Electronics Inc. (Germany)
[email protected], [email protected], [email protected]
Received: March 2014
Accepted: September 2014
Abstract:
Purpose:
The purpose of this paper is to devise an innovative feasible, replicable and
comprehensive assessment framework of a learning organization's competitive positioning.
Design/methodology/approach:
The three characteristics listed above are approached as
follows. Feasible refers to being easy and not in need of much resources (time, personnel,...).
This is done through early elimination of non-important variables. Replicable is having a well
structured methodology based on scientific proven methods. Following this methodology
would result in good results that can be explained if needed and replicated if deemed necessary.
Comprehensive translates into a holistic set of indices that measure performance as well as
organizational learning.
Findings:
The three attributes (feasible, replicable and comprehensive) have become crucial for
ensuring any kind of added value for such a methodology that hopes to tackle the modern
dynamic business environment and gaining a sustainable competitive advantage.
company's structure. Therefore a great deal of transparency and self-transcendence from the
individual involved is a pre-requisite for any chance of success.
Originality/value:
It offers a systematic way to assess a company's performance/competitive
positioning while accounting for the crucial attribute of organizational learning in its makeup.
Keywords:
organizational learning, competitive advantage, system dynamics, analytic network process,
manufacturing sustainability
1. Introduction
In our fast changing business environment, the need for a company to develop into a learning organization is becoming more and more urgent and crucial for any chance of sustaining competitiveness in the market place. Empirical research has shown that a company's knowledge management practices are all correlated with its performance (Syed & Xiaoyan, 2013). Performance in this paper is synonymous to the degree of which the company is capable of generating and sustaining competitive advantage. Based on these findings as well as numerous others, a company's performance cannot be evaluated without taking into consideration its ability to sustain and manage its knowledge, which can only be done through its development into a learning entity which itself is reliant on management of internal resources within a firm.
This paper proposes a framework that aims to assess a manufacturing company's performance in terms of achieving sustained competitive advantage. The case specific study in section 3 dealt with manufacturing sustainability as its theme. There exist ample literature that deal with topics such as competitive advantage, company's performance and organizational learning. However, according to the knowledge of the authors, there has not yet been proposed a framework that aims at evaluating company's performance, equal to competitive advantage in this paper, with emphasis on organizational learning. This is deemed crucial in modern business environments, because complexity and knowledge have exponentially grown. Hence this paper builds on previous literature, by combining the need for a systematic framework that quantitatively measures performance and competitive advantage while accounting for the crucial yet often underweighed and misconceived organizational learning element.
The framework is built on concepts and tools that span across two distinct yet relevant fields, System Dynamics (or SD) and Analytic Network Process (or ANP).
2. Literature Review
In this section, the following questions will be answered: What is organizational learning? Why is Learning so important? How does modeling help a company in becoming a learning entity? What kind of modeling fits well this purpose?
2.1. Organizational learning, Mental Models & Competitive advantage
Organizational learning has been the subject of extensive study for the past decades, and its most recent version is based on the 1990 book "The fifth Discipline" by Peter Senge (Senge, 1990). Not much detail will be given to the topic of organizational learning itself since there is plenty of papers and books, some of them are referred to in this paper, that deal solely on defining and developing this quite complex subject. However, some notions relating this topic to the overall goal of the paper must be briefly explored.
A firm's environment, external as well as internal, is made up of a complex network of variables connected with varying degrees by causality. Through continuous adjustment and learning, managers within these firms are required to understand, control and guide the output of such a system to the best interest of the company (Soderlund & Vilgon, 1993). This is organizational learning.
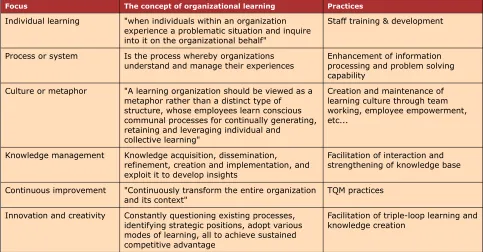
Focus The concept of organizational learning Practices
Individual learning "when individuals within an organization experience a problematic situation and inquire into it on the organizational behalf"
Staff training & development
Process or system Is the process whereby organizations
understand and manage their experiences Enhancement of information processing and problem solving capability
Culture or metaphor "A learning organization should be viewed as a metaphor rather than a distinct type of structure, whose employees learn conscious communal processes for continually generating, retaining and leveraging individual and collective learning"
Creation and maintenance of learning culture through team working, employee empowerment, etc...
Knowledge management Knowledge acquisition, dissemination, refinement, creation and implementation, and exploit it to develop insights
Facilitation of interaction and strengthening of knowledge base Continuous improvement "Continuously transform the entire organization
and its context" TQM practices Innovation and creativity Constantly questioning existing processes,
identifying strategic positions, adopt various modes of learning, all to achieve sustained competitive advantage
Facilitation of triple-loop learning and knowledge creation
Table 1. Different forms of Organizational Learning (Wang & Ahmed, 2002)
One of the basic elements in such an organization are mental models. Mental models are the major driver of any development that a company goes through. They are basically the strongest and dearest assumptions developed over the years, therefore shaping how an organization thinks and acts. A definition from (Doyle & Ford, 1998) is that a mental model is a dynamic system with “a relatively enduring and accessible, but limited, internal conceptual representation of an external system whose structure is analogous to the perceived structure of the system”. Often these mental models are misleading and too simplistic compared to the complex real life settings. (Carter, Kaufmann & Michel, 2007) by investigating behavioural supply management, showcased how decision making violates the assumptions of homo-economicus. These deviations are a result of relying on heuristics when making decisions. These developed heuristics are the manifestations of the mental models of the firms.
They present a major hurdle for the organization to develop into a learning entity. This attachment to our mental models give rise to "espoused theories" which define what we plan to do and to "theories in use" which are what we actually do. So, with a large volume of mental models operating in a silo fashion within and across the company's departments, there will be strong resistance to change and very little progress towards the strategic set of goals. A general policy adopted by the top management that guarantees open conversation and feedback from the people, would endogenize the learning process making it part of the mental models. This endogenization facilitates the success in transitioning into a learning organization (Magzan, 2012).
learning organization because it is a combination of cognitively and behaviourally driven change, and this combination is the recipe for long term change (Nemeth, 1997).
Mental models are developed over the years based on acquired experience. So, in order to be able to control organizational learning driven by the evolution of mental models, a framework that encompasses a tangible set of indicators must be in turn developed and adopted.
Learning and Knowledge are empirically proven to have a direct impact on the performance of a company (Syed & Xiaoyan, 2013). However, it is misleading to state that more learning or more knowledge is always better in achieving the desired performance. The learning must be aligned with the organization's strategic goals. Therefore its impact, taken in context with the company's goals, paves the way for an accurate assessment of its actual nature of influence in improving organizational performance (Vera & Crossan, 2010).
Organizational learning, a key asset, is difficult to mimic, to substitute, and to transfer. Knowledge catalyses the acquisition of more knowledge. If an organization develops its ability to learn, the potentially dangerous exploding circle of knowledge would be controlled and aligned with the company's goals. So, organizational learning can be said to be essential for a sustained competitive advantage (Martin-de-Castro, Navas-Lopez, Lopez-Saez & Alama-Salazar, 2005).
Simulation is a great tool for setting strategic goals and working efficiently towards their implementation. It allows modelers to benefit from constant feedback about the gap between actual results and simulated ones (Ford, 1999).
2.2. System Dynamics & Analytic Network Process
2.2.1. System Dynamics
System Dynamics is a computer simulation methodology that investigates complex dynamic problems. In most cases, there are feedback, delays and non-linearity rendering pure analytical analysis and decision making next to impossible. SD practitioners identify a dynamic problematic behaviour, formulate a hypothesis of what is potentially the root cause of it, develop a basic structure of the causal relationships of relevant components, and then augment this initial simplified structure into a formal holistic model using SD software packages such as Vensim, iThink and Powersim. There exist plenty of accessible sources, for interested readers, that deal with System dynamics philosophy, methodology and applications, however for the scope of this paper, it will not be developed more.
Causal Loop Diagrams (or CLD) or Stocks & Flows (or S & F), which comes first? Among SD practitioners, there are those of the opinion that the initial causal structure should be a simple stock and flow model versus others that argue that it should be a Causal Loop Diagram. For the purpose of evaluating sustainability initiatives within a company, CLD is believed to be the answer. From this initial CLD, a more formal and structurally correct stock and flow model will be developed.
Causal Loop Diagrams are a great tool to track in an easy fashion causal relationships, and specifically those that exhibit feedback with delays through closed loops. However, if not analysed properly, CLD's can be misleading since they do not portray an exact image of the structure of the system under investigation. There are loops that are dominant at certain times, before being dominated by dormant loops at later stages, mainly caused by non-linearity. As a result, methods were developed to quantitatively study the effects of loops. Among these methods are eigenvalue elasticity analysis, eigenvectors and dynamic decomposition weights, pathway participation metrics and traditional control theory which would all require advanced prior mathematical knowledge. Despite their complexity, they still only manage to give a partial analysis of the behaviour, deterring the willingness to apply these rigorous methods in everyday applications (Hayward, 2012).
2.2.2. ANP
A common problem when trying to investigate a problematic behaviour of a system, is that more often than not, a wide pool of variables is selected making the selection of the most important ones a complex task. There exist numerous variable reduction, causality testing and prioritization techniques that might help in initial variable selection. Among them, Principal Component analysis (or PCA), Numerical Taxonomy (or NT), Friedman's test, Analytic Hierarchy Process (or AHP) and Analytic Network Process (or ANP). Three among them, PCA, AHP and ANP are the closest to fitting the goal of the paper.
PCA is a variable reduction technique, which fits under multivariate statistics, and that studies the possible correlation relationships among the variables in question. So, it tries to reduce the variables into the principal ones which are able to portray most of the variance, and in the process revealing the otherwise hidden information (O'Rourke & Hatcher, 2013). After reducing the pool of variables into independent ones, i.e. uncorrelated, it can be used to rank and analyze decision making units (DMUs). PCA would fit perfectly the description of the method needed except that it has to satisfy one key assumption, the relationship between variables has to be linear (static over time), which would automatically rule it out for the purposes of this paper (O'Rourke, Hatcher & Stepanksi, 2005).
AHP and ANP are decision making methodologies developed by Professor Thomas Saaty. They are built with the purpose of deciding between a set of alternatives based on a set of evaluation criteria. The best decision is in most cases not the optimal one for each criterion rather than the best fit between them. Complex decisions are reduced to a series of pairwise comparisons, generated from experts judgments, which are then synthesized into a weight for each criterion. Based on the weights of the criteria, a score is assigned to each alternative with respect to a given criteria, and the higher the score the better is that option to that criteria. Each alternative, after evaluating its importance for each criteria, is assigned a global score which is then compared to the other alternatives global scores, and consequently they can be ranked from highest score to lowest. There exist ample applications in Literature, among these, (Luthra, Garg & Haleem, 2013) explores how AHP can rank different strategies to implement green supply chain management (or GSCM).
comparisons. However, when analyzing on a smaller scale, for example evaluating a certain initiative or policy within a company, where the smallest feedback could have a larger impact on the final outcome, it is important to include all the relationships and study their dependency. In this case, one seemingly simple interdependency could be the root cause behind a problematic behaviour through nonlinearity and delays.
Since PCA assumes that relationships are linear, and AHP assumes no feedback, these two methods despite being close to fitting the goal of the paper, they differ on crucial conceptual points. ANP would prove to be the best fit for analyzing and reducing the initial pool of variables considered in the investigation of a dynamic situation, where feedback, delays and nonlinearity are the norm rather than the exception.
One additional simple yet essential concept to be clarified about ANP, is the necessity to have a consistent judgment based view which would preserve the integrity of the pairwise comparison approach. In this paper, the influence of the criteria on the parent element is the perspective adopted throughout the different sectors. If we are comparing criteria 1 and 2 under parent element A, the question would be: given the parent element and the two criteria in question, which one influences more the parent element's performance?
2.2.3. Hybrid SD & ANP
ANP can be a very useful technique if the critical factors and the scope of the system dynamics model are vague, which is the scenario in the vast majority of cases. Modular approach to system dynamics modelling is a common technique that builds and investigates in stages different parts, or building blocks, of the model. ANP would be a perfect fit for helping in conceptualizing and building these blocks. In this paper's case study, the blocks would be the three sectors of manufacturing, economical and social, and the system would be the sustainability initiatives (Keij & Ashayeri, 2008).
ANP and SD would complement each other when building a framework that relies on computer simulation of complex dynamic systems. Here are a few points that justify this combination:
1. In ANP, The different elements (or variables) can be evaluated by relying on the Delphi method which entails participation of the company or entity being investigated in the investigation/modelling process from the beginning, as often deemed necessary by SD practitioners also. The eventual weights of the alternatives are derived based on pair-wise comparison of the experts judgments.
3. Rough CLD sketches of all possible relevant variables can prove extremely useful when building the ANP and when eliciting expert judgments by providing an easy visual reference for them.
Initial SD model building could rely on the findings of the ANP, i.e. which are the most influential variables contributing to the generation of the problematic behaviour, so as to make sure to include them, as well knowing which are the less important variables and try to remove them from the model. Also, when an SD model is built, and there is the need to scale it for better understanding, ANP results could be very useful in the variable elimination selection. ANP and SD model building can be used in an iterative process influencing one another as the investigation progresses.
3. Framework
This entire framework has the purpose of setting or re-setting of company's strategic goals to ameliorate their competitive positioning. It is expected that there will be quantifiable as well as non-quantifiable variables in such a study. Both SD and ANP are built to cope with soft as well as hard defined variables. Also, as the investigation progresses, some variables will be discovered that have very little historical data (whether qualitative or quantitative). SD would prove particularly useful in such situations, because it can rely on rough, yet plausible, relationships without significantly losing any of the accuracy of its findings. This property renders SD an ideal approach to investigate fluffy topics, such as company's strategies and possibly update them.
Here are the steps to be followed in the proposed framework: 1. Define the performance indicators
2. Categorize them under sectors 3. Compile an initial list of variables
4. Build a rough CLD that depicts the relationships between these variables 5. Build an ANP model based on the rough CLD
6. Identify vital variables (the ANP model would weigh the different variables in a systematic fashion while taking into account their respective strategic goals. The result would be a justifiable quantitative one that translates the management's insights into concrete distinction between vital and non-vital processes in need of investigating) 7. Build SD model (in order to investigate the dynamic relationships between these vital
8. Identify trends of development of performance (based on the SD results, performance scores will be calculated. These scores would help the company in forming a better understanding of the dynamic nature of the company's processes and of the trends of development, and accordingly set or adjust its long-term strategic goals)
9. Design or re-design policies to ameliorate Competitive positioning (based on these new insights, new performance indicators might be discovered or existing ones might be given a different weight. Accordingly, either a complete reiteration of the methodology is necessitated or just updating of the ANP model and what follows)
Complexity of modern companies renders such a framework essential, since it can cope with the large number of operational details, i.e. vast number of multidisciplinary variables, as well as capture the dynamic relationships, i.e. feedback and delays. This methodology would guarantee a higher chance that performance will be improved in a sustainable manner ensuring competitive advantage.
3.1. Hypothetical Scenario
Competitive advantage is achieved when a company has gained some knowledge that is unique and that allows it to perform at a higher level than other competing firms. Based on a survey conducted for Massachusetts Institute of Technology, that encompasses global thought and business leaders, sustainability initiatives can be said to be important for achieving competitive advantage. This is so, because there is growing media coverage and legislative pressures on companies to adopt sustainable strategies. By doing so, a company would keep up with the public trend ensuring customer satisfaction as well as acquiring intrinsic values that arise from such policies (Berns, Townend, Khayat, Balagopal, Reeves, Hopkins et al., 2009).
Superior performance of a manufacturing company would ensure competitiveness in the market place. To have a sustained edge over competitors, performance must be routinely evaluated, and by doing so future strategic goals can be set based on historical performance (Amrina & Yusof, 2011). In this application scenario, sustainable manufacturing will be the topic of investigation and will serve as the benchmark for performance. The proposed framework, highlights that competitiveness, sustainability performance and organizational learning are linked in their success or failure, and that they need to be addressed together. The scenario is fully developed till step 6, and steps 7 to 9 are limited to explanation and clarification.
3.1.1. Step one & two: Performance Indicators and Categorizing
Manufacturing sustainability is the bottom line for this scenario. The following performance indicators were selected and categorized:
Category
Manufacturing Economical Social
Performance indicators
• Supply chain
• Atmosphere
• Production
• Policy
• Technology & Lean Manufacturing
• R&D
• Supplier
• Relational Capital
• Financial
• Marketing
• Workforce
• Knowledge Management
• Human Capital
3.1.2. Step three: Category and Variable Selection
For this framework to be comprehensive, it deals with indicators ranging across distinct fields. Sustainability has commonly in literature three sectors, environmental, economical and social (Global Reporting Initiative, 2002; RobecoSam, 2013) and when it is placed in a manufacturing setting a fourth sector, manufacturing is added (Jain & Kibira, 2010) However, since the objective of this paper is studying manufacturing sustainability within a learning organization, a manufacturing sector is added into which the environmental sector is collapsed. It is judged efficient to collapse the environment sector inside the manufacturing one to be more concise since the bulk of its indicators are related to manufacturing. So, three sectors emerge: Manufacturing, economical and social.
It is important to stay focused on the task at hand and not be distracted by the over-whelming list of indicators that compose each of the categories and sub-categories. What is important for the purposes of this paper, is developing the methodology of compiling different indicators with different properties, and quantitatively judging otherwise qualitatively defined ones. In addition, the merit of the comprehensiveness of such frameworks is not the number of indicators, rather than the inclusion of as much indicators that represent the causal roots of the dynamics of organizational learning.
The first two need no further elaboration since they are straightforward and tangible in nature and dealt with heavily in literature. The third sector, social, which only its human and knowledge aspects are dealt with in this paper, will be very briefly discussed, clarified and justified as to why it is an essential component for such a framework, in manufacturing or any other kind of company. It is the sector where the organizational learning aspect will be dealt with.
The indicators within the social sector were compiled with the purpose of covering "Man" and "Methods". These are the M's of production (out of the total of 4) that tackle the topic of organizational learning.
How firms manage their internal resources is the most critical part in assessing their sustained competitive advantage. Internal resources are mostly confined within knowledge defined boundaries making them for the most part intangible. Under the ongoing fast pace of globalization, definitions and standards are constantly changing, making knowledge and more specifically knowledge creation and retention one of the most, if not the most valuable asset a company can hope to have. This knowledge, is commonly referred to in literature as Intellectual Capital or IC.
intellectual capital is the pre-requisite, and not the physical assets, behind any sustainable aptitude of a company in generating profits.
Given this large weight of IC, processes that help to internalize, propagate and maintain that knowledge within the company are becoming more and more relevant to overcome possible shifting and renewal of human capital (Bishwas & Sushil, 2012).
The social sector, confined in this paper to intellectual capital IC, is less tangible than the other two categories of Manufacturing and Economy. However, the purpose of this paper is to develop a framework that is able to transform intangible ideas into quantitatively measured ones through the use of hybrid SD-ANP simulation. Pablos (2003) define thouroughly the idea of Intellectual Capital IC and its sub-categories.
In this paper, we will refrain from extensively developing this sector, and limit the indicators to three sub-categories. The sub-categories were modified for the purposes of this paper. The sub-category of "relational capital" is transferred to the Economical category since its indicators are mostly tangible and possess an economic related definition. The sub-category of "human capital" is split into two sub-categories, "human capital" and "workforce". In this paper, the "workforce" sub-category is separeted from the "human capital" since its indicators are simple and easily observable, hence important to stress since they are most often the first ones cited by external observers and judges. The "knowledge management" category with indicators focused on knowledge defined notions, represents a small fraction of the all important organizational capital, yet recognized as the most crucial.
Hence, The social category, limited to intellectual capital in this paper is briefly explored under three sub-criteria: workforce, knowledge management (more commonly referred to in literature as organizational capital) and human capital.
The indices selected across the three sectors are kept on purpose general, so as to serve in as wide pool of cases as possible. However, an actual implementation of such a framework would require more operational, i.e. low level and detailed, indices specific to the company.
Most of the indices below would require the support of suitable information systems (Enterprise resource planning, Supply Chain Management,...),either to collect information from outside of the organization or from within. These information systems would support an efficient continuous quest of adaptation to the changing environment, which in turn preserves the competitive advantage (Arias & Solona, 2013).
Supply Chain
Distribution (Keij & Ashayeri, 2008) Overseeing the movement of goods from supplier or manufacturer to point of sale. Sub-contracting (Keij & Ashayeri,
2008) Portion of the manufacturing process is assigned to an external company Average Inventory Levels (Beamon,
1998) Levels of stock at the different components of the supply chain
Backlog (Kamath & Roy, 2007) It refers to any order for a product or service that is accumulating as a result of being delayed and not being able to be met on time Order (Kamath & Roy, 2007) It involves two components of the supply chain, and it is the act of requesting goods for a return Delivery delay (Kamath & Roy, 2007) It is the cause of backlogs and sales, and it can be thought of as a variable versus a stock (backlog is a stock of goods) Process requirement of network
partners (Haag & Tilebein, 2012) Recognize the difference between desired and actual capabilities of the different components of the supply chain in order to save large % in costs Demand variance (Beamon, 1998) It is referred to also as Bullwhip effect, and it is the amplification of small variances in demand upstream to significantly larger ones downstream
because of lack communication, ordering strategies, price fluctuations…
Atmosphere
Environmental costs in sales (Azadeh, Ghaderi, Partovi Miran, Ebrahimipour & Suzuki, 2007)
Cost of considering environmental principals to total sales
GHG emissions (Global Reporting Initiative, 2002)
Defined by the total emissions (through production, overhead and transport used for business travel). Measured by the average GHGs released per ton of product.
Water consumption (Global Reporting
Initiative, 2002) Defined by the water used for the complete direct and indirect life cycle. Measured by the average water intake per ton of product Land use (Global Reporting Initiative,
2002) Defined by the used surface land. Measured by the natural cover area percentage of the total land area. Harmful substances content (Global
Reporting Initiative, 2002)
Defined by the proportionality between the regular substances and the harmful classified ones. Measured by the percentage of restricted substances weight in products.
Production
Quality Control (Keij & Ashayeri, 2008) Quality control (QC) is a procedure or set of procedures intended to ensure that a manufactured product or performed service adheres to a defined set of quality criteria or meets the requirements of the client or customer Process improvement (Keij & Ashayeri,
2008) Checks for the validity of the process approach, planning, control, authorityand responsibility (ISO 9004 2009) Information management (Keij &
Ashayeri, 2008)
Computerized management information systems designed to collect and present the data which managers need in order to plan and direct operations within the company.
Capacity Management (Keij &
Ashayeri, 2008) Managing the on-hand capacity and augmentation as per management decision Process innovation (Azadeh et al.
2007) Technological innovation in new products, and supply of new products compared to that of competitors Percent defect & scrap & rework
(Azadeh et al., 2007) Typical production process indicators that gives a good base for assessing process efficiency Productivity (Hosseini-Nasab,
Dehghani & Hosseini-Nasab, 2013) It is simply the ratio of output to input in production that represents a certain level of efficiency Training and process experimentation
(Dyk & Pretorius, 2012)
It is determined by the amount of worker efforts and resources provided, and in turn it increases problem correction and consequently process throughput
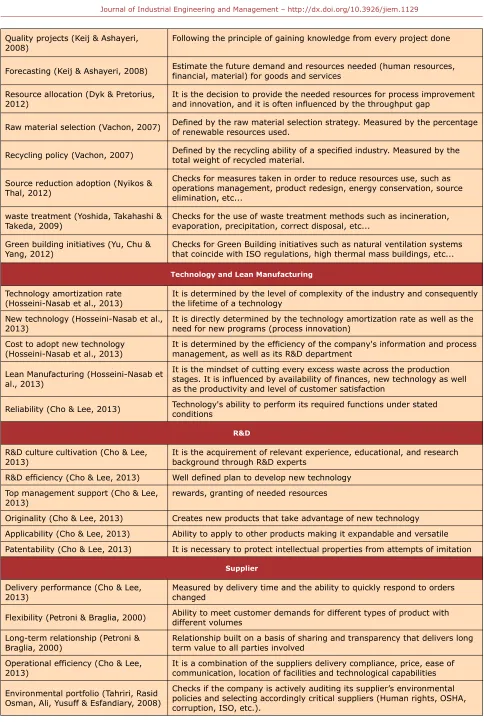
Quality projects (Keij & Ashayeri,
2008) Following the principle of gaining knowledge from every project done Forecasting (Keij & Ashayeri, 2008) Estimate the future demand and resources needed (human resources, financial, material) for goods and services Resource allocation (Dyk & Pretorius,
2012) It is the decision to provide the needed resources for process improvement and innovation, and it is often influenced by the throughput gap Raw material selection (Vachon, 2007) Defined by the raw material selection strategy. Measured by the percentageof renewable resources used.
Recycling policy (Vachon, 2007) Defined by the recycling ability of a specified industry. Measured by the total weight of recycled material.
Source reduction adoption (Nyikos & Thal, 2012)
Checks for measures taken in order to reduce resources use, such as operations management, product redesign, energy conservation, source elimination, etc...
waste treatment (Yoshida, Takahashi &
Takeda, 2009) Checks for the use of waste treatment methods such as incineration, evaporation, precipitation, correct disposal, etc... Green building initiatives (Yu, Chu &
Yang, 2012) Checks for Green Building initiatives such as natural ventilation systems that coincide with ISO regulations, high thermal mass buildings, etc...
Technology and Lean Manufacturing
Technology amortization rate
(Hosseini-Nasab et al., 2013) It is determined by the level of complexity of the industry and consequentlythe lifetime of a technology New technology (Hosseini-Nasab et al.,
2013) It is directly determined by the technology amortization rate as well as the need for new programs (process innovation) Cost to adopt new technology
(Hosseini-Nasab et al., 2013) It is determined by the efficiency of the company's information and processmanagement, as well as its R&D department Lean Manufacturing (Hosseini-Nasab et
al., 2013)
It is the mindset of cutting every excess waste across the production stages. It is influenced by availability of finances, new technology as well as the productivity and level of customer satisfaction
Reliability (Cho & Lee, 2013) Technology's ability to perform its required functions under stated conditions
R&D
R&D culture cultivation (Cho & Lee,
2013) It is the acquirement of relevant experience, educational, and research background through R&D experts R&D efficiency (Cho & Lee, 2013) Well defined plan to develop new technology
Top management support (Cho & Lee,
2013) rewards, granting of needed resources
Originality (Cho & Lee, 2013) Creates new products that take advantage of new technology Applicability (Cho & Lee, 2013) Ability to apply to other products making it expandable and versatile Patentability (Cho & Lee, 2013) It is necessary to protect intellectual properties from attempts of imitation
Supplier
Delivery performance (Cho & Lee,
2013) Measured by delivery time and the ability to quickly respond to orders changed Flexibility (Petroni & Braglia, 2000) Ability to meet customer demands for different types of product with different volumes Long-term relationship (Petroni &
Braglia, 2000) Relationship built on a basis of sharing and transparency that delivers long term value to all parties involved Operational efficiency (Cho & Lee,
2013) It is a combination of the suppliers delivery compliance, price, ease of communication, location of facilities and technological capabilities Environmental portfolio (Tahriri, Rasid
Osman, Ali, Yusuff & Esfandiary, 2008)
Checks if the company is actively auditing its supplier’s environmental policies and selecting accordingly critical suppliers (Human rights, OSHA, corruption, ISO, etc.).
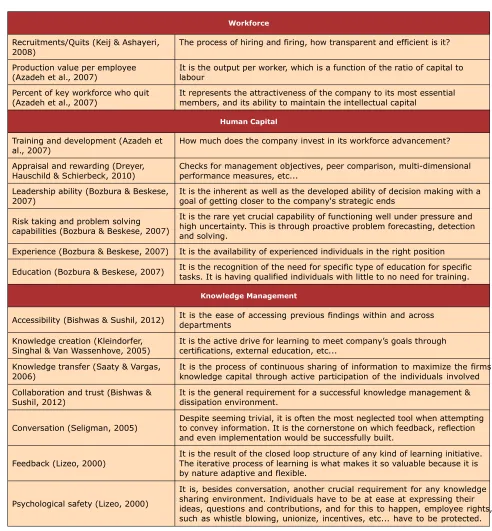
Workforce
Recruitments/Quits (Keij & Ashayeri,
2008) The process of hiring and firing, how transparent and efficient is it? Production value per employee
(Azadeh et al., 2007) It is the output per worker, which is a function of the ratio of capital to labour Percent of key workforce who quit
(Azadeh et al., 2007) It represents the attractiveness of the company to its most essential members, and its ability to maintain the intellectual capital
Human Capital
Training and development (Azadeh et
al., 2007) How much does the company invest in its workforce advancement? Appraisal and rewarding (Dreyer,
Hauschild & Schierbeck, 2010) Checks for management objectives, peer comparison, multi-dimensional performance measures, etc... Leadership ability (Bozbura & Beskese,
2007) It is the inherent as well as the developed ability of decision making with a goal of getting closer to the company's strategic ends Risk taking and problem solving
capabilities (Bozbura & Beskese, 2007)
It is the rare yet crucial capability of functioning well under pressure and high uncertainty. This is through proactive problem forecasting, detection and solving.
Experience (Bozbura & Beskese, 2007) It is the availability of experienced individuals in the right position Education (Bozbura & Beskese, 2007) It is the recognition of the need for specific type of education for specific tasks. It is having qualified individuals with little to no need for training.
Knowledge Management
Accessibility (Bishwas & Sushil, 2012) It is the ease of accessing previous findings within and across departments Knowledge creation (Kleindorfer,
Singhal & Van Wassenhove, 2005) It is the active drive for learning to meet company’s goals through certifications, external education, etc... Knowledge transfer (Saaty & Vargas,
2006) It is the process of continuous sharing of information to maximize the firmsknowledge capital through active participation of the individuals involved Collaboration and trust (Bishwas &
Sushil, 2012) It is the general requirement for a successful knowledge management & dissipation environment. Conversation (Seligman, 2005) Despite seeming trivial, it is often the most neglected tool when attemptingto convey information. It is the cornerstone on which feedback, reflection
and even implementation would be successfully built.
Feedback (Lizeo, 2000) It is the result of the closed loop structure of any kind of learning initiative.The iterative process of learning is what makes it so valuable because it is by nature adaptive and flexible.
Psychological safety (Lizeo, 2000)
It is, besides conversation, another crucial requirement for any knowledge sharing environment. Individuals have to be at ease at expressing their ideas, questions and contributions, and for this to happen, employee rights, such as whistle blowing, unionize, incentives, etc... have to be protected.
Relational Capital
Shareholders (Bozbura & Beskese,
2007) Individuals who own part of a company through stock ownership
Suppliers (Bozbura & Beskese, 2007) It is the component upstream delivering goods to the entity downstream in a supply chain Market share (Azadeh et al., 2007) It is the measure of how well a company is doing through the size of its controlled share of its relevant market Fraction of new customers (Azadeh et
al., 2007) It is a sign of the company's success in retaining its innovation and products appeal Customer service level (Azadeh et al.,
2007) It is a direct measure of the company's efforts to sustain its profits throughbuilding a loyal customer base Synergy with existing businesses (Cho
& Lee, 2013)
It is the goal of building fruitful relationships with other companies, most probably along the supply chain as well as potential competitors, to maximize the efficiency of the company's operations and profits
Financial
Investment in sales (Kamath & Roy,
2007) It is the conscious decision to increase sales capacity through more investments in staff and branding Sales growth of each product (Azadeh
et al., 2007) It is the measure of the success of maintaining the momentum of every product launch Revenue to total number of employees
(Azadeh et al., 2007) It is a measure of the company's ability to accumulate revenue with its stock of human capital Salaries and wages to production value
(Azadeh et al., 2007) It is a rough measure of the return on investment when it comes to production output value Raw material cost to production value
(Azadeh et al., 2007)
It is a measure of the efficiency of the company when designing its production process and selecting the relevant raw material in terms of monetary value
Finished goods inventory to production
(Azadeh et al., 2007) It is a measure of the company's success in transforming and increasing value in the process of producing products Value of WIP to production (Azadeh et
al., 2007) It is a measure of the how good the production line in itself is in terms preserving resources Investment (Kamath & Roy, 2007) It is the general decision to invest in an ongoing or new activity to improve the current status. It represents the company's awareness of the ever
present room for improvement
Marketing
Market potential (Cho & Lee, 2013) It is a relative measure to assess the limiting capacity in terms of how the market would react to a certain offer of product
Customer needs (Cho & Lee, 2013) It is the main indicator that should drive any kind of initiative in a companyand it is through marketing that it can be discovered and communicated with the company
Legalities (Cho & Lee, 2013) It is simply the limitations, mostly time and copywrights, that delimit the extent of marketing activities Expected time to commercialize (Cho
& Lee, 2013)
It is a very important delay that must be taken into consideration whenever planning production, hiring & firing, order placing and marketing campaign themselves
Commercialize cost (Bishwas & Sushil,
2012) It is the available funds to implement planned marketing campaigns and surveys Attractiveness of product (Haag &
Tilebein, 2012)
Even though not being a direct indicator of quality, it is often the main driver of customer adoption, especially of new and non basic commodity products
Attractiveness of competitors (Haag &
Tilebein, 2012) It is the benchmark on which to base any kind of self assessment and consequently adjustment of branding and status of product market share
3.1.3. Step Four: Rough CLD
Given this set of indices, a rough CLD is developed with the purpose of visualizing the relationships between them. Some of the connections might be removed, others might be added. It is a process highly dependent on the context in which it is being executed. For instance, an automotive manufacturing company would have different relationships than an airline one would. Different assembly lines with different policies would engender different performance indicators with different distribution of weights.
3.1.4. Step Five & Six: Build ANP Model and Weigh Indices
An ANP model was built based on this rough CLD, taking inspiration from the existing relationships. The model has three control criteria, Social, Manufacturing and Economic. The sub-sectors and indices for each of these dimensions are already discussed and defined in previous sections. The social criteria, part of the ANP model, is shown below to illustrate how it looks like using the Super Decision software offered by Creative Decision Foundation.
Figure 3. Social Sector of the ANP model
an endogenously defined goal and without an explicit cluster of alternatives, instead it will have multiple sets of sub-criteria that will serve as the alternatives in the overall goal.
Since the set of indices was kept general, it was possible to perform the pair wise comparisons by interviewing three industry experts. However, specific individuals inside the company in question would be the ideal source of information in a full application of this methodology. As mentioned earlier, a key point to remember when conducting the pairwise comparison, is having a consistent judgment based view. In this case study, the influence of the criteria on the parent element is the perspective adopted throughout the different sectors. For example, If we are comparing "Originality" and "Applicability" under "R&D", the question would be: given the parent element of "R&D", which one of the two criteria in question "Originality" or "Applicability", influences more the parent element's performance?
From the pair wise comparisons, the ANP simulation was run and weights (or priorities) were deduced for the individual indices as well as the performance indicators. After running the simulation, the resulting priorities of the performance indicators are listed below:
Name Weights
Financial 0.32172
Marketing 0.29909
Relational Capital 0.3792
Table 6. Economic Performance Indicators Priorities
Name Weights
Human Capital 0.45362 Knowledge Management 0.33716
Workforce 0.20921
Table 7. Social Performance Indicators Priorities
Name Weights
Production 0.24141
Policies 0.17842
Supply Chain 0.15821
R&D 0.14208
Supplier 0.14193
Technology and Lean Manufacturing 0.08439
Atmosphere 0.05355
In this study, there were no problems in remaining within acceptable levels of consistency, so it was no problem incorporating some of the known links between the different control criteria. However, based on (Saaty & Vargas, 2006), and from reflections on possible pitfalls that could be encountered, the following can be said; since, there are individual supermatrices for the different control criteria, in case there were difficulties in having a consistent set of judgments, it can be argued that there is no need to create a structure to link the different supermatrices and get the overall priorities. The goal can be reduced to be selection of indicators with highest priorities within each sector, which would utilize ANP as a great tool in building an SD model in modular approach sector by sector. In that case, it would be up to the modeler to judge if this decision to omit possible relationships does not compromise the entire process of deriving scores of the variables in a dynamic environment, versus risking having to artificially fix the consistency through multiple rounds of expert weight elicitation.
3.1.5. Step Seven to Nine: SD Model Building, Performance Scores and Company Strategic Evaluation
Building a formal SD model requires full knowledge of a given company's operational details. Also, it involves constant feedback from concerned individuals inside the company. Without these two pre-requisites, it is not possible to build a Stocks & Flows model for the purposes of this framework. As such, it is outside the boundary of this paper to build this model since the aim is to propose and justify a framework.
The building of the SD model is a joint effort between the modelers and the corresponding individuals throughout the company. The very process of conceiving and developing such a model would test the company's mental models and clarify the actual dynamics of processes. Historical data is needed to either formulate mathematically the relationships between variables or to just define them. Such an effort is quite difficult, because variables would pop up that have often little to no historical data. However, SD is not meant to deliver detailed results, rather to paint a picture of the complex web of relationships and their evolution over time. Through sensitivity analysis and validation testing, a model could still be deemed representative without having a full database behind every variable.
After building a valid model, the modelers could run the model a certain period into the future, and hypothesize about how the performance indicators will evolve through simulated numerical output.
Some indicators would influence positively and others negatively the sustainability performance of the company. The following two equations would enable to standardize the indicators:
Equations:
(1) (2)
where:
Yij = standardized value of the ith indicator in year j and,
Xij = value of the ith indicator in year j and,
1 < i < m: m is the number of indicators under each of the performance indicators (for example, R&D performance indicator has 6 indicators) and,
1 < j < n: n is the interval of time to be simulated (for example, if the simulation runs between 2000 and 2050, then n=50).
After calculating the standardized values of each of the indicators under a performance indicator, the performance score of a company under this indicator would be calculated the following way:
(3)
Where:
Zj = score of a certain performance indicator in the jth year (for example "Supplier" at year 10)
and,
Wi = weight (or priority) of the ith indicator (obtained from the ANP)
Then, the score for each of the categories (for example: Manufacturing, Economical and Social in this case study) is calculated using:
Where:
Zcj = score of a certain category c in year j (for example, score of Manufacturing in year 10)
Wi = weight of the performance indicator i (obtained from ANP)
Yij = score of performance indicator i in year j (for example, score of "Supplier" in year 10)
1 < c < L: L is the number of categories in the framework
1 < i < k: k is the number of performance indicators under one category (for example, there are 7 performance indicators under the "Manufacturing" category)
Finally, the performance score of the entire company is calculated using:
(5) Where:
Pj = Performance of the company in year j
Wc = Weight of the category C
Ycj = Performance score of category C in year j
The values of the indicators (Xij) are directly extracted from the numerical simulation output of
the SD model. The composite indices would clarify what areas need improvement, what policies have been successful and what have failed. Given this new knowledge, policies would be set or adjusted to guide the company towards its strategic goals. A common strategic goal for a manufacturing company would be sustained innovative products ensuring lead market share. Policies to guide the company towards that goal can focus on developing R&D, knowledge retention, active customer participation...These policies in turn are tested in the SD model, and the entire process starts again following a closed loop of learning.
4. Discussion and Limitations of the model
It is important to discuss briefly the assumptions and potential limitations that underline this framework.
This exercise which leads to the development of a ANP-SD model would force the company to examine its current status and judge if it is desirable or change is needed.
Another main point which this model is built on, is the one to one relationship which relates mental models to organizational learning, however not much emphasis was placed on discovering and altering these mental models. They are intangible by nature, however their outcomes are very much the opposite. Hence the need to develop an add-on to this framework which specifically tackles the framing of mental models in a quantitative manner. This can be done through the use of SD coupled with psychology models such as the Bruswickian lens model which measures the individuals perception of their environment and its accuracy.
Furthermore, for the purposes of this paper, which are the development of a framework and its operational details, the list of indicators is kept to minimum yet still representative of the most important ideas. It is important to stress that is not the number of indicators that reflect the comprehensiveness of such a framework, rather than the structural importance of the included indicators in generating the current dynamic competitive position of the company. Also, For the specific applications within a company, the list must be altered and fitted to the company in question. The indicators are merely the output of the company's endogenously generated behaviour, therefore each company will need a slightly different list capable of explaning and modifying the behaviour.
5. Conclusion
References
Alcantara, R.M.P., & Nobrega, G.M. (2005). Modelling for Learning Organizations and Qualitative Reasoning: Grounding a Case Study within IT Management. IJCAI Workshop on Knowledge Management and Organizational Memories.
Amrina, E., & Yusof, S.M. (2011). Key Performance Indicators for Sustainable Manufacturing Evaluation in Automotive Companies. Institute of Electrical and Electronics Engineers International Conference of Industrial Engineering and Engineering Management, Singapore.
http://dx.doi.org/10.1109/IEEM.2011.6118084
Arias, J., & Solona, J. (2013). Information Systems Supported Organizational Learning as a Competititve Advantage. Journal of Industrial Engineering and Management, 6(3), 702-708.
http://dx.doi.org/10.3926/jiem.555
Azadeh, A., Ghaderi, S.F., Partovi Miran, Y., Ebrahimipour, V., & Suzuki, K. (2007). An integrated framework for continuous assessment and improvement of manufacturing systems. Applied Mathematics and Computation, 186, 1216-1233.
http://dx.doi.org/10.1016/j.amc.2006.07.152
Beamon, B. (1998). Supply Chain Design and Analysis: Models and Methods. International Journal of Production Economics, 55 (3), 281-294. http://dx.doi.org/10.1016/S0925-5273(98)00079-6
Berns, M. Townend, A., Khayat, Z. Balagopal, B., Reeves, M., Hopkins, M.S. et al. (2009). Sustainability and Competitive Advantage. MIT Sloan Management Review, 51(1).
Bishwas, S., & Sushil. (2012). Knowledge Management and Related Emerging Issues in Organizations: A Systems Thinking using Feedback Loop Analysis. System Dynamics Conference. Bozbura, F., & Beskese, A. (2007). Prioritization of Organizational capital measurement
indicators using fuzzy AHP. International Journal of Approximate Reasoning, 44, 124-147.
http://dx.doi.org/10.1016/j.ijar.2006.07.005
Carter, C., Kaufmann, L., & Michel, A. (2007). Behavioral Supply Management: A Taxonomy of Judgment and Decision-Making Biases. International Journal of Physical Distribution & Logistics Management, 37(8), 631-669. http://dx.doi.org/10.1108/09600030710825694
Cho, J., & Lee, J. (2013). Development of a new technology product evaluation model for assessing commercialization opportunities using Delphi method and fuzzy AHP approach.
Expert Systems with Applications, 40, 5314-5330. http://dx.doi.org/10.1016/j.eswa.2013.03.038
Doyle, J.K., & Ford, D.N. (1998). Mental Models Concepts for System Dynamics Research.
Dreyer, L.K., Hauschild, M.Z., & Schierbeck, J. (2010). Characterisation of social impacts in LCA. Part 1: Development of indicators for labour right. International Journal of Life Cycle Assessment, 15(3), 247-259. http://dx.doi.org/10.1007/s11367-009-0148-7
Dyk, D., & Pretorius, L. (2012). A System Dynamics Approach to Quality Improvement Programs in a Heavy Engineering Manufacturing Environment: A Case Study. Proceedings of PICMET '12: Technology Management for Emerging Technologies, p. 3287-3296.
Ford, A. (1999). Modelling the Environment: An introduction to System Dynamics Models of Environmental Systems. United States of America, Island Press.
Ford, D. (1998). A behavioural Approach to Feedback Loop Dominance Analysis. System Dynamics Conference.
Global Reporting Initiative. (2002). Sustainability reporting guidelines. Available at:
https://www.globalreporting.org/resourcelibrary/G3-Sustainability-Reporting-Guidelines.pdf
Haag, H., & Tilebein, M. (2012). Integrating System Dynamics in a Strategic Foresight Process for Firms in Production Networks. International Conference on System Dynamics.
Hayward, J. (2012). Model Behaviour and the Strengths of Causal Loops: Mathematical Insights and a Practical Method. International System Dynamics Conference, Switzerland. Hosseini-Nasab, H., Dehghani, M., & Hosseini-Nasab, A. (2013). Analysis of Technology
Effectiveness of Lean Manufacturing Using System Dynamics. ISRN Industrial Engineering.
http://dx.doi.org/10.1155/2013/237402
Jain, S., & Kibira, D. (2010). A Framework for Multi-Resolution Modeling of Sustainable Manufacturing. Proceedings of the Winter Simulation Conference.
Kamath, N., & Roy, R. (2007). Capacity augmentation of a supply chain for a short lifecycle product: A system dynamics framework. European Journal of Operational Research, 179, 334-351. http://dx.doi.org/10.1016/j.ejor.2006.03.045
Keij, R., & Ashayeri, J. (2008). Global business process re-engineering: a system dynamics-based approach. International Journal of Operations & Production Management, 18(9/10), 817-831.
Kleindorfer, P.R., Singhal K., & Van Wassenhove, L.N. (2005). Sustainable Operations Management. Production and Operations Management, 14(4), 482-492.
http://dx.doi.org/10.1111/j.1937-5956.2005.tb00235.x
Luthra, S., Garg, D., & Haleem, A. (2013). Ideantifying and Ranking of Strategies to Implement Green Supply Chain Management in Indian Manufacturing Industry Using Analytical Hierarchy Process. Journal of Industrial Engineering and Management, 6(4), 930-962. http://dx.doi.org/10.3926/jiem.693
Magzan, M. (2012). Mental Models for Leadership Effectiveness: Building Future Different than the Past. Journal of Engineering Management and Competitiveness, 2(2), 57-63.
Martin-de-Castro, G., Navas-Lopez, J., Lopez-Saez, P., & Alama-Salazar, E. (2005). Organizational Capital as Competitive Advantage of the Firm. Journal of Intellectual Capital,
7(3), 324-337. http://dx.doi.org/10.1108/14691930610681438
Morecroft, J. (1994). Modeling for Learning Organizations. Portland, Oregon: Productivity Press.
Nemeth, L. (1997). Measuring Organizational Learning. Unpublished master's thesis. University of Western Ontario.
Nyikos, D., & Thal, A. (2012). To leed or not to leed: Analysis of cost premiums associated with sustainable facility design. Engineering Management Journal, 24(4), 50-63.
O'Rourke, N., & Hatcher, L. (2013). A Step-by-Step Approach to Using SAS®for Factor Analysis and Structural Equation Modelling. Second Edition. North Carolina: SAS Institute Inc.
O'Rourke, N., Hatcher, L., & Stepanksi, E. (2005). A Step-by-Step Approach to Using SAS® for
Univariate & Multivariate Statistics. North Carolina: SAS Institute Inc.
Pablos, P. de. (2003). Measuring and reporting knowledge-based resources: the intellectual capital report. Available at:
http://www2.warwick.ac.uk/fac/soc/wbs/conf/olkc/&indexSection=sitebuilder&sortBy=&pagenumber=1&n=1
Petroni, A., & Braglia, M. (2000). Vendor Selection Using Principal Component Analysis. The journal of Supply Chain Management: A Global Review of Purchasing and Supply, 63-69.
http://dx.doi.org/10.1111/j.1745-493X.2000.tb00078.x
RobecoSam Sustainability Investing. (2013). The Sustainability Yearbook 2013. Switzerland: RobecoSam.
Saaty, T., & Vargas, L. (2006). Decision Making with the Analytic Network Process: Economic, Political, Social and Technological Applications with Benefits, Opportunities, Costs and Risks.
New York: Springer.
Senge, P.M. (1990).The Fith Discipline: The Art & Practice of the Learning Organization. New York: Currency DoubleDay.
Soderlund, M., & Vilgon, M. (1993). Stability and Change in Decision Makers' Perceptions of the firms's environment: An Empirical Case Study of Causal Attribution by a Top Management Te a m . Journal of Economic Psychology, 14(1), 121-145. http://dx.doi.org/10.1016/0167-4870(93)90042-J
Syed, N. & Xiaoyan, L. (2013). The Linkage Between Knowledge Management Practices and Company Performance. Journal of Industrial Engineering and Management, 6(1), 1-7.
http://dx.doi.org/10.3926/jiem.656
Tahriri, F., Rasid Osman, M., Ali, A., Yusuff, R.M., & Esfandiary, A. (2008). AHP approach for supplier evaluation and selection in a steel manufacturing company. Journal of Industrial Engineering and Management, 1(2), 54-76. http://dx.doi.org/10.3926/jiem.2008.v1n2.p54-76
Vachon, S. (2007). Green supply chain practices and the selection of environmental technologies. International Journal of Production Research, 45(18-19), 4357-4379.
http://dx.doi.org/10.1080/00207540701440303
Vera, D., & Crossan, M. (2010) Organizational Learning, Knowledge Management and Intellectual Capital: An Integrative Conceptual Model. Available at:
http://www2.warwick.ac.uk/fac/soc/wbs/conf/olkc/archive/olk4/papers/vera.pdf
Wang, C., & Ahmed, P. (2002). A Review of the Concept of Organisational Learning. Working paper series. University of Wolverhampton, ISSN 1363-6839.
Yoshida, H., Takahashi, K., & Takeda, N. (2009). Japan’s waste management policies for dioxins and polychlorinated biphenyls. Journal of Material Cycles and Waste Management, 11(3), 229-243. http://dx.doi.org/10.1007/s10163-008-0235-z
Yu, M., Chu, J., & Yang, J. (2012). Green building and real estate industry sustainable development. Management & Engineering, 9, 107-111.
Journal of Industrial Engineering and Management, 2014 (www.jiem.org)
Article's contents are provided on a Attribution-Non Commercial 3.0 Creative commons license. Readers are allowed to copy, distribute and communicate article's contents, provided the author's and Journal of Industrial Engineering and Management's names are included.