ISSN 2324-805X E-ISSN 2324-8068 Published by Redfame Publishing URL: http://jets.redfame.com
The Effect of Reading Comprehension and Problem Solving Strategies on
Classifying Elementary 4
thGrade Students with High and Low Problem
Solving Success
Mustafa Ulu
Correspondance:Mustafa Ulu, Departmant of Education Scinces, Dumlupınar University, Turkey.
Received: April 7, 2017 Accepted: April 25, 2017 Online Published: April 26, 2017 doi:10.11114/jets.v5i6.2391 URL: https://doi.org/10.11114/jets.v5i6.2391
Abstract
In this study, the effect of fluent reading (speed, reading accuracy percentage, prosodic reading), comprehension (literal comprehension, inferential comprehension) and problem solving strategies on classifying students with high and low problem solving success was researched. The sampling of the research is composed of 279 students at elementary school 4th grade. In the research, in order to figure out reading accuracy percentage and reading rate, 5 scales were used: a reading text, prosodic reading scale, literal comprehension scale, inferential comprehension scale and problem solving scale. In order to see the effect of fluent reading and comprehension skills on classifying students with high and low problem solving success, logistic analysis was conducted while discriminant analysis was conducted to determine the effect of problem solving skills. At the end of the study, it was seen that fluent reading skills had no effect on classifying students according to their problem solving success. It was concluded that both comprehension skills are 77% effective in classifying problem solving success, but inferential comprehension is more effective than literal comprehension. It was found that problem solving strategies were effective on classifying students with high and low problem solving success problem at 88% level; that the most important factors while classifying were estimation and control, systematic listing, looking for a pattern and drawing figures and diagrams respectively; and that backward-studying strategies were inadequate in classifying successful and unsuccessful students. At the end of the study, mathematical sentence writing strategy appeared to be the most important strategy in classifying students with high and low problem solving success, but it had a negative correlation. In other words, a rise in the usage rate of this strategy increased the likelihood for individuals to be in the group with low problem solving success.
Keywords: elementary school, fluent reading, literal comprehension, inferential comprehension, high problem solving success, low problem solving success, logistic regression, discriminant analysis
1. Intruduction
Problem solving process is defined as a complicated process requiring multiple skills together. The constituents of this process are listed as problem comprehension, choosing the required information among the data, converting this information into mathematical symbols and reaching a solution through required operations. Although these constituents do not follow a linear path (Olkun and Toluk, 2004), it is thought that the first and key step of problem solving is reading comprehension problem and that when reading comprehension process doesn’t occur, meaningless results arise by using the numbers given in the problem randomly (Mayer, 1985; Artzt and Thomas, 1992; Hong, 1995; Morales, 1998; Goos, Galbraith and Renshaw, 2000). In the studies conducted by Wijaya, Panhuizen, Doorman and Robitzsch (2014), Ulu (2011), Singh, Rahman and Hoon (2010), Clements and Everton (1996), Clarkson (1991), Marinas and Clements (1990), Clements (1982), Clarkson (1980), it was found that elementary school students made reading comprehension-based errors during problem solving between 25% and 75%. Also, in the studies conducted by Polat and Keşan (2013), Grimm (2008), Tuohimaa et al. (2007), Plomin and Kovas (2005) reading comprehension skills were seen to have a relation with problem solving skills. In this context, the independent variables of the research were introduced fluent reading, reading comprehension concepts.
1.1 Reading Comprehension
2005; Rasinski, 2004) and fluent reading levels of students is measured upon these constituents (Keskin and Baştuğ, 2012; Başaran; 2013).
Faultless articulation of the words in a text is defined as word recognition (reading accuracy) (Başaran, 2013, Akyol, 2006). Logan (1997) referred to the importance of repetitive reading to increase word recognition level and stated that a student who meets a word /she previously read difficultly later can read it more easily; in other words, s/he recognizes the word. In the studies of Ehri and McCormick (1998), Hudson, Lane and Pullen (2005), it was determined that word recognition (reading accuracy) level affects automaticity (reading rate).
Automaticity is defined as recognition of each word in the text read and following the constructed meaning mentally by comprehending the text fast and sleekly (Stahl and Kuhn, 2002). It was stated that when automaticity and word recognition aren’t achieved, syllabication, pausing, turnabouts and falsely-read words during reading will hinder forming comprehension units. It was determined that when comprehension units aren’t formed, it will be difficult to form a relation both between the sentence constituents themselves and between the sentences (Kuhn et al 2010). It was also seen that individuals who haven’t been able to get word recognition (accuracy) and automaticity (reading rate) skills spend most of their cognitive energy during reading on accurate articulation and thus might put the main objective of reading, that is comprehension process, on the back burner (Vilger, 2008; Rasinski, 2004; Samuels, 1979).
In order to focus attention on comprehension while reading, students are supposed to have acquired word recognition and automaticity skills, but this is not enough because students are also supposed to have acquired the last constituent of fluent reading skill, which is prosodic reading. Prosody can be defined as reading the text by paying attention to intonation, stress and punctuation and adjusting volume with reference to the meaning in the text (Zutel and Rasinski, 1991; Kuhn and Stahl, 2003). According to Schwanenflugel, Hamilton, Kuhn, Wisenbaker, and Stahl (2004), prosody is what gives meaning to reading because prosody can only be felt when meaningful reading is achieved.
It was found in the studies of Jenkins and Jewell (1993), Tuohimaaa, Aunola and Nurmi (2007) Yıldız (2013), Baştuğ and Keskin (2012), Başaran (2013) that the relation between fluent reading and comprehension of 4th
grade students. According to Akyol (2006), whatever its definition is, reading is done to comprehend and this objective is divided into two: comprehending explicit expressions in a text (literal comprehension) and configuring the meaning from the implicit messages in a text (making an inference) (Baştuğ and Keskin, 2012; Başaran, 2013; Yıldırım, 2012; Fabrikant, Siekierski and Williams, 1999)
According to Kintsch (1988), literal comprehension process consists of two steps: making out the apparent meaning and making out the text-based meaning. While comprehension of the words and phrases in a text lets us see that the apparent meaning has been grasped, a case, person, place, information or a fact given explicitly in the text should be remembered to grasp text-based meaning. In a way, text-based comprehension lets us find answers for WH-questions (e.g. who, what, where, when, how) in the text. Kintsch stated that because students won’t know the meaning of some words or phrases if apparent meaning hasn’t been revealed, text-based meaning cannot be grasped either. On the other hand, in a study conducted by Perkins, Allen and Hafner (1983), it was found that only perception of the explicit information in a text isn’t enough for comprehension, but rather, the implicit message the author is trying to convey through the text should also be perceived. In order to reveal this message, it is thought that inferential comprehension should occur (Perkins et al., 1983; Mcgee and Johnson, 2003.)
Inferential comprehension aims to establish empathy between the character in the text and the reader and to determine why the event in the text is being told, what its effects are on the reader, what the motives of the main character in the text are, what the main idea the author is trying to convey in the text is and the cause and effect relations between the events (Kneene and Zimmermann, 1997). Kintsch (1988) expresses inferential comprehension as a situational model and states that establishing a situational model during comprehension will activate the background information of the reader about the event and thus richer information units will be reached which are inclined to real life and whose connection with the background information has been established. It is stated that the main purpose in reading a text is thought to be inferential comprehension (Wh-questions) but literal comprehension is a prerequisite for inferential comprehension to occur (Allen, 1985; Kinsch, 1988; Suk, 1997; Vacca, Vacca, Gove, Burkey, Lenhart, McKeon, 2006).
comprehension during reading comprehension and reasoning skill during problem solving. Background information should be activated other information should be reached with reference to the explicit information in the text both in inferential comprehension during reading comprehension and in reasoning during problem solving. Literature shows that a positive relation exists between problem solving and reasoning skills (Barbey and Barsalou, 2009; Çelik and Özdemir, 2011; Çetin and Ertekin, 2011; Umay, 2003; Yurt and Sünbül, 2014).
According to Fuentes (1998), good solvers make use of operational webs they construct in their mind while forming meaning and thus they can relate the events in the problem text and follow the flow of events throughly. It was seen in studies conducted by Prakitipong and Nakamura (2006), Wijaya et al. (2014), Kroll and Miller (1993), Tertemiz (1994) that comprehension levels of students with higher problem solving success is high, but there isn’t a big difference between students with high and low problem solving success in terms of possessing the basic skills of mathematics.
In the studies conducted by Panasuk and Beyranevand (2010), Moreno and Mayer (1999), Hegarty, Mayer and Mog (1995), success of students who used word-based and action-based solving was analyzed. In word-based strategies, such key words in the problem sentence as “more, less, times” are chosen and the operations are decided upon these key words (e.g.: if “more” is wanted, addition, if “less” is wanted subtraction, if “times” is stated multiplication is done). It is accepted in action-based interpretation that rather than the words, the plot and the relation between the events are analyzed and the whole problem text is focused on. At the end of the study, it was seen that students with action-based interpretation were more successful than those with word-based interpretation.
According to Hegarty, Mayer and Green (1992), students with high problem solving success spend most of their time to understand and plan whereas students with low problem solving success spend most of their time to problem do calculation. As a result of a study conducted by Verschaffel and DeCorte (1993), it was seen that students with higher success spent 67% of their time interpreting sentences and 33% analyzing the numbers while students with lower success spend 43% of their time interpreting words and 57% analyzing the numbers. This finding was interpreted as the fact that sentence-focused solutions were more effective than number and word-focused solutions.
In a study conducted by Hite (2009), it was tried to enhance problem solving skills of elementary school 5th grade students by providing reading comprehension education. At the end of the study, it was seen that the number of correct answers of the students who had reading comprehension difficulties rose. In an experimental study conducted by Ulu (2011), it was observed that elementary school 5th grade students’ problem solving success rose as a result of a 22-hour reading comprehension education without problem solving activities.
1.2 Problem Solving Strategies
According to Polya (1990), reading comprehension process is followed by planning for solution and planning implementation steps. According to Altun (2005), during planning stage, students choose strategies for solution and during plan implementation stage, they reach to a solution using the strategies they chose. In a study by Sulak (2005), a positive relation was found between students’ problem solving success and their rates of using problem solving strategies. It was seen in the studies of Altun, Memnun and Yazgan (2007), Altun and Arslan (2006), Özcan (2005) that elementary school students can use strategies of estimation and control, systematic listing, drawing figures, simplifying the problem, backward-studying and looking for a pattern. Relevant researches reveal that teaching problem solving affects students’ both problem solving success and attitudes towards mathematics positively (Yıldızlar, 2001; Gök and Sılay, 2008; Altun, 1995; Yazgan and Bintaş, 2005).
According to Montague (2005), when students are given strategies and a process to make mathematical problem solving less complicated, then they could learn those strategies and become successful problem solvers. Students who have experienced little success in mathematics can learn various problem-solving strategies that will help develop mathematical skills and build confidence in their own abilities as problem solvers (Pajares,1996).
In the studies by Panasuk and Beyranevand (2010), Moreno and Mayer (1999), Hegarty, Mayer and Mog (1995), Hegarty, Mayer and Green (1992). Prakitipong and Nakamura (2006), Wijaya et al. (2014), Kroll and Miller (1993), Tertemiz (1994), it was found that good solvers have higher reading comprehension levels than students with low success, but the order of importance of sub-variables of reading comprehension skills wasn’t determined. It was determined in the studies by Altun ve Memnun (2008), Altun, Memnun ve Yazgan (2007), Altun ve Arslan (2006), Özcan (2005), Ulu (2008), Kaur (1998) that students use problem solving strategies informally, but which of these strategies contribute to classifying students with high and low prolem solving success wasn’t determined. Only one study was found in the literature belonging to Altun and Memnun (2008) discriminating the strategies used by students with high and low problem solving success, but this study was conducted on university students, not elementary school students. On the other hand, it is stated that determining the implementations of the students during mathematical problem solving prcess enables us to get information about their mathematical knowledge and skills (Baki, Karataş and Güven, 2002; Karataş and Güven, 2004). It is thought that determining what students with high problem solving success can do better than students with low problem solving success will shed a light to the help to be given to students with low problem solving success. In this context, in this study, answers were sought for the following questions.
1. Are reading comprehension skills (reading rate, reading accuracy percentage, prosodic reading, literal comprehension, inferential comprehension) effective on classifying students with high and low mathematical problem solving success?
2. What is the relative order of importance of problem solving strategies in classifying students with high and low problem solving success?
2. Method
2.1 Research Model
This research questioning the existence of the effect of fluent reading (word recognition, automaticity, prosody) and comprehension (literal comprehension and inferential comprehension) skills on problem solving skill and the effect level was conducted as relational screening model. Relational screening model aims to determine the existence and/or level of change between two or more variables (Karasar, 2005).
2.2 Population and Sampling
The population of the research is composed of 4th grade students at 26 state schools during 2015/2016 education period in the city of Kütahya in Turkey. Because it would be difficult to reach them all, using proportional sampling method, a study group was formed. Karasar (2005) suggests choosing a study group using cluster sampling method when the elements in the population cannot be selected one by one. In cluster sampling method, the fair chance of being chosen is not for the elements but for the clusters with all their elements. In proportional cluster sampling, while choosing the clusters, a variable considered important for the population is categorized and by classifying the groups in the population according to this variable, they are divided into sub-populations. While choosing clusters out of these sub-populations, the ratio of the sub-population in the population is taken into account.
After 4+4+4 education system, elementary schools were divided into two: elementary and secondary schools, which made choosing the clusters to be included into the sample difficult because there wasn’t a standard scale to evaluate elementary schools. This challenge was tried to be sorted out by taking TEOG YEP (the exam to pass from elementary to secondary school) results as a scale. In this context, if the secondary school in the sampling had an elementary school, the clusters were chosen from these schools, but if not, the clusters entering the sampling were chosen from the elementary school which sent the most number of students to that secondary school.
Diagram 1. Dividing the 26 state schools in the city of Kütahya forming the research population according to 2014/2015 TEOG YEP results
According to Diagram 1, the mean 2014/2015 TEOG YEP score of the city of Kütahya is 308.92 and standard deviation is 33.47. While dividing these 26 schools into sub-populations, mean and standard deviation scores were regarded as a scale. The schools whose mean scores were higher than 2014/2015 TEOG YEP Kütahya mean score were considered successful and those with lower scores were considered unsuccessful. The schools among the successful ones with standard scores between 0 and +1 were classified as with “high” success and those with standard scores over +1 were classified as with “highest” success. The same classification was done for unsuccessful schools as those with standard scores between 0 and -1 as with “low” success and those with standard scores over -1 as with “lowest” success. With a reference to this classification, the 26 secondary schools in the city of Kütahya were divided into sub-populations as 5 with “highest” success (19.23%), 5 with “high” success (19.23%), 13 with “low” success (50%) and 5 with “lowest” success (11.53%). After this, the research sampling as chosen out of these 26 schools divided into sub-populations.
According to Diagram 1, it is seen that the overall of the schools in the sub-populations accumulated in the area with -1 mean and 0 standard deviation, while proportionally fewer schools remained between 0 and +1 and over +1 and below -1. While choosing the school to be included into the sampling, this system was taken into account and the number of schools representing each sub-population was determined by proportioning it to the number of schools in the population. Table 1 shows the schools constituting the research sampling, their departments and number of students.
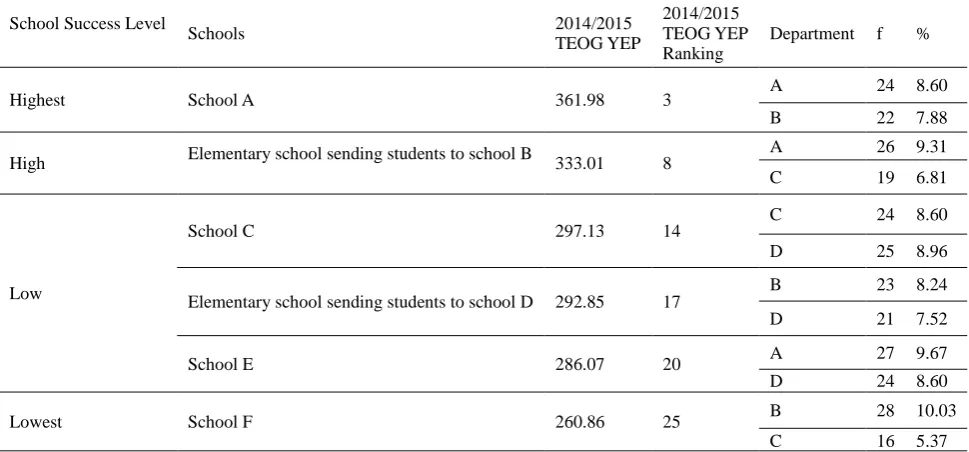
Table 1. Success level of the schools constituting the study group and student distribution in the chosen departments.
School Success Level
Schools 2014/2015
TEOG YEP
2014/2015 TEOG YEP Ranking
Department f %
Highest School A 361.98 3 A 24 8.60
B 22 7.88
High Elementary school sending students to school B 333.01 8
A 26 9.31
C 19 6.81
Low
School C 297.13 14
C 24 8.60
D 25 8.96
Elementary school sending students to school D 292.85 17
B 23 8.24
D 21 7.52
School E 286.07 20 A 27 9.67
D 24 8.60
Lowest School F 260.86 25 B 28 10.03
C 16 5.37
According to Table 1, 6 schools were determined using unbiased appointment method: 1 school from 5 schools with “highest” success rate, 1 school from 5 schools with “high” success rate, 3 schools from 13 schools with “low” success rate and 1 school from 3 schools with “lowest” success rate. The chosen schools represent 23.07% of the schools in the city of Kütahya. In terms of the 4th grade department numbers of these schools, some schools had 5, some had 4 and some had 3 departments, so the study group was composed choosing 2 departments from each of the 6 schools because the number of departments wasn’t equal. While choosing the departments, in the light of the information gathered from the school administrators, great care was taken to choose the departments that represented the category of the school best. For example, 1 out of 5 schools with “highest” success level was chosen using unbiased appointment method and became
4th sub-population
Level: Lowest
Total:3 schools (%11.53)
Sampling: 1 school
275.45 342.39
3rd sub-population
Level: Low
Total:13 schools (%50.00)
Sampling: 3 schools
2nd sub-population
Level: High
Total: 5 schools
(%19.23)
Sampling: 1 school
1st sub-population
Level: Highest
Total: 5 schools (%19.23)
Sampling: 1 school 308.92
+1
-1 0
Mean= 308.92
“School A”. While choosing 2 departments from this school, since the school was in the category of school with “highest” success, in the light of the opinions of its administrator, 2 departments with the highest success level among the 4th grades at this school were included into the sampling. The names of the schools in the sampling and the 4th grade departments weren’t given and instead, codes 1 and 2 were used. Because five different data gathering tools were applied on different days, it was seen that some students didn’t attend one or more tests and so these students were excluded. Also, it was seen that some classes had inclusive students and so these students were excluded as well. As a result, the sampling was composed of 6 schools 12 departments and 279 4th grade students. Since the second problem of the research required classifying students according to their high and low problem solving success, arithmetic mean of problem solving test was determined to be 3.13. While students with a score ≥ 3.13 from problem solving test were coded as high success, those with a score < 3.13 were coded as low success students. In this context, of the 279 students, 129 (46.74%) were in the high success group while 150 (53.76%) were in the low success group in problem solving.
2.3 Data Gathering
Evaluating fluent reading skill: Fluent reading skill was evaluated in three dimensions: word recognition (accuracy) dimension, automaticity (rate) dimension and prosody dimension. While evaluating word recognition and automaticity dimensions, a reading text comprised of 182 words and called “Ödül”, which had been used by Keskin (2012) to evaluate fluent reading skills of 4th grade students, was used. Each student was made to read the text and it was recorded to determine word recognition levels of the students. Before reading, students were reminded that “it wasn’t a speed reading contest; they were supposed to read as fast as possible but the main purpose was to comprehend the text”. Later, the video recordings were analyzed using the Informal Reading Inventory developed by Harris and Sipay (1990) and adapted to Turkish by Akyol (2006) and with a reference to the inventory, repetitions during reading, omissions, insertions, reversals, substitutions and mispronunciations were regarded as reading errors. In this context, the number of words read accurately and the total number of words (inaccurately read words included) read by each student per minute were found. According to Caldwell (2008) and Rasinski (2010), word recognition (reading accuracy) percentage is found using “the number of words read accurately per minute/total number of words read per minute x 100” formula. Automaticity (reading rate) is obtained with the number of words read accurately per minute. With a reference to these formulas, reading accuracy percentage and reading rate of each student were determined.
In order to evaluate the third dimension of fluent reading, prosody, a reading text comprised of 150 words and called
“Tiyatro” used by Keskin (2012) to evaluate fluent reading skills of 4th grade students, was used. In order to determine prosodic reading levels of the students, prosodic reading scale comprised of 15 items and developed by Keskin and Baştuğ (2011) was used. The scale with minimum score 0 and maximum score 60 was one-dimensional with Croncbach alpha coefficient .98. In this context, each student was made to read the text and it was recorded to determine word prosodic reading levels of the students. The video recordings were scored by three experts who had completed their PhD on reading comprehension in elementary school teaching using prosodic reading scale. In order to see the reliability of the scoring done by using prosodic reading scale Weighted Kappa coefficient was checked. The data obtained from Kappa coefficient are interpreted as “Poor agreement=< 0.20; Acceptable agreement=0.20-0.40; Medium agreement=0.40-.60; Good agreement=0.60-0.80; Absolute=0.80-1.00” (Şencan, 2005, p. 485). Accordingly, concordance among the scorers was found .68, which can be said to be good agreement. Prosodic reading score of each student was obtained by taking the mean of the scores which scorers gave to prosodic reading scale. In order to determine validity of the scale with a reference to the mean scores, confirmatory factor analysis (DFA) was done and it was seen that the fit indices of the model set up with the one-factor structure of the scale (χ²/sd=0.698, RMSEA=0,038, TLI=0,93, IFI=0,95, GFI=0.97) were sufficient.
obtained. In order to determine reliability of this scoring, the relation between the scores given by three experts to students was analyzed using Weighted Kappa test and the value thus obtained (r=.81) showed that there was a good agreement among scorers. Later, having the average of the scores given by the experts, literal comprehension score was obtained for each student. With a reference to the mean scores, in order to determine validity of the scale, confirmatory factor analysis (DFA) was conducted and it was seen that the fit indices of the model set up with the one-factor structure of the scale (χ²/sd=1.638, RMSEA=0,040, TLI=0,91, IFI=0,95, GFI=0.99) were sufficient.
In order to evaluate inferential comprehension skill, a text- which was developed by Başaran (2013), consisted of 226 words and was called “Mantarlar”- and a scale- which was prepared with a reference to the text, whose reliability and validity were assured upon expert opinion and which consisted of 5 questions- were used. The questions in the scale consisted of such implicit questions as finding the main idea, finding a title, lessoning, developing empathy, forming cause and effect relation. Because it was seen during pilot scheme that 15 minutes was enough to answer the test, the implementation process were structured with a reference to this duration. The answers of the students were scored as 3, 2, 1, 0 from precise answers to inaccurate answers. While loading the data statistically, replies to each question were coded and no scoring operation was done at this stage. Later, the codes were analyzed by experts who had completed PhD on reading comprehension in elementary school teaching; domain experts scored each code by reading the text. The codes on which statistical means were loaded were turned into scores with a reference to expert opinions and so inferential comprehension score given by each expert to each student was obtained. In order to determine reliability of this scoring, the relation between the scores given by three experts to students was analyzed using Weighted Kappa test and the value thus obtained (r=.64) showed that there was a good agreement among scorers. Later, having the average of the scores given by the experts, inferential comprehension score was obtained for each student. With a reference to the mean scores, in order to determine validity of the scale, confirmatory factor analysis (DFA) was conducted and it was seen that the fit indices of the model set up with the one-factor structure of the scale (χ²/sd=1.467, RMSEA=0,052, TLI=0,95, IFI=0,96, GFI=0.98) were sufficient.
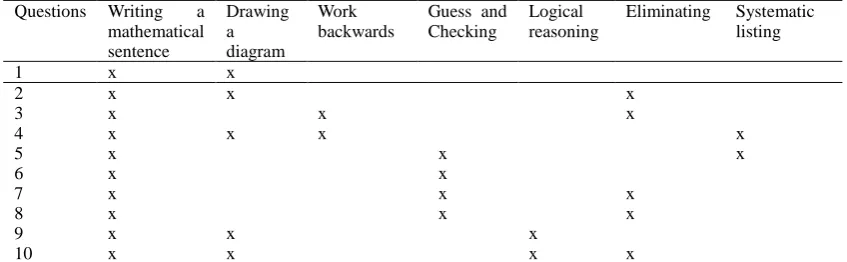
Problem solving scale: First of all, a problem-solving achievement test was developed to classify the errors made by the students in the research. The problem-solving achievement test is composed of 10 word problems used in the studies performed by Ulu (2011), Altun (2007), Yazgan and Bintaş (2005), Griffin and Jitendra (2008). While developing the test, expert opinion of three experts having completed their PhD in mathematics education in elementary teaching. The experts decided that the test had better be comprised of questions that were appropriate for using problem solving strategies suggested by MEB (2005). Table 2 shows the strategies that could be used in solving the questions in this test. Table 2.Strategies that could be used in solving the questions in problem solving test
Questions Writing a mathematical sentence
Drawing a diagram
Work backwards
Guess and Checking
Logical reasoning
Eliminating Systematic listing
1 x x
2 x x x
3 x x x
4 x x x x
5 x x x
6 x x
7 x x x
8 x x x
9 x x x
10 x x x x
The study to assess the validity and reliability of the scale was performed on 124 fourth-grade students at the school with the closest score to the Kütahya average based on the 2014/2015 YEP (Placement Scores). Firstly, the item difficulty and item distinctiveness of each question and secondly, the reliability coefficient (KR-20) of the scale was calculated in order to determine its validity and reliability. According Tekin (1997), items with an item difficulty index between 0 and 1 and difficulty indices between 0.30 and 0.70 are of a moderate difficulty level. The item difficulty indices of items in the scale vary between 0.32 and 0.48, which indicates that all of the problems in the test are of a moderate difficulty. The distinctiveness index varies between -1 and +1, with a value of 0.40 or higher demonstrating the distinctiveness of the items (Tekin, 1997). The distinctiveness indices of items in the test vary between 0.43 and 0.64, which indicates that all of the items are distinctive. The KR-20 value for the internal consistency of the scale was calculated as 0.84. If the KR-20 value is 0.70 or higher, it shows that the test has a high level of internal consistency and, therefore, reliability (Büyüköztürk, 2006).
shows that the scale has sufficient sampling size for factor analysis and Barlett test results (X2(45) =881.338; p<.01) show that the variables have equal variance (Büyüköztürk, 2006). As a result of analysis, factor loads of the scale items varied between .898 and .496 and since factor loads were sufficient, it was decided to keep all the items in the scale (Büyüköztürk, 2006). It was also seen that with its one-dimension structure, the scale explains 66.32% of problem solving variance. Also confirmatory factor analysis (CFA) was performed to determine the validity of the scale based on the average scores, and it was seen that fit indices of the model established with the scale's one-factor structure (χ²/sd=1.144, RMSEA=0.023, TLI=0.99, IFI=0.99, GFI=0.97) are sufficient.
2.4 Data Analysis
Because the dependent variable of the research consisted of two groups with high and low problem solving success, it has a categorical structure and therefore logistic regression analysis was used for the first sub-problem. The main objective of logistic regression analysis is to form a regression equation to be used in estimating which group an individual belongs to (Çokluk, Şekercioğlu and Büyüköztürk, 2010). In other words, it is classification of individuals into different groups. In this study, dual logistic regression analysis was used to determine the independent variables group that best explains the case of being a member of certain groups stated as two-category dependent variable. Since the research was exploratory, forward likelihood method was used.
Because it was aimed to determine the order of importance of contribution of the strategies to classifying successful and unsuccessful students in the second sub-problem of the research, and also because the dependent variable is a categorical variable, discriminant analysis was used. Discriminant function is used to classify individuals or units, to test the theories about whether individuals or units can be classified upon estimations, to research the differences between groups, to assess the relative order of importance of independent variables in classifications by dependent variable and to eliminate the insignificant variables with little importance in classification (Çokluk, 2012).
3. Findings
In this research, students with high and low problem solving success were compared in terms of reading comprehension (speed, reading accuracy percentage, prosody, literal comprehension and inferential comprehension) and strategies they used while solving a problem.
In the study, reading comprehension skills predictive of high and low problem solving success were analysed first. Since logistic regression analysis was conducted for the first problem, whether there was a multiple relation problem between the variables was checked first. The multiple relation problem between the predictive variables in the research were analysed in terms of eigenvalues, case indices and variance rates. Findings were presented in Table 3.
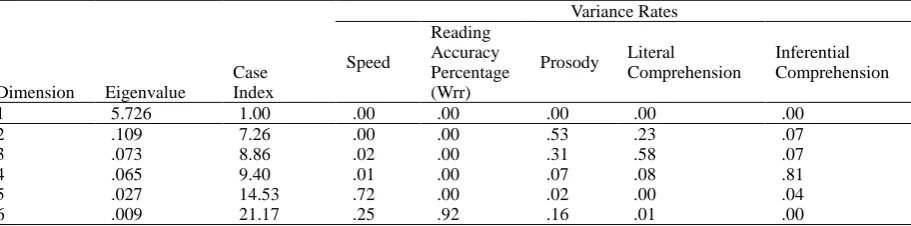
Table 3.Analysis of multiple relation problem between the predictive variables in the research in terms of eigenvalue, case indices and variance rates
Dimension Eigenvalue
Case Index
Variance Rates
Speed
Reading Accuracy Percentage (Wrr)
Prosody Literal Comprehension
Inferential Comprehension
1 5.726 1.00 .00 .00 .00 .00 .00
2 .109 7.26 .00 .00 .53 .23 .07
3 .073 8.86 .02 .00 .31 .58 .07
4 .065 9.40 .01 .00 .07 .08 .81
5 .027 14.53 .72 .00 .02 .00 .04
6 .009 21.17 .25 .92 .16 .01 .00
Table 4. Analysis of multiple relation problem between the predictive variables in the research in terms of standard error, tolerance and VIF values
According to Table 4, it is seen that tolerance values of all variables are above .1. According to Mertler and Vannatta (2005), the fact that tolerance values are above .1 shows that there is no multiple relation problem. In this context, it was seen that there was no multiple relation problem among the variables in terms of tolerance values. In terms of VIF values of each variable, it is seen that the values are below 10 and average VIF value is 1.477. According to Çokluk (2010), in order for VIF values not to cause multiple relation problems, it should be below 10. In this context, it was seen that there was no multiple relation problem in terms of VIF values either. In terms of correlation values among the variables, it is seen that there are medium level relations between the variables and no high level relations. This helps us to see there were no multiple relation problems among the variables. Since no multiple relation problems were seen among the variables, first -2LL value of null model (the model with no predictive variables) and the model’s iteration history were checked and the findings can be seen in Table 5.
Table 5. Initial Model Iteration History
Iteration -2Log Likelihood (-2LL) Coefficients
Constant Step 0
1 385.194 -.151
2 385.194 -.151
3 385.194 -.151
According to Table 5, -2LL is 385.194 before predictive variables are added to the model. Çokluk (2010) states that for excellent consistence, -2LL value should be 0 and any drops in this value contributes to the model positively. It is expected that at further stages, as predictive variables enter the model, this value will fall. After this stage, first classifications obtained as a result of logistic regression were checked and findings can be seen in Table 6.
Table 6. First classification case obtained after logistic regression
Real/observed case
Estimated case Accurate Classification
Percentage
Low Success High Success
Low Success 150 0 100.0
High Success 129 0 .0
Total Accurate Classification Percentage 53.76
According to Table 6, it is seen that all the students were classified in low success category and thus accurate classification percentage is 53.76%. This classification was only produced for the initial model with constant term and only low success students were classified accurately. The fact that the number of low success students was high in the model caused this rate to appear high; if the students had been classified according to high problem solving success category, this rate would have been 46.24% (129/279). As predictive variables are added to the model, it is expected that accurate classification percentage will rise. At the next step, standard error about the constant term constituting the initial model, Wald statistics that tests significance of the variable, degree of freedom for Wald statistics, and exponential logistic regression coefficient Exp(ß) value representing significance level of this value and Odds rate were checked. Table 7 shows the findings.
Table 7. Variables in the initial model/equation
Step 0 ß Standard Error Wald sd P Exp(ß) Constant -.151 .120 1.578 1 .209 .860
According to Table 7, it is seen that Wald value for the initial model is not significant (wald=1.578, p >.05) and that exponential logistic regression coefficient Exp(ß) value representing odds ratio is . 860. When predictive variables are added to the initial model, the changes in Wald and Odds ratios will let us see the effect of predictive variables. At the next step, information is provided about scores of the predictive variables not included in the initial model, their degrees of freedom and error chi-square values.
Predictive Variables ß Tolerance VIF
Correlations
1 2 3 4 5
1.Speed .008 .564 1.774 - .636** .346** .354** .363**
2.Wrr .093 .479 1.589 .636** - .528** .373** .301**
3.Prosody .037 .720 1.389 .346** .528** - .448** .549**
Table 8. Variables not included in the initial model/equation
Step 0 Variables Score sd P
Speed 23.327 1 .000
Wrr 18.715 1 .000
Prosody 9.372 1 .002
Inferential comprehension 72.181 1 .000
Literal comprehension 39.191 1 .000
Error chi-square statistics (x2
ßo) 86.110 5 .000
According to Table 8, it is seen that error chi-square value is significant (x2ßo=86.110, p<.01). The fact that this value is
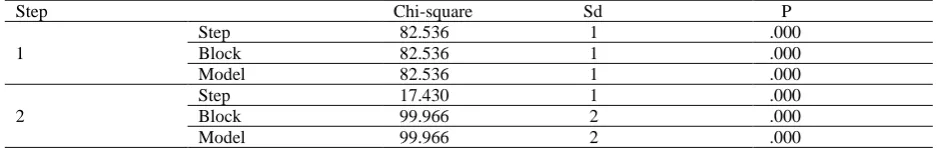
significant enables us to see that addition of one or more variables not included in the initial model to the model will increase predictive power of the model. Score variables are the effect score statistics of Roa and the fact that these values are significant means that the variables will contribute to the model (Field, 2005). The fact that all variables in the model are significant shows that they can contribute to the model. Meanwhile, in the stepwise method, the inferential comprehension variable with the highest score statistics (72.181) is the first variable to enter the model followed by literal comprehension variable (39.191). After this stage, in order to see the difference between the chi-square values of the initial and target models, Omnibus test was conducted. Findings are shown in Tablo 9. Table 9. Omnibus test of model coefficients
Step Chi-square Sd P
1
Step 82.536 1 .000
Block 82.536 1 .000
Model 82.536 1 .000
2
Step 17.430 1 .000
Block 99.966 2 .000
Model 99.966 2 .000
According to Table 9, it is seen that two variables entered the initial model and led to positive contribution to the model. In each step, increases in chi-square statistics also confirm this finding. At the next step, consistency statistics of the target model were checked. Table 10 shows the findings.
Table 10. Summary of the target model
Step (-2LL) Cox&Snell R2 Nagelkerke R2
1 302.658 .256 .342
2 285.228 .301 .402
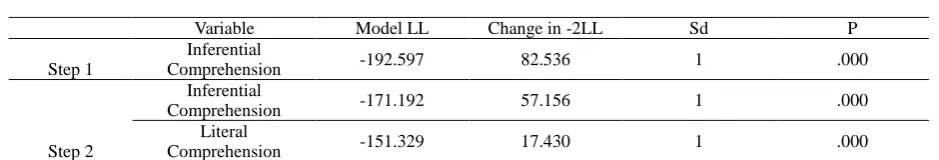
Before analysing Table 10, noting that -2LL value of the initial model was 385.194, it is seen that 2LL value decreased at (385.194-302.658) 82.536 rate when the first variable entered the initial model. When the second variable entered the model, -2LL value is seen to decrease (302.658-285.228) 17.430 more. The fact that both variables added to the initial model caused significant drops in -2LL value shows that these variables are consistent with the model. According to Field (2005), Cox&Snell R2 and Nagelkerke R2 values both show the variance amounts models explain in the dependent variant. According to Field, Nagelkerke R2 values appear to be higher than Cox&Snell R2 values. It is seen that according to Cox&Snell R2 values, inferential comprehension variable that entered the model first explained 26% of the total variance but when literal comprehension skill entered the analysis in the second step, both variables together explained 30% of the change in the variance. When this rate is analysed in terms of Nagelkerke R2 values, these three variables together explained 40% of the change in the variance (first step=.34, second step=.40). In the following stage, to assess consistency of the model as a whole, Hosmer and Lemeshow tests were conducted. Table 11 shows the findings
Table 11. Results of Hosmer and Lemeshow tests
Step Chi-square Sd P
1 13,131 6 ,041
2 10,196 8 ,252
Table 12. Classification table
Real/observed case Expected Case Accurate Classifying
Percentage Low Success High Success
Step 1 Low Success 120 30 80.00
High Success 44 85 65.89
Total Accurate Classifying Percentage 73.47
Step 2 Low Success 122 28 81.33
High Success 36 93 72.09
Total Accurate Classifying Percentage 77.06
Before analysing Table 12, considering the first classifying results, it is seen that the number of students with low problem solving success was 150 while the number of students with high problem solving success was 129 and since the group with low problem solving success was taken as reference, the accurate classifying rate was (150/279) 53.76%. When inferential comprehension variable was added to the model, 120 out of 150 students were seen to be classified accurately while 30 were classified inaccurately, which made accurate classifying percentage 80%. When the case is considered in terms of high problem solving success, 85 students out of 129 did accurate classification and 44 did inaccurate classification, which made accurate classifying rate 65.89%. Total accurate classifying percentage for the first step is 73.47%. ın the second step, when literal comprehension variable was added to the target model together with inferential comprehension variable, 122 out of 150 students were seen to be classified accurately while 28 were classified inaccurately, which made accurate classifying percentage 81.33%. When the case is considered in terms of high problem solving success, 93 students out of 129 did accurate classification and 36 did inaccurate classification, which made accurate classifying rate 72.09%. Total accurate classifying percentage for the second step is 77.06%. In the next stage, the coefficient estimations for the variables in the target model were analysed and Table 13 shows the findings.
Table 13. Coefficient Estimations for the Variables in the Target Model
Step ß Standard
error
Wald sd P Exp(ß)
1 Inferential
Comprehension .500 .068 54.292 1 .000 1.649
Constant -4.209 .566 55.300 1 .000 .015
2 Inferential
Comprehension .450 .069 42.316 1 .000 1.568
Basit Anlama .310 .078 15.890 1 .000 1.363
Constant -5.717 .741 59.549 1 .000 .003
According to Table 13, it is seen that when the first predictive variable, inferential comprehension, entered the model, Wald value, which hadn’t been significant in the initial model, became significant (Wald=54.292, p<.01), and when the second variable, literal comprehension, entered the model, Wald value sustained its significance by increasing more (Wald=59.549, p<.01). These findings enable us to see that both inferential comprehension and literal comprehension contribute to the model. According to Çokluk (2010), 1-Exp(ß).100 formula is used to determine how much low or high success odds of a variable is affected positively or negatively. This formula enables us to see that one unit increase in inferential comprehension variable caused 56.8% [(1-1.568).100] rise in low success odds while one unit increase in literal comprehension variable caused 36.3% [(1-1.363).100] rise in low success odds.
Table 14. The model when predictive variables are omitted from the model
Variable Model LL Change in -2LL Sd P
Step 1
Inferential
Comprehension -192.597 82.536 1 .000
Step 2
Inferential
Comprehension -171.192 57.156 1 .000
Literal
Comprehension -151.329 17.430 1 .000
In this section, answer was sought to the second problem of the research: “What are the differences between problem solving strategies used by students showing high and low problem solving success?” For this purpose, discriminat analysis was used. For discriminat analysis, descriptive statistics of the strategies used by students showing high and low problem solving success were analysed first and Table 15 shows the findings
Table 15. Group statistics
Strategies Group N X S
Writing mathematical sentence Low success 150 4.90 2.32
High success 129 1.72 1.54
Looking for a pattern Low success 150 .84 .74
High success 129 1.45 .59
Systematic listing Low success 150 .06 .28
High success 129 .79 .88
Estimation and control Low success 150 .37 .72
High success 129 1.87 1.31
Backward Studying Low success 150 1.14 .78
High success 129 1.40 .70
Drawing figures and diagrams Low success 150 .84 1.10
High success 129 1.80 1.19
According to Table 15, use of writing mathematical sentence is more in the group with low success (X=4.90) than the group with high success (X=1.72). The rate of use of “looking for a pattern” strategy is more in the group with high success (X=1.45) than the group with low success (X=.84). The rate of use of “systematic listing” strategy is more in the group with high success (X=.79) than the group with low success (X=.06). The rate of use of “estimation and control” strategy is more in the group with high success (X=.1.87) than the group with low success (X=.37). Similarly, the rate of use of “backward studying” strategy is more in the group with high success (X=1.40) than the group with low success (X=1.14). Finally, the rate of use of “drawing figures and diagrams” strategy is more in the group with high success (X=1.80) than the group with low success (X=.84). These findings show that except for writing mathematical sentence strategy, all the other strategies are used more in the group with high success. In the next stage, eigenvalue and canonical correlation degree of discriminant function were analysed and Table 16 shows the findings.
Table 16. Eigenvalues
Function Eigenvalue Variance Canonical correlation
1 1.612 100.0 .786
According to Table 16, it is seen that eigenvalue of discriminat function is 1.612 and according to Kalaycı (2005), this value doesn’t have a max. limit but its min. limit is .40. Accordingly, it can be said that eigenvalue of the function is rather high. Çokluk (2012) states that canonical correlation value gives information about separation efficiency of discriminant function. In this study, canonical correlation value is .79, which helps us see that this function has a strong effect on separating the strategy differences of the students with high and low success. In the next stage, Wilks’ lambda and chi-square values, other values produced for the separation efficiency of the function, were analysed and Table 17 shows the findings.
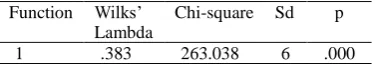
Table 17. Wilks’ Lambda statistics
Function Wilks’ Lambda
Chi-square Sd p
1 .383 263.038 6 .000
According to Table 17, Wilks’ Lambda value is .383 and according to Çokluk (2012), if this value converges to 1, it means that separation efficiency of the function is inadequate and if the value decreases, it shows that separation efficiency increases. The fact that Wilks’ Lambda value was low shows that separation efficiency of the model is high. Another value for separation efficiency is chi-square value and this value is seen to be significant for our function [X2(6)
Table 18. Wilks lambda equality of groups test
Scores Wilks’ Lambda F Sd1 Sd2 P
Writing mathematical sentence .615 173.596 1 277 .000
Looking for a pattern .829 57.126 1 277 .000
Systematic listing strategy .755 90.127 1 277 .000
Estimation and control .654 146.439 1 277 .000
Backward studying .970 8.574 1 277 .004
Drawing figures and diagrams .849 49.228 1 277 .000
According to Table 18, when significance level of each independent variable separating individuals with high and low problem solving success depending on the strategies they used is analysed, it is seen that writing mathematical sentence [F(1-277)=173.596, p<.01], looking for a pattern [F(1-277)=57.126, p<.01], systematic listing [F(1-277)=90.127, p<.01],
estimation and control [F(1-277)=146.439, p<.01], backward studying [F(1-277)=8.574, p<.01], drawing figures and
diagrams [F(1-277)=49.228, p<.01] are significant. According to Çokluk (2012), as Wilks’ Lambda values converges to 1,
the effect of the strategies in separating the groups decreases. In this context, in terms of Wilks’ Lambda values, the strategy with the least contribution to separation is seen to be backward studying while the one with the most contribution to separation is seen to be “writing mathematical sentence” strategy. In the next stage, in order to determine the strategies with the most contribution to separation, standardized discriminant coefficients and structure matrix coefficients were analysed and Table 19 shows the findings.
Table 19. Standardized coefficients for discriminant function and structure matrix coefficients
Scores Standardized coefficients Structure matrix coefficients
Writing mathematical sentence -.153 -.624
Looking for a pattern .328 .358
Systematic listing strategy .672 .449
Estimation and control .756 .573
Backward studying -.024 .139
Drawing figures and diagrams .168 .332
According to Table 19, it was determined that the strategy with the most contribution to separating students with high and low problem solving success was “estimation and control” strategy (.756), followed by systematic listing (.672), looking for a pattern (.328) and drawing figures and diagrams (.168) strategies respectively and that “backward studying” and “writing mathematical sentence” strategies had a counter effect in separation.In terms of structure matrix, it was seen that in separation, the variable with the most correlation with discriminant function was “writing mathematical sentence” strategy but the correlation was negative (-.624). This finding enables us to see that as “writing mathematical sentence” strategy is used more, the likelihood of appearing in the group with high problem solving success decreases. The strategies increasing the likelihood of appearing in the group with high problem solving success are seen to be estimation and control (.573), systematic listing (.449), looking for a pattern (.358), drawing figures and diagrams (.332) and backward studying (.139). In the next stage, the case of problem solving strategies’ classifying students with high and low problem solving success and Table 20 shows the findings.
Table 20. Classification results obtained as a result of discriminant analysis Low success High success Total
Group f % F % f %
Low success 136 90.66 14 9.34 150 100.00 High success 19 14.73 110 85.27 129 100.00 Total accurate classifying percentage=88.17%
According to Table 20, it is seen that 136 out of 150 students with low success according to the problem solving strategies they used were classified accurately and accurate classification rate for low success group was 90.66%. In terms of the same case for students with high problem solving success, 110 out of 129 students were classified accurately and accurate classification rate is seen to be 85.27%. Accurate classification rate of discriminant function according to strategies is seen to be 88.17%. According to Kalaycı (2005), accuracy of classification depends on relative chance and maximum chance criteria. In this study, the sampling consists of 279 students and 53.76% (150) of them showed low success while 46.24% (150) of them showed high success in problem solving. Therefore, these values are also chance values for both groups. As a result of analysis, the fact that accurate classifying percentage (88.17%) is much higher than these two values enabled us to see that the obtained discriminant function achieved accurate classification beyond classifying upon chance.
4. Discussion, Conclusion & Suggestions
problem solving success?” and “What is the relative order of importance of problem solving strategies in classifying students with high and low problem solving success?”
In terms of the first problem of the research, the power of reading comprehension skills in predicting students with high and low problem solving success was analysed and it was determined that fluent reading skills (reading rate, word recognition rate, prosodic reading level) weren’t effective in classifying students with high and low problem solving success. It was found in the studies of Jenkins and Jewell (1993), Tuohimaaa, Aunola and Nurmi (2007), Baştuğ and Keskin (2012), Başaran (2013), Yıldız (2013) that there is relation between fluent reading and comprehension of primary students. In this context, the fact that fluent reading skills aren’t effective on classifying students with high and low problem solving skills enabled us to see that fluent reading skills don’t affect problem solving skills directly; however, since fluent reading skills affect comprehension skills, they may affect problem solving skills indirectly. Further studies are required to determine this case.
The effect of comprehension skills (literal comprehension, inferential comprehension) in classifying students with high and low problem solving success was researched. As a result of logistic regression analysis, it was seen that chi-square value obtained in the initial model decreased almost 100 points when comprehension skills entered the model and this fall was significant. Another result obtained in the research was that comprehension skills explained of the variance 30% (Cox&Snell R2=.301) and 40% (Nagelkerke R2=.402) in classifying students with high and low problem solving success. The fact that accurate classifying percentage in the initial model 54% rose to 77% when comprehension skills entered the model enabled us to see that comprehension skills had an effect in classifying students with high and low problem solving success. No quantitative study was found about the effect of reading comprehension skills in classifying students with high and low problem solving success. In the studies by Polat and Keşan (2013), Grimm (2008), Tuohimaa et al. (2007), Plomin and Kovas (2005), a relation was found between reading comprehension skills and problem solving skills at medium level. Hegarty et al. (1992) revealed that students with high problem solving success spend most of their time for understanding and planning while students with low problem solving success spend most of their time for doing calculation. The research results carried the results of these studies one step further and revealed that comprehension skills have a direct effect in classifying students with high and low problem solving success.
The research results also revealed that one unit change in in-dept comprehension skill leads to 56.8% increase in low success odds while one unit change in literal comprehension variable leads to 36.3% increase in low success odds. This reveals that in-dept comprehension skill is more effective than literal comprehension skill in classifying students with high and low problem solving success. However, according to Kintsch (1988) literal comprehension lets us find answers for WH-questions (e.g. who, what, where, when, how) in the text. It is stated that the main purpose in reading a text is thought to be inferential comprehension but literal comprehension is a prerequisite for inferential comprehension to occur (Allen, 1985; Kinsch, 1988; Suk, 1997; Vacca et al. 2006).
The reason for the fact that inferential comprehension is more effective on classifying students with high and low problem solving skill is that, as Kispal (2008), Chikalanga (1992), Zwiers (2004), Presley (2000) and Kintsch (1988) stated, an individual who made an inference during reading comprehension was at the same time reasoning. The role of reasoning during problem solving was defined as reaching a solution by integrating every proposition in the problem text in a logical consistency (Leighton and Sternberg, 2004). With reference to the definitions above, significant resemblances are seen between inferential comprehension during reading comprehension and reasoning skill during problem solving. Background information should be activated other information should be reached with reference to the explicit information in the text both in inferential comprehension during reading comprehension and in reasoning during problem solving. Literature shows that a positive relation exists between problem solving and reasoning skills (Barbey and Barsalou, 2009; Çelik and Özdemir, 2011; Çetin and Ertekin, 2011; Umay, 2003; Yurt and Sünbül, 2014). In the studies conducted by Panasuk and Beyranevand (2010), Moreno and Mayer (1999), Hegarty, Mayer and Mog (1995) it was seen that students with action-based interpretation (inferential comprehension) were more successful than those with word-based interpretation (literal comprehension It was seen that students with higher success spent 67% of their time interpreting sentences and 33% analyzing the numbers while students with lower success spend 43% of their time interpreting words and 57% analyzing the numbers. Sentence-focused solutions (inferential comprehension) were more effective than number and word-focused (literal comprensionn) solutions (Verschaffel and DeCorte, 1993). In the studies of Anderson (2010), Grimm (2008), Jordon, Hanish and Kaplan (2003), it was seen that reading comprehension skills increase their effects on problem solving success over the years. On the other hand, Jeanne stated that there is a critical age threshold in acquiring inferential comprehension skill and if not acquired at early ages, it becomes harder to acquire inferential comprehension skill at advanced ages. In this context, it is thought that inferential comprehension which is the variable that affects problem solving skill directly most is supposed to be developed at early ages.
strategies could classify students with high and low problem solving success with 88% accuracy. This rate is higher than the accurate classifying rate obtained in comprehension skills. In a study by Ulu (2011), problem solving strategy education was found more effective than reading comprehension strategy education. Both the results of this study and the findings in the study by Ulu (2011) may reveal that problem solving strategies are more effective than comprehension skills in increasing problem solving success because they allow reaching the solution directly, but understanding the problem is required to develop suitable strategy for the problem (Mayer, 1985; Artzt and Thomas, 1992; Hong, 1995; Morales, 1998; Goos, Galbraith and Renshaw, 2000). In this context, it can be said that comprehension is the prerequisite for developing a strategy.
It was concluded that the strategies with the most contribution to classifying students with high and low problem solving success are estimation and control, systematic listing, looking for a pattern and drawing figures and diagrams respectively and the effect of backward studying strategy is low. It was seen in the studies by Ulu (2011), Altun, Memnun and Yazgan (2007), Altun and Arslan (2006) that after the strategy education, problem solving success of elementary school students increased as they started to use estimation and control, systematic listing, drawing figures and diagrams, simplifying the problem, backward studying and looking for a pattern strategies. The findings in these studies show similarities with the findings of this study. In this study, problem simplifying strategy wasn’t used by the students but except for backward studying strategy, it was seen that the likelihood of other strategies being in the group with high problem solving success increases. Both the findings of this study and related studies reveal the necessity of problem solving strategy education for development of problem solving success.
Another important finding of this study is that the highest correlation through discriminat function is shown by strategy of writing mathematical sentence, but the relation is negative. With reference to this finding, as the rate of use of strategy of writing mathematical sentence increases, the likelihood of its being in the group with low problem solving success increases. The fact that strategy of writing mathematical sentence is almost half of the strategies used in the group with low success, as well as the fact that the rate of use of this strategy in the group with high success is less than the group with low success, confirms this finding. According to Baykul, this strategy is defined as determining the operations required and constructing equations or inequations for solution. It was determined in the studies by Pape (2004), Ulu (2011), Verschaffel and DeCorte, (1993), Hong (1993/1995) that students with low problem solving success directly construct equations or inequations for solution without planning (strategy choice) or directly start operations and that the operations they choose are mostly irrelevant. Koedinger and Tabahneck (1994) found that when strategy is changed during solution, reaching a solution becomes easier, whereas Kaur (1998) found that strategy knowledge of unsuccessful students is inadequate and they can’t choose suitable strategy for solution. In this context, students with low problem solving success should be made aware that there are other strategies than strategy of writing mathematical sentence and they should be equipped with these strategies because according to Montague (2005), when students are given strategies and a process to make mathematical problem solving less complicated, then they could learn those strategies and become successful problem solvers. Also students who have experienced little success in mathematics can learn various problem-solving strategies that will help develop mathematical skills and build confidence in their own abilities as problem solvers (Pajares,1996).
Accordingly, it is concluded that students with low problem solving success should focus more on inferential comprehension skill of reading comprehension skills, followed by superficial comprehension skill. In this context, in their problem solving practices, teachers are suggested to start with inferential comprehension and literal comprehension drills to increase the success of students with low problem solving success. Reading comprehension skills weren’t effective in this study in classifying students with high and low problem solving skills, but further studies are required to determine whether these skills affect problem solving success through comprehension skills. It is seen that in terms of strategy, the most important reason for a student to be in the group with low problem solving success is that s/he uses strategy of writing mathematical sentence. In this context, strategy education for students with low success should be focused on.
References
Akyol, H. (2006). Turkish teaching styles.. 2. Baskı. Kök Publication: Ankara.
Allen, J. (1985). Inferential comprehension: The effects of text source, decoding ability, and mode, Reading Research Quarterly, 20, 603–615. https://doi.org/10.2307/747946
Allington R. L. (2006) Fluency: Still Waiting After All These Years (ss. 94-105). What Research Has To Say About Fluency Instruction. (Edt. Samuels S. J. ve Farstrup A. E.) International Reading Association: Newark.
Altun, M. (2005). Mathemetics education in primary school Bursa: Aktüel Alfa Bas. Yay.
International Congress on Mathematical Education, July 4-11, Copenhagen, Denmark. [Online]: http://www.icme-organisers.dk/tsg18/S33MuratAltun.pdf(26 Kasım 2008).
Altun, M., & Arslan, Ç. (2006). Learning to solve mathematical nonroutine problems. Journal of Uludağ University
Education Faculty , 19(1), 1-21.
Altun, M., & Memnun, S. D. (2008). Mathematics teacher trainees’ skills and opinions on solving non-routine mathematical problems. Journal of Theory and Practice in Education, 4(2), 213-238.
Altun, M., Memnun, S. D., & Yazgan,Y. (2007). Teachers’ Opinions about the Effectiveness of Science Course to Artzt, A., & Armour-Thomas, E. (1992) Development of a cognitive - metacognitive framework for protocol analysis of
mathematical problem solving in small groups. Cognition and Instruction, 9, 137-175. https://doi.org/10.1207/s1532690xci0902_3
Baki, A., Karataş, İ., & Güven, B. (2002). Assessing students problem solving skills with clinical interview. V. National Scince and Mathematics Education Semposium, 2, 1043-1049.
Barbey, A. K., & Barsalou, L. W. (2009). Reasoning and problem solving: Models. In L. Squire (Ed.), Encyclopedia of neuroscience (pp. 35-43). Oxford: Academic Press. https://doi.org/10.1016/B978-008045046-9.00435-6
Başaran, M. (2013). Reading fluency as an indicator of reading. Educational Sciences: Theory & Practice, 13(4), 2287-2290.
Bashir, A. S., & Hook, P. E. (2009). Fluency: A Key Link Between Word Identification and Comprehension. Language, Speech, And Hearıng Servıces In Schools,40, 196–200. https://doi.org/10.1044/0161-1461(2008/08-0074)
Baştuğ, M. & Keskin, H. K. (2012). The Relationship between Fluent Reading Skills and Comprehension Level (Literal and Inferential). Journal of Ahi Evran University Education Faculty ,13(3), 227-244.
Baykul, Y. (2005). Mathemetics education in primary school. Ankara: PegemA Publications.
Büyüköztürk, Ş. (2006). Data Analyzing Handbook For Social Science. Ankara: PegemA Publications.
Büyüköztürk, Ş., & Çokluk-Bökeoğlu, Ö. (2008). Discriminant analysis: Concept and application. Eurasian Journal of Educational Research, 33, 73-92.
Büyüköztürk, Ş., Kılıç, Ç. E., Akgün, Ö. E., Karadeniz, Ş., & Demirel, F. (2011). Scientific research methods. (10.bs.). Ankara: Pegem A Publications.
Çelik, A., & Özdemir, E. Y. (2011). The Relationship Between Elementary School Students’ Proportional Reasoning Skills And Problem Posing Skills Involving Ratio and Proportioni. Journal of Pamukkale University Education Faculty, 30(1), 1-11.
Çetin, H., & Ertekin, E. (2011). The relationship between eighth grade primary school students’ proportional reasoning skills and success in solving equations. International Journal of Instruction, 4(1), 47-62.
Chikalanga, I. (1992). A Suggested Taxanomy of Inferences for Reading Teacher, Reading in a Foreign Language, 8(2), 697-709.
Clarkson, P. (1980). The new error analysis-some extensions. Research in Maths Education in Australia, 11-22.
Clarkson, P. C. (1991). Language comprehension errors: A further investigation. Mathematics Education Research Journal, 3(2), 24-33. https://doi.org/10.1007/BF03217225
Clements, M. A. (1982). Careless errors made by sixth-grade children on written mathematical tasks. Journal for Research in Mathematics Education, 13(2), 136-144. https://doi.org/10.2307/748360
Clements, M. A., & Ellerton, N. (1996). The Newman Procedure for Analysing Errors on Written Mathematical Tasks. Retrieved August 17th, 2008 from http://users. tpg.com.au /arnold10/PAGES/newman.htm
Çokluk, Ö. (2010). Logistic Regression: Concept and Application. Educational Sciences: Theory & Practise),10(3), 1397-1407.
Çokluk, Ö., Şekercioğlu, G., & Büyüköztürk, Ş. (2010). Multivariate statictical analysis in social science. Ankara: PegemA Publications
Ehri, L. C., & McCormick, S. (1998). Phases of word learning: Implications for instruction with delayed and disabled readers. Ruddell,R.B.& Unrau, N.J. (Eds.) Theoretical models and processes of reading ( 5th ed.). Newark, DE: International Reading Association, Inc., 365-389. https://doi.org/10.1080/1057356980140202