Financial Mismatch, Assets Specificity and Capital
Structure
Yanwu Li (Corresponding author)
SHU-UTS SILC Business School, Shanghai University 20 Chengzhong Road, Jiading District, Shanghai 201899, China
E-mail, [email protected]
Received, August 5, 2019 Accepted, Sep 21, 2019 Published, December 1, 2019 doi,10.5296/ajfa.v11i2.14920 URL, https,//doi.org/10.5296/ajfa.v11i2.14920
Abstract
Introduction
Since the appearance of the Modigliani–Miller theorem, a great deal of literature pertains on the factors affecting capital structure. The characteristics of companies, institutional factors, macroeconomic factors etc. have all been found to have an impact on the capital structure of companies (Xiao, 2003; Li, 2007). According to Transaction Cost Economics, the key factor in determining the capital structure of a company is the asset specificity of the company. Asset specificity refers to the impairment of the value of an asset caused by changes in the entity of users or its application without sacrificing its production value. On the one hand, the higher the level of corporate asset specificity is, the higher the risk of losing the realized value of the asset will be. The risk cannot be fully paid back so that creditors will trigger a reverse adjustment in debt financing. On the other hand, according to the governance structure selection theory of Transaction Cost Economics, equity and liabilities are assigned to the hierarchy and market governance structure attributes, respectively. With the increase of asset specificity level, the application of equity financing can save financing transaction costs and results in a greater efficiency of financing transactions (Willison, 1979).
Previous research has tested the correlation between asset specificity and capital structure through empirical methods. However, research that investigates listed companies in China often neglects the impact of financial mismatch (Dai and Zhang, 2003). Financial mismatch refers to the mismatch between the allocation structure and the efficiency of financial resources. As a scarce resource, financial resources should flow to high-efficiency departments and companies to ensure the efficiency of financial resource allocation. However, the allocation of financial resources in China exhibits a problem of inefficient and unbalanced mismatch. First, the capital structure of a company is directly affected by the allocation structure of financial resources. Secondly, the Transaction Cost Economics is based on the historical market experience, while the financial mismatch as a non-marketization behavior eases the assumptions of Transaction Cost Economics, restricting and distorting the governance ability of debt financing in financing contracts. Hence, it breaks the bond between asset specificity and capital structure, and causes an impact on the relationship between the two.
empirical evidence on how to ease financial mismatch, how to improve the efficiency of financial resource allocation, and how to improve the financial market of China.
The remaining part of this paper is organized as follows. Section 2 reviews related literature. Section 3 is devoted to theoretical analysis, hypothesis development and introduces the data. Section 4 presents the empirical analysis. Section 5 concludes and proposes policy implications. Related Literature
2.1 Financial Mismatch
The concept of financial mismatch arises from the theory of resource allocation efficiency. Samuelson (2005) pointed out that the scarcity of resources is what economics is for. The scarcity of resources and the infinite demand of people create resource allocation problems. Resource allocation efficiency reflects the benefits of the allocation of scarce resources among different production entities, i.e., the efficiency of resource allocation to the most efficient departments and compaies (Cai, 2006). The allocation of financial resources plays a leading role in resource allocation, as the flow of financial resources drives the flow of other economic resources. As Coase (1965) pointed out, whether a company’s demand for financial resources can be met determines its economic development. According to the resource allocation efficiency theory, financial resources should flow to the departments and companies with the highest operating efficiency. The efficiency and financial resource allocation should be consistent to achieve the Pareto optimality of financial resource allocation (Wang, 1999; He et al., 2004).
Table 1. Average interest rate of the above-scale* state-owned enterprises and private enterprises
*Before 2011, the above-scale enterprise refers to the annual operating income of enterprises above 5 million yuan. This standard was improved to 20 million in 2011.
There are two concepts that need to be discerned, financial mismatch and credit discrimination. Credit discrimination emphasizes the flow of financial resources to state-owned enterprises, while financial mismatch emphasizes the flow of financial resources to inefficient enterprises. At the present stage, the low efficiency of state-owned enterprises in China leads to the overlap of credit discrimination and financial mismatch, but there are essential differences between the two concepts. First of all, the starting point of the two is different. The starting point of credit discrimination is the nature of property rights of enterprises, and the starting point of financial mismatch is enterprise efficiency. Secondly, credit discrimination is one of the manifestations of financial mismatch, but it cannot cover all financial mismatch. Lastly, credit discrimination is a narrow concept, while financial mismatch is a broad concept — a financial mismatch can also exist in firms of the same property right. For example, local governments do not hesitate to obtain loans for inefficient state-owned enterprises through administrative interventions. Other high-efficiency state-owned enterprises cannot obtain such strong government support, which reflects the problem of financial mismatch within state-owned enterprises.
Wang (2000) mainly focused on the allocation of financial resources. By analyzing the distribution of financial resources in China, Wang(2000) pointed out that the current allocation efficiency is low. Mainly occurred in, (1) financial institutions do not have flexible operating methods as well as lack of high-level management, and are unable to provide high-quality financial services. Hence it leads to lower financial market efficiency. (2) Although state-owned enterprises are state-backed, their operating management concepts lag behind, management level is low, and the operating mechanism is not flexible. Although financial institutions such as banks will make large amounts of loans in terms of access to funds, poor business management leads to fail to create value, which makes it impossible for banks to effectively withdrawal of funds and increases financial risks. In addition, the reason for the low financial efficiency is information asymmetry and unreasonable resource allocation.
Deng (2003) analyzes financial efficiency by constructing a model of economic efficiency and then using this as a tool to analyze financial efficiency. The result is that China’s current financial efficiency is low. Shen (2006) pointed out that Chinese financial efficiency is still at a low level at the macro level, and the main reason for the low efficiency is the lack of high-level financial resources. The most urgent task is to insist on efficiency priority in principle. As Zhang and Ma (2012) pointed out that the macroeconomic indicators cannot fully reflect the status quo of financial mismatch in China, Yu (2003) pointed out that the debt management in the capital structure of listed companies in China exhibits ineffectiveness, leading to the
Firm 2004 2005 2006 2007 2008 2009 2010 2011 Average
interest rate
State-owned 1.77% 1.82% 2.25% 2.05% 1.88% 1.84% 1.90% 1.93%
inefficiency of financial resource allocation, and the company’s debt level is significantly negatively correlated with corporate performance. Zhang (2004) pointed out that in an incomplete information dynamic game theory, the debt ratio can convey the profit distribution information to investors. The better the performance, the higher the debt ratio should be. However, the financial resource allocation structure of some listed companies in China is contrary to the operational efficiency.
Wen (2014) pointed out that for Chinese enterprises, the financial mismatch will greatly affect the performance of enterprises, and this negative effect will not only be reflected in the current period, but also in the later developing period. For the intensity of the research and development, a large amount of resources invested will affect the performance improvement, and the results will be difficult to work at the present stage. However, for the later stage, the longer research time extend, the greater increase of performance come from research result will be present. Zhou (2016) conducted a comparative analysis of private and state-owned enterprises. The result showed that for private enterprises, there is a positive relationship between the degree of mismatch and the rate of return on capital. For state-owned enterprises, the relationship between the two shows a negative correlation. After analyzing the comparison of the degree of mismatch in the past years, it argued that the degree of mismatch of state-owned enterprises is higher. Lu (2008) used the ratio of the total credit of the big four state-owned banks to the total credit of the bank and the deposit-loan ratio of the state-owned commercial banks as indicators to measure the financial mismatch in the financial system. Lu (2008) concluded that the Chinese government control finance strictly and financial mismatch is concentrated in the problem of the asymmetry of productivity and financing capacity of state-owned enterprises and private enterprises, thus restraining economic growth. Shao (2009) studies the mismatch of financial resources among enterprises from the perspective of financial structure. It also found that banks allocate loans to state-owned enterprises at a lower cost and charge higher credit costs to non-state-owned enterprises. The return on capital for stated-owned is much lower than that of non-state-owned enterprises. If we can reduce the mismatch of financial resources among enterprises, it will increase GDP growth by 2%-8%. Qi (2015) based on the micro-data of China’s manufacturing industrial enterprises to measure the mismatch of financial resources, taking the Hsieh & Klenow (2009) as reference which proposed inter-industry capital mismatch measurement method for heterogeneous enterprise under monopolistic competition. By measuring the actual productivity and effective productivity of the two departments of the state-owned sector and the non-state sector, the model compares the loss of social total factor productivity caused by the mismatch of financial resources. In summary, previous research on the relationship between asset specificity and capital structure of listed companies in China does not lead to a more consistent conclusion. As a manifestation of the non-marketization of financial resources allocation in China, financial mismatch widely exists. Financial mismatch not only reduces the efficiency of financial resource allocation, but also causes the lack of governance in the debt financing market. Therefore, research on the relationship between asset specificity and capital structure for listed firms in China must consider the impact of financial mismatch.
Hypothesis 1, There is a financial mismatch in listed companies in China, and the financial mismatch phenomenon of state-owned listed companies is more significant than that of private listed companies.
2.2 Asset Specificity and Capital Structure
Previous research on the relationship between asset specificity and capital structure is basically carried out within the framework of Transaction Cost Economics, Relatively consistent conclusions have been reached. Balakrishnan and Fox (1993) measured asset specificity by the ratio of the sum of advertising costs and research and development expenses to revenue. The study found that there is a significant negative correlation between the two. Different previous research measures asset specificity in different ways, including asset specificity index, ratio of government sales revenue to total revenue, or ratio of advertising expenditure to total revenue. Previous research has generally obtained consistent conclusion that asset specificity is inversely related to debt financing (Cushing and McCart, 1996; Mocnik, 2001; Miknler and Vilasusoh, 2001).
However, empirical findings on the relationship between asset specificity and capital structure in China are inconsistent. Qian et al. (2002) use questionnaire survey of selected companies as the research method and mainly focus on Shanghai manufacturing industry, when they are studying the specificity of assets and the internal capital structure of enterprises. They investigated the financial data of these enterprises from 1992 to 1999. The survey results showed that the company’s debt ratio will fluctuate with the change of asset specificity, and the two are positively correlated. This is contrary to the research conclusions of scholars outside China. Liu et al(2003) discuss the ratio of asset specificity to internal capital formation. They combine existing related academic achievements and relevant field expertise to explore whether the company’s internal capital formation ratio will be affected by the proportion of specific assets. The final research results show that the proportion of internal capital formation is significantly affected by the proportion of specific assets, and is numerically positively correlated.
Wang and Fan (2004) used a combination of theoretical analysis and empirical analysis when studying the proportion of internal capital formation in enterprises, which is influenced by the proportion of specific assets. Their theoretical basis is based on Jon Vilasusoh and Alanson Minkler (2001) theoretical research. Then, based on this empirical research, it chose two indicators to replace the proportion of the specific assets in the enterprise assets. The two variables are the ratio of the income generated by the main business of the enterprise to the income generated by all businesses and the ratio of the expenses incurred by the enterprise for advertising consumption to the income generated by the normal business of the company, when face the question about how to measure the proportion of the specific assets of corporate assets. The empirical results of their research are that the greater the proportion of specific assets in corporate assets, the higher the debt ratio formed by external borrowing, and the two are positively correlated.
specificity, he selected the fixed assets/total assets, intangible assets/total assets as two indicators. He chose five variables as the control variables for empirical analysis considering that the capital structure has many factors. The empirical results showed that different industries have different effects on asset specificity. The effect of the food industry group is not very obvious, while the effect of the home appliance group is obvious, and the two have a negative correlation.
Yuan and Zhao (2006) first use theoretical analysis to illustrate, making use of transaction cost theory, and then based on theory to conduct an empirical analysis. The empirical model mainly draws on Vilasusoh and Minkler (2001) model. The model takes China’s A-share listed companies as academic research objects. The empirical data proves that asset specificity and capital structure will affect each other, and there is a numerically proportional relationship between the asset specificity and capital structure.
Li et al. (2007) analyzed the relationship between capital structure and asset specificity in corporate assets, adding the analysis of market competition factors. First, the relationship among capital structure, asset specificity in corporate assets and market competition factors under the perspective of transaction costs. Then based on theoretical analysis, it established an empirical analysis model. The empirical results show that when the product competition of the enterprise increases, the financial leverage will increase at the beginning, but as the competition continues to increase, the internal financial leverage ratio will decrease after the proportion of the asset specificity in the enterprise assets reaching a certain value.
Huang (2008) analyzed the relationship between asset specificity and capital structure, taking into account the difficulty of the measurement of assets specific indicators and the certainty of the selection of capital structure indicators. He chose the two indexes of the enterprise to measure the degree of asset specificity. One is the income generated by the main business accounting for the proportion of the total income of all the business. The other is the proportion of the intangible assets of all the assets of the enterprise. The measurement of the capital structure index is long-term liabilities/total assets, total liabilities/total assets, and finally the conclusions reached by the study are consistent with Williamson, that is, the relationship between the two is negatively correlated. Liu and Sun (2010) also supported this conclusion. Lei (2010) studied listed companies in the manufacturing industry in 2005-2006, and found that asset specificity of listed companies in China does not affect their capital structure. It can be seen that there are significant differences in the conclusions between literature on the relationship of asset specificity and capital structure. Empirical evidence found in Western countries cannot be directly applied to China. For listed companies in China, research on the correlation between asset specificity and capital structure must take into account of special factors of China’s economic operation and institutional background.
Based on the above research, this paper proposes the following hypothesis,
Hypothesis 2a, Asset specificity is negatively related to a company’s capital structure.
ownership for both sides, debt financing has evolved into an internal contract with a lower cost than the equity financing contract, and becomes a bureaucratic governance structure. To save transaction costs, state-owned listed companies with high asset specificity will choose debt financing. While the situation of private listed companies is different from that of state-owned listed companies, on the one hand, the high asset specificity level will increase the risk of huge potential loss of realized value, which makes it difficult to obtain credit capital. On the other hand, because debt financing may still have market governance function, the reverse adjustment of debt financing can save more transaction costs if the company has a higher asset specificity level. Therefore, the following hypothesis is made,
Hypothesis 2b, Among state-owned listed companies, asset specificity is positively related to the company’s capital structure.
Hypothesis 2c, In private listed companies, asset specificity is negatively related to the company’s capital structure.
2.3 Factors affecting corporate performance
Shen (2010) conducted an analysis of the factors affecting corporate performance, from the perspective of corporate financing structure, and concluded that the existence of long-term debt will affect enterprise performance. The long-term debt and the enterprise performance are negatively correlated. The relationship between the bank loans and the performance of enterprises is also negative. At the same time, the greater the size of bond financing, the more obvious the improvement of corporate performance.
Ren (2011) chose to conduct analysis from various aspects simultaneously, when analyzing the factors affecting enterprise performance. The result is that the factors inhibit the performance of the company include the intensity of board meetings and state-owned holdings. The managerial equity incentive is a factor which can promote the performance of enterprises. However, the institutional investors and independent directors are factors which not have an influence on business performance.
Zhou (2013) pointed out that the external governance environment is an important factor affecting the performance of enterprises. With the improvement of the external governance environment, the improvement of enterprise performance is more obvious, and if the government has excessive government involvement , it will have a serious impact on business Performance.
Mao and Yang (2014) selected A-share listed companies during the research. The results show that as the concentration of the company’s equity increases, the relationship between the actual controller’s interests and the company’s interests will be stronger. The actual controller makes efforts to better manage the business. Therefore, equity concentration will positively affect the company’s performance.
have various impact. But this cannot obtain the good or bad result of contrast. Thus, how to choose the financing method should also be based on the actual situation of the enterprise. Cheng et al. (2015) pointed out that if a company has a high degree of financial resource mismatch, it will not be able to invest more resources in research and development, so it will lead to a continuous decline in corporate performance.
Methodology and Empirical Research Design 3.1 Data Source and Sample Selection
The data are gathered from Wind database. Data of state-owned listed companies and private listed companies on A-share of Shanghai and Shenzhen Stock Exchange are selected. This paper excludes (1) listed companies in the financial industry. (2) listed companies with missing or imputed data. (3) ST listed companies and PT listed companies, If a listed company makes loss for two consecutive years, or makes loss for one year, and the net assets fall below the face value, or one of the major illegal acts occurs during the company’s operation, the stock exchange will deal with the company’s stock in a special way, that is, the ST system. For ST companies, if there are any further problems, such as continuing to lose money in the next year and meet the three-year loss limit in the Company Law, then PT processing will be carried out. After the screening described above, there are 550 listed companies with 3,300 observations. Among them, there are 229 state-owned listed companies with 1,374 firm-year observations, and 321 private listed companies with 1,926 annual observations.
3.2 Variable Selection
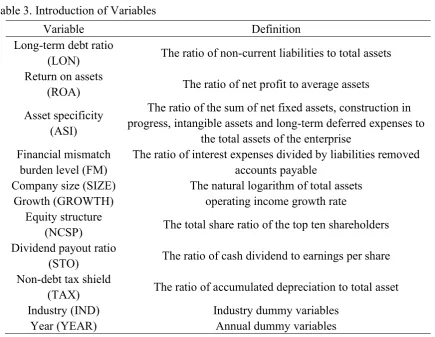
Table 3. Introduction of Variables
Variable Definition
Long-term debt ratio
(LON) The ratio of non-current liabilities to total assets Return on assets
(ROA) The ratio of net profit to average assets Asset specificity
(ASI)
The ratio of the sum of net fixed assets, construction in progress, intangible assets and long-term deferred expenses to
the total assets of the enterprise Financial mismatch
burden level (FM)
The ratio of interest expenses divided by liabilities removed accounts payable
Company size (SIZE) The natural logarithm of total assets
Growth (GROWTH) operating income growth rate
Equity structure
(NCSP) The total share ratio of the top ten shareholders Dividend payout ratio
(STO) The ratio of cash dividend to earnings per share Non-debt tax shield
(TAX) The ratio of accumulated depreciation to total asset
Industry (IND) Industry dummy variables
Year (YEAR) Annual dummy variables
3.3 Model
To test hypothesis 1, we build a model (1) as follows,
𝑅𝑂𝐴 = 𝛼 + 𝛼 𝐿𝑂𝑁 + 𝛼 𝐹𝑀 + 𝛼 𝐹𝑀 × 𝐿𝑂𝑁 + 𝛼 𝑆𝐼𝑍𝐸 + 𝛼 𝐺𝑅𝑂𝑊𝑇𝐻 + 𝛼 𝑁𝐶𝑆𝑃 + 𝛼 𝑅𝐸𝑆 + 𝛼 𝐼𝑁𝐷 + 𝛼 𝑌𝐸𝐴𝑅 + 𝜇 (1)
where α is the intercept term, α(i=1,2,3,4,5,6,7,8,9)is the regression coefficient of the model(1),μ is the random error term.
To test the hypothesis 2, we build the model (2) as follows,
𝐿𝑂𝑁 = 𝛽 + 𝛽 𝐴𝑆𝐼 + 𝛽 𝑅𝑂𝐴 + 𝛽 𝑆𝐼𝑍𝐸 + 𝛽 𝐺𝑅𝑂𝑊𝑇𝐻 + 𝛽 𝑁𝐶𝑆𝑃 + 𝛽 𝑅𝐸𝑆 + 𝛽 𝑇𝐴𝑋 + 𝛽 𝐼𝑁𝐷 + 𝛽 𝑌𝐸𝐴𝑅 + 𝛿 (2)
Empirical analysis
4.1 Descriptive statistics
In this paper, descriptive statistics are performed on the full sample and the subsample (as shown in Table 4).
The results of descriptive statistics show that the long-term debt ratio of state-owned listed companies (LON mean = 22.12%) is significantly higher than that of private listed companies (LON mean = 12.05%). In a sharp contrast, the rate of return on total assets of state-controlled listed companies (ROA = 7.23%) is significantly lower than that of private listed companies (ROA mean = 8.37%). For asset specificity level, state-controlled listed companies (ASI mean = 36.01%) is significantly higher than private listed companies (ASI mean = 30.90%). As shown in the descriptive statistics results, the level of financial mismatch burden of private listed companies (FM mean = 1. 2035) is significantly higher than that of state-owned listed companies (FM mean = 0.7148). In addition, there are also significant differences in firm size, growth and equity concentration, State-owned listed companies have larger average company size and higher equity concentration than private listed companies, while private listed companies have significantly higher average growth rate (GROWTH=19.00%) than state-owned listed companies (GROWTH=10.97%).
Table 4. Results of Descriptive Statistics
Variables
Total State-owned Private
T test (N=3300) (N=1374) (N=1926)
Mean Std.. Min Max Mean Std.. Min Max Mean Std.. Min Max T-value
ROA 0.0790 0.0491 -0.1252 0.4276 0.0723 0.0414 -0.1252 0.3805 0.0837 0.0534 -0.0802 0.4276 5.833***
LON 0.1624 0.1696 0.0000 0.7533 0.2212 0.1900 0.0002 0.7475 0.1205 0.1390 0.0000 0.7533 -16.750***
GROWTH 0.1565 0.2665 -0.5436 4.4291 0.1097 0.2276 -0.5418 3.8940 0.1900 0.2865 -0.5436 4.4291 9.525***
NCSP 0.5971 0.1523 0.1272 1.0116 0.6170 0.1535 0.1745 1.0116 0.5829 0.1499 0.1272 0.9559 -5.134***
ASI 0.3303 0.1904 0.0080 0.9265 0.3601 0.2215 0.0095 0.9265 0.3090 0.1615 0.0080 0.8570 -4.850***
FM 1.0000 2.1194 -0.9595 60.8417 0.7148 0.5945 0.0001 6.7000 1.2035 2.7104 -0.9595 60.8417 5.729***
STO 0.3651 0.4383 -0.5714 10.2041 0.3665 0.5432 -0.5000 10.2041 0.3640 0.3447 -0.5714 5.0000 0.226
SIZE 22.7019 1.3533 19.8104 28.5087 23.3615 1.4151 20.6897 28.5087 22.2314 1.0855 19.8104 26.6525 -23.620***
TAX 0.1197 0.1041 0.0017 0.6939 0.1407 0.1185 0.0037 0.6939 0.1048 0.0895 0.0017 0.6722 -9.017***
4.2 Empirical analysis of hypothesizes, based on panel data
The data used in this paper are short panel data. The unit root test results show that all variables appear to have no unit roots. Therefore, this paper does not need to do cointegration test for non-stationary economic variables.
For the selection of models, the fixed effect model is selected for regression analysis. For cross-sectional correlation testing, the test result shows that there is no cross-cross-sectional dependency in the panel data. For heteroskedasticity testing, the final result shows that the heteroskedasticity of the panel data collected in this paper is very significant. Therefore, this paper finally chooses the fixed effect model that controls heteroskedasticity. All the samples are winsorized.
4.2.1 Financial mismatch
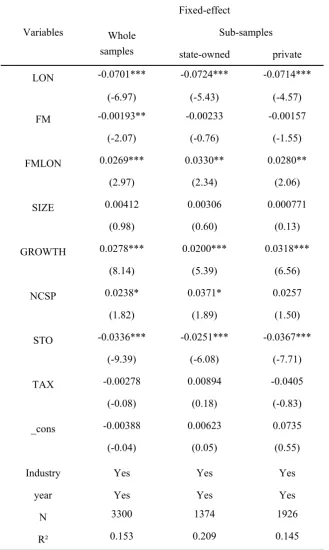
Table 5. Financial mismatch
Variables
Fixed-effect
Whole samples
Sub-samples
state-owned private
LON -0.0701*** -0.0724*** -0.0714***
(-6.97) (-5.43) (-4.57)
FM -0.00193** -0.00233 -0.00157
(-2.07) (-0.76) (-1.55)
FMLON 0.0269*** 0.0330** 0.0280**
(2.97) (2.34) (2.06)
SIZE 0.00412 0.00306 0.000771
(0.98) (0.60) (0.13)
GROWTH 0.0278*** 0.0200*** 0.0318***
(8.14) (5.39) (6.56)
NCSP 0.0238* 0.0371* 0.0257
(1.82) (1.89) (1.50)
STO -0.0336*** -0.0251*** -0.0367***
(-9.39) (-6.08) (-7.71)
TAX -0.00278 0.00894 -0.0405
(-0.08) (0.18) (-0.83)
_cons -0.00388 0.00623 0.0735
(-0.04) (0.05) (0.55)
Industry Yes Yes Yes
year Yes Yes Yes
N 3300 1374 1926
R² 0.153 0.209 0.145
t statistics in parentheses * p < .1, ** p < .05, *** p < .01
findings of Yu (2003) and Xiao (2005). In the sample of state-controlled listed companies, the long-term debt ratio and the return on total assets were significantly negatively correlated at the 1% significance level, indicating that there are also financial mismatches issues in state-controlled listed companies. The increase in liabilities significantly reduces the performance of the company. The increased claims of creditors encroach the surplus of the enterprise, and the allocation of debt capital pulls down the operating efficiency. In the sample of private listed companies, the long-term debt ratio and the return on total assets are also significantly negatively correlated at the level of 1%. The correlation coefficient is almost the same as that of state-owned listed companies, which reflects the level of financial mismatch of private listed companies is similar with state-owned companies. Listed companies with more debt capital even company with lower performance. The phenomenon of financial mismatch seriously affects the efficiency of financial resources.
The regression results partially support the hypothesis 1 of this paper, that is, the financial mismatch issue significantly exists in listed companies in China, but the level of financial mismatch of state-owned enterprises is not significantly higher than that of private enterprises. Meanwhile, the financial mismatch burden level (FM) of enterprises has a significant negative correlation with the return on total assets in the total sample, which is contrary to the research of Restuccia and Rogerson (2007) and Shao (2010). On the assumption of a fixed alternative elastic production function and the Cobb-Douglas production function, they point out that firm performance is positively related to the financial mismatch burden level that the company bears, because only high corporate performance can compensate for the premium in capital use costs. However, the regression results show that, on the contrary, the cost of capital use can negatively affect the performance of the company.
To reflect the financial mismatch issue and its economic consequences in listed companies further, this paper introduces the cross term (FM×LON) of long-term debt ratio and financial mismatch burden level. The regression results show that the cross term is significantly related to the return on total assets, that is, the impact of long-term debt ratio on total return on assets is constrained by the level of financial mismatch burden. In both the total sample and the subsample, the cross term has a significant positive correlation with the return on total assets. This reveals that in China’s listed companies, the higher the level of financial mismatch burden faced by enterprises, the more the increase in debt level can encourage listed companies to improve their financial performance to make up for the increase in the cost of use of funds, and to avoid default on debt contracts.
return on total assets of the enterprise, which is consistent with the research of Xu et al. (2006). The dividend payout ratio is significantly negatively correlated with the return on total assets. An excessive dividend payout rate will affect the performance of listed companies. The company should retain more profit for company development.
4.2.2 Asset Specificity and Capital Structure
Then, we do the same preliminary tests on model (2) as model (1). The result is same as model (1).
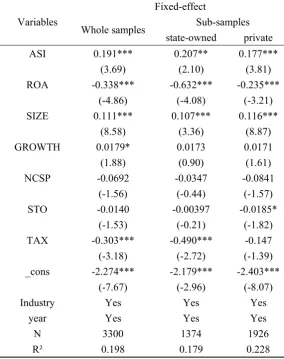
The model(2) regression results are shown as follows, Table 6. Asset Specificity and Capital Structure
Variables
Fixed-effect
Whole samples Sub-samples
state-owned private
ASI 0.191*** 0.207** 0.177***
(3.69) (2.10) (3.81)
ROA -0.338*** -0.632*** -0.235***
(-4.86) (-4.08) (-3.21)
SIZE 0.111*** 0.107*** 0.116***
(8.58) (3.36) (8.87)
GROWTH 0.0179* 0.0173 0.0171
(1.88) (0.90) (1.61)
NCSP -0.0692 -0.0347 -0.0841
(-1.56) (-0.44) (-1.57)
STO -0.0140 -0.00397 -0.0185*
(-1.53) (-0.21) (-1.82)
TAX -0.303*** -0.490*** -0.147
(-3.18) (-2.72) (-1.39)
_cons -2.274*** -2.179*** -2.403***
(-7.67) (-2.96) (-8.07)
Industry Yes Yes Yes
year Yes Yes Yes
N 3300 1374 1926
R² 0.198 0.179 0.228
t statistics in parentheses * p < .1, ** p < .05, *** p < .01
Asset specificity is also significantly positively correlated with long-term debt ratio at the 5% confidence level in the sample of state-controlled listed companies, which validates the hypothesis 2b. This can be explained as, on the one hand, when a creditor makes a credit decision on a state-controlled listed company, for the guarantee value of the asset, only the material properties will be taken into consideration, and its specificity will be ignored. This situation is also mentioned in the policy burden and budget soft constraint of China’s commercial banks proposed by Lin and Li (2004), which is, the non-marketization behavior of financial resources allocation. On the other hand, the financial mismatch that deviates from the market has changed the governance structure of debt financing. A high asset specificity can reduce transaction costs by adopting high debt financing instead.
In the sample of private listed companies, asset specificity and corporate long-term debt ratio still shows a significant positive correlation, which rejects e hypothesis 2c of this paper. In decision of making credit loan to private listed companies, creditors are considered to be more cautious about the company’s asset specificity in order to reduce risks. Therefore, debt financing will effectively maintain and play its role in market governance. This is in line with the basic logic of transaction cost economics, asset specificity acts on the capital structure through the governance structure attributes of different financing methods. However, the result of the regression is in opposite and reveals that increasing the asset specificity will not decrease the financial mismatch level of an enterprise.
In the full sample and the subsample, the relationship between the return on total assets and the long-term debt ratio is consistent with the regression results of the model (1). Listed companies with more debt capital company with lower performance instead. The phenomenon of financial mismatch seriously affects the efficiency of financial resources.
The size of the firm is positively correlated with the long-term debt ratio, indicating that companies with more assets and larger scales are more likely to obtain long-term borrowing. Growth is positively correlated with long-term debt ratios in both full and subsamples, but the correlation is not significant. The shareholding structure was negatively correlated with the long-term debt ratio in the full sample and the sub-sample, but the correlation is also not significant. The dividend payout ratio is significantly positively correlated with the long-term debt ratio in the sample of private enterprises, indicating that the more cash dividends allocated by private enterprises, the more surplus they may retain, and the lower the demand for financing term debt. The non-debt tax shield is significantly negatively correlated with the long-term debt ratio in the sample of the total sample and the state-controlled listed company. Companies with large non-debt tax shields use less debt than companies without non-debt tax shields, and non-debt tax shields can be used as a substitute for debt to reduce corporate tax burdens.
Table 7. Robustness check and further discussion
Variables PCSE System GMM
Seemingly Unrelated
Regression Three-stage
ROA LON ROA LON ROA LON ROA LON
L.LON -0.115*** 0.0212* 0.793*** -0.152*** -0.147***
(-6.07) (1.66) (17.58) (-16.70) (-15.66)
L.FM -0.00128*** -0.000847 -0.00127 -0.00211***
(-2.92) (-0.78) (-1.60) (-2.81)
L.FMLON 0.0373*** 0.00950 0.0407*** 0.0454***
(3.44) (0.78) (4.55) (5.01)
L.SIZE 0.00265 0.0715*** -0.0103*** -0.0301*** 0.00546*** 0.0702*** 0.00666*** 0.0648***
(1.63) (55.69) (-4.58) (-4.74) (6.61) (37.94) (7.93) (32.86)
L.GROWTH 0.0403*** 0.0667*** -0.00532 -0.0144 0.0418*** 0.0769*** 0.0391*** 0.0703***
(4.60) (3.86) (-1.38) (-1.41) (10.76) (6.84) (10.63) (6.58)
L.NCSP 0.0284*** -0.0584*** -0.0184 0.112*** 0.0253*** -0.0454*** 0.0188*** -0.0504***
(8.48) (-5.01) (-1.37) (2.80) (4.47) (-2.82) (3.47) (-3.27)
L.STO 0.00278 -0.0602*** 0.0325*** -0.0130 0.00136 -0.0642*** -0.00109 -0.0542***
(0.66) (-6.45) (8.32) (-1.17) (0.39) (-6.45) (-0.33) (-5.74)
L.TAX 0.0475*** -0.249*** 0.133*** 0.355*** 0.0492*** -0.226*** 0.0411*** -0.131***
(4.63) (-10.39) (4.47) (3.45) (5.61) (-7.19) (4.41) (-4.17)
L.ASI 0.253*** -0.202*** 0.243*** 0.236***
(26.85) (-4.71) (15.27) (13.62)
L.ROA -0.853*** 0.796*** -0.0207 -1.159*** -1.024***
(-10.24) (17.62) (-0.24) (-22.28) (-19.29)
_cons 0.00391 -1.393*** 0.229*** 0.685*** -0.0522*** -1.347*** -0.0854*** -1.270***
(0.12) (-60.34) (4.18) (4.59) (-2.93) (-32.23) (-4.23) (-25.21)
Industry Yes Yes Yes Yes Yes Yes
year Yes Yes Yes Yes Yes Yes
Sargon test Yes Yes
N 2750 2750 2750 2750 2750 2750 2750 2750
R2 0.127 0.459 0.117 0.117 0.254 0.254
t statistics in parentheses * p < .1, ** p < .05, *** p < .01
In three-stage model, the long-term debt ratio is significantly negatively correlated with the return on total assets at 1% significance level. The financial mismatch burden level (FM) of enterprises is significantly negatively correlated at the significance level of 1% in the full sample and the cross term (FM×LON) is significantly positively related to the return on total assets.
Asset specificity and long-term debt ratio were significantly positively correlated at the significance level of 1% in the full sample. The return on total assets and the long-term debt ratio were significantly negatively correlated at the significance level of 1%.
Conclusion and Policy Implications
According to the theoretical analysis of transaction cost economics, the capital structure works as a governance structure to save transaction costs, which can be affected by the asset specificity, The higher the asset specificity level of the enterprise, the lower the debt level should be. However, the financial mismatch issue will distort the governance structure nature of debt financing and thus affect the applicability of this conclusion of transaction cost economics in China. Based on the empirical data of A-share listed companies of China from 2012 to 2017, this paper finds that the phenomenon of financial mismatch is widespread in Chinese listed companies and is not related to the ownership of companies. The degree of financial mismatches of listed companies in China is based on the soft budget constraints and the degree of marketization. The corporate performance is significantly negatively correlated with the level of financial mismatch, which indicates financial mismatches severely restrict the efficiency of listed companies in China. The asset specificity of the listed company is positively correlated with the capital structure, and the higher the asset specificity level of the enterprise, the higher its debt level will be.
the loan process, improve the mortgage and secured loan business, provide “one-stop” service for mortgages and secured loans that meet the conditions, and appropriately reduce costs to ensure loan efficiency. At the same time, we are committed to improving the application of financial resources, accelerating financial product innovation, and enriching the types of banking services to meet the various needs of customers.
Third, accelerate the development of various financing channels and gradually improve the financial structure of indirect financing, the government should provide support in the process of listing enterprises; Supporting the development of small and medium-sized financial institutions. We should also encourage private capital to set up various forms of financial institutions such as microcredit, rural banks, etc; We should innovate in the form of bond issuance, commit to develop and build local bond markets, and guide and encourage powerful enterprises to issue bonds independently. Financial institutions should use reasonable channels and models to guide the integration of private stock currency funds into the bond issuance business and improve the utilization rate of private funds.
Fourth, improve the understanding of asset specificity. Listed companies should be encouraged to disclose asset-specific information to the market, especially those companies that rely heavily on asset specificity. Companies will raise loan easier if they provide more relevant information for stakeholders to understand the company’s capital structure. For internal, a company should pay attention to acquisitions and increase the level of its asset specificity. And give full play to the role of asset specificity in financing decisions.
Through the analysis of the existing research results, we found that the current research on financial resource mismatch still has the following problems,
1. Domestic research is mostly concentrated between state-owned enterprises and private enterprises, and less research on other aspects.
There are many forms of misallocation channels for financial resources. Financial resources are likely to be allocated to inefficient owned enterprises rather than highly efficient state-owned enterprises. For different regions, the mismatching of financial resources of state-state-owned enterprises and non-state-owned enterprises are not same; different industries will present different mismatches. It is also necessary to pay attention to the fact that the mismatch of financial resources has been initiated since the beginning of the process. Finance is the core sector of China’s national economy. Understanding the current state of financial development, making up for the shortcomings of financial development, and deepening financial development are crucial to China’s economic growth.
2.The mechanism of interaction between financial resource mismatch and economic growth still needs to be carefully scrutinized.
often produce different results, the current theory of financial resource mismatch does not achieve a more unified measurement. These issues require further research.
Besides, the research on the economic consequences of asset specificity in China is not fully carried out. Within the framework of new institutional economics, the theoretical analysis of the impact of asset specificity on capital structure in China’s special institutional context still needs to be deepened. In empirical research, it is still necessary to explore a more reasonable, effective and accurate method to measure asset specificity. Therefore, the research on the relationship between asset specificity and capital structure still needs to be further improved. References
Acemoglu D, Aghion P, & Zilibotti F. (2002). Distance to Frontier, Selection, and Economic Growth. Journal of the European Economic Association, 4(1), 37-74.
https://doi.org/10.1162/jeea.2006.4.1.37
Ayyagari, M., A. Demirguc-Kunt, & A. Maksimovic. (2008). Formal versus Informal Finance, Evidence from China. The Review of Financial Studies. https://doi.org/10.1596/1813-9450-4465
Ayyagari, Meghana,et al.(2011). Firm Innovation in Emerging Markets, The Role of Finance, Governance, and Competition. The Journal of Financial and Quantitative Analysis, 46(6), 1545-1580. https://doi.org/10.1017/S0022109011000378
Blackburn, Keith, Victor T Y Hung. (1998). A Theory of Growth, Financial Development and Trade. Economica, 65(257), 107-124. https://doi.org/10.1111/1468-0335.00116
Brandt, L., & H. Li. (2003). Bank Discrimination in Transition Economics, Ideology, Information, or Incentives? Journal of Comparative Economics, 31(3), 387-413.
https://doi.org/10.1016/S0147-5967(03)00080-5
Brown J R, Fazzari S M, & Petersen B C. (2009). Financing Innovation and Growth, Cash Flow, External Equity, and the 1990s R&D Boom. Journal of Finance, 64(1), 151-185.
https://doi.org/10.1111/j.1540-6261.2008.01431.x
Cheng H., (2004). Implicit contract, special investment and capital structure. China’s industrial economy, 8, 42-49. (Chinese)
Claessens S. & Laeven L. (2003). Financial development, property rights and growth. The Journal of Finance, (6).https://doi.org/10.1046/j.1540-6261.2003.00610.x
Dela Fuente,Angel, Marin,Jose Maria. (1996). Innovation, Bank Monitoring, and Endogenous Financial Development. Journal of Monetary Economics, 38(2), 269-301.
https://doi.org/10.1016/S0304-3932(96)01277-9
Dollar, D., & S. Wei. (2007). Das (Wasted) Kapital, Firm Ownership and Investment Efficiency in China. Working Paper, National Bureau of Economic Research.
Gorodnichenko Y, & Schnitzer M. (2013). Financial Constraints and Innovation, Why Poor Countries Don’t Catch UP. Journal of the European Economic Association, 11(5), 1115 -1152.
https://doi.org/10.1111/jeea.12033
Hsieh,Chang-Tai, & Peter J. Klenow. (2009). Misallocation and Manufacturing TFP in China and India. The Quarterly Journal of Economics, 124(4), 1403-1448.
https://doi.org/10.1162/qjec.2009.124.4.1403
Jaemin Cho & Jaeho Lee. (2013). The Venture Capital Certification Role in R&D: Evidence from IPO Underpricing in Korea. Pacific Basin Finance Journal, 23.
https://doi.org/10.1016/j.pacfin.2013.01.005
Ji Y. (2015). A review of research on financial resource mismatches. Management and Management, (8), 109-111. (Chinese)
King R G, Levine R. (1993). Finance and Growth, Schumpeter Might Be Right. The Quarterly Journal of Economics, 108(3), 717-37. https://doi.org/10.2307/2118406
Li J, Yan J. Fiscal decentralization, factor price distortion and excessive investment by state-owned enterprises. (2010). Journal of Zhongnan University of Economics and Law, 1, 78-83. (Chinese)
Li Q., Chen X. & Wang Y., (2007). Product market competition, asset specificity and capital structure. Financial Research, 2, 46-56. (Chinese)
Li Q, Li J, Jiang C, et al. (2013). Financial Development and Regional Entity Economic Capital Allocation Efficiency-Evidence from Provincial Industrial Sector Data. Economics (Quarterly), (2), 527-548. (Chinese)
Li Q. & Wang Y. (2006). Asset Specificity and Corporate Capital Structure, Empirical evidence from China Manufacturing Companies, Accounting Research, 7, 66-71. (Chinese) Lei X. (2010). Research on the specificity of corporate assets in China-the empirical proof from the listed companies in the manufacturing industry. Journal of Zhongnan University of Finance and Economics, 1,101-106. (Chinese)
Lin Y. & Li Z., (2004). Policy burden, moral hazard and budget soft constraints. Economic Research, 2,17-27. (Chinese)
Liu W, Zhou W, Zhong S, et al. (2014). Government intervention, capitalization process and quality of economic growth in financial development. Economist, (3), 64-73. (Chinese) Liu X, Zhou X. (2011). The Test of the Relationship between Financial Resources and the Real Economy-Concurrently on the Causes of Unbalanced Economic Structure. Financial Research, (2), 57-70. (Chinese)
Midrigin, Virgiliu, D Xu. (2014). Finance and Misallocation, Evidence from Plant-Level Data. American Economic Review, 104(2), 422-458. https://doi.org/10.1257/aer.104.2.422
Minkler, L., & J. Vilasuso. (2001). Agency Costs, Asset Specificity and Capital Structure of the Firm. Journal of Economic Behavior and Organization, 44(1), 55-69.
https://doi.org/10.1016/S0167-2681(00)00151-7
Mocnik, D. (2001). Asset Specificity and a Firm’s Borrowing Ability, an Empirical Analysis of Manufacturing Firms. Journal of Economic Behavior and Organization, 45(1), 69-81.
https://doi.org/10.1016/S0167-2681(00)00166-9
Moll, Benjamin. (2014). Productivity Losses from Financial Frictions, Can Self - Financing Undo Capital Misallocation? The American Economic Review, 104(10). 3186-3221.
https://doi.org/10.1257/aer.104.10.3186
Morales, Marí F A. (2001). Financial Intermediation in a Model of Growth Through Creative
Destruction. Macroeconomic Dynamics, 7(7), 363-393.
https://doi.org/10.1017/S1365100502020138
Saint-Paul G. (1992). Technological Choice, Financial Markets and Economic Development. European Economic Review, 36(4), 763-781. https://doi.org/10.1016/0014-2921(92)90056-3
Shao T. (2010). Financial Mismatch, Ownership Structure and Return on Capital, From 1999-2007 China’s Industrial Enterprise Research. Financial Research, 9, 51-68. (Chinese)
Shao T. (2010). Financial Mismatch, Ownership Structure, and Return on Capital, A Study of Industrial Enterprises in China from 1999 to 2007. Financial Research, (9), 51-68. (Chinese) Sun G, Song X. (2016). Financial liberalization, government intervention mechanism and enterprise innovation investment efficiency. Financial and Economics, (2), 47-55. (Chinese) Sun T, Wen J, Qin J. (2011). Financial Intermediary Development, Government Intervention and Enterprise Technology Innovation-Evidence from China’s Transitional Economy. Scientific and Technological Progress and Countermeasures, (20), 75-79.(Chinese)
Wang Y. & Fan M., (2004). Dynamic analysis of capital structure from the perspective of asset specificity. China’s industrial economy, 1,93-98. (Chinese)
Williamson, O. (1979). Transaction Cost Economics, the Government of Contractual Relations. Journal of Law and Economics, 22(2), 233-261. https://doi.org/10.1086/466942
Williamson, O. (1988). Corporate Finance and Corporate Governance. The Journal of Finance, 43(3), 567-591. https://doi.org/10.1111/j.1540-6261.1988.tb04592.x
Xiao Z. (2005). Empirical study on the interaction between capital structure and corporate performance of listed companies. Management Science, 3,16-22. (Chinese)
Yao Y, Dong G. (2015). Mitigation of SME financing constraints, Is the level of financial development important or the financial structure important? - Empirical evidence from SME board listed companies. Financial Research, (4), 148-161. (Chinese)
Yu D. (2003). Capital Structure, Creditor Governance and Corporate Performance, An Empirical Analysis. China’s industrial economy, 1, 87-94. (Chinese)
Zhang B, Huang H. (2009). Research on R&D Behavior of Enterprises Considering Government Intervention. Journal of Finance and Economics, (3), 9-14. (Chinese)
Zhang P. & Ma H., (2012). Lending constraints and resource mismatches - empirical evidence from China. Journal of Tsinghua University (Natural Science Edition), 9,1302-1308. (Chinese) Zhang W. (2004). Game theory and information economics. First Edition. Shanghai, Shanghai People’s Publishing House, 35-39. (Chinese)
Zhang W, Shen K. (2008). Fiscal Decentralization Reform, Local Government Behavior and Economic Growth. Jiangsu Social Sciences, (3), 56-62. (Chinese)