Geosci. Instrum. Method. Data Syst., 2, 79–83, 2013 www.geosci-instrum-method-data-syst.net/2/79/2013/ doi:10.5194/gi-2-79-2013
© Author(s) 2013. CC Attribution 3.0 License.
EGU Journal Logos (RGB)
Advances in
Geosciences
Open Access
Natural Hazards
and Earth System
Sciences
Open Access
Annales
Geophysicae
Open Access
Nonlinear Processes
in Geophysics
Open Access
Atmospheric
Chemistry
and Physics
Open Access
Atmospheric
Chemistry
and Physics
Open Access
Discussions
Atmospheric
Measurement
Techniques
Open Access
Atmospheric
Measurement
Techniques
Open Access
Discussions
Biogeosciences
Open Access Open Access
Biogeosciences
DiscussionsClimate
of the Past
Open Access Open Access
Climate
of the Past
Discussions
Earth System
Dynamics
Open Access Open Access
Earth System
Dynamics
Discussions
Geoscientific
Instrumentation
Methods and
Data Systems
Open Access
Geoscientific
Instrumentation
Methods and
Data Systems
Open Access
Discussions
Geoscientific
Model Development
Open Access Open Access
Geoscientific
Model Development
Discussions
Hydrology and
Earth System
Sciences
Open Access
Hydrology and
Earth System
Sciences
Open Access
Discussions
Ocean Science
Open Access Open Access
Ocean Science
DiscussionsSolid Earth
Open Access Open Access
Solid Earth
Discussions
The Cryosphere
Open Access Open Access
The Cryosphere
DiscussionsNatural Hazards
and Earth System
Sciences
Open Access
Discussions
Evaluation of positioning and density profiling accuracy of muon
radiography by utilizing a 15-ton steel block
H. K. M. Tanaka
Earthquake Research Institute, the University of Tokyo, Tokyo, Japan
Correspondence to: H. K. M. Tanaka ([email protected])
Received: 29 June 2012 – Published in Geosci. Instrum. Method. Data Syst. Discuss.: 21 August 2012 Revised: 8 January 2013 – Accepted: 16 January 2013 – Published: 18 February 2013
Abstract. A model experiment was performed in order to evaluate the spatial resolution and the accuracy of determin-ing the density by utilizdetermin-ing a steel block. The steel block (7.8 g cm−3) is 5 m thick along the muon trajectories and weighs about 15 t. By comparing the experimental result with simulations, the density and the width of the steel block were measured as 7.3±1.0 g cm−3and 37±15 cm, respectively.
1 Introduction
Muon radiography was first proposed to determine a thick-ness of a rock overburden of a horizontal tunnel in the Snowy Mountains in Australia (George, 1955). He measured the flux inside and outside the tunnel of muons from cosmic ray in-teractions in the atmosphere and compared them to confirm that a reduction in the muon flux reflects the thickness of the overburden. In his experiment, he compared the muon data with the core sampling data, and concluded that they were consistent within error bars of∼10 %.
When applied to a volcano, the method measures the ab-sorption of muons in the volcano projected to the plane of the detector along all muon paths. The amount of energy lost by muons while passing through matter is dependent on the density of that matter. The resultant angular distribution of the muons can then be used to calculate the density profile of the target volume. The change in the muon angle after they pass through a substantial mass is very small (12 mrad for SiO2with a thickness of 1.5 km). Muon radiography conse-quently constitutes a unique way to obtain direct information on the density distribution of geological objects with accu-racy in terms of spatial resolution that is superior to that pos-sible using conventional geophysical techniques.
The muon is the most abundant of the charged elemen-tary particles at sea level and is capable of traveling large distances through matter. They arrive at angles ranging from the vertical to the horizontal with an integral inten-sity of 70 m−2s−1sr−1 at sea level. Thus, in order to per-form cosmic-ray muon radiography, one makes use either of muons coming from above the structure to be investigated by a detector underneath it, or by quasi-horizontal muons with the detector placed sideways. Since George’s first muon ra-diography, researchers have been attempting to image pyra-mids (Alvarez et al., 1970), ore bodies (Malmqvist et al., 1979), volcanoes (Tanaka et al., 2007, 2008; Lesparre et al., 2012), seismic faults (Tanaka et al., 2011), caves (Caffau et al., 1997), and archaeological sites (Basset et al., 2006; Menichelli et al., 2007) radiographically using cosmic-ray muons. However, accuracy in positioning and determining the density has not been quantitatively estimated. In this work, these important parameters have been evaluated by us-ing a large steel block whose density and geometry are both well known.
2 Muon detector
80 H. K. M. Tanaka: Evaluation of positioning and density profiling accuracy of muon radiography
14 1
Figures 2
3
Fig.1. Schematic view of the experimental setup (a) and a photograph of a 15-ton steel 4
block (b). 5
6
7
Fig. 2. Muon events as a function of azimuth angles counted within different elevation 8
Fig. 1. Schematic view of the experimental setup (a) and a photograph of a 15-t steel block (b).
signals can be treated collectively, and the single scintillator strips do not have to be read out as separate units. Although it is difficult to continue observations when one MAPMT breaks because the detector consists of an integrated com-bination of scintillators and MAPMTs, its construction can be more robust and better suited for an outdoor environment. In this work, a segmented muon detection system (Tanaka et al., 2009) was utilized. The system consists of plastic scintillator strips, PMTs, and readout electron-ics. The size of scintillator strip (Bicron BC-408) is 30 cm (L)×2.5 cm (W)×1.5 cm (H). The plane contains 24 plas-tic scintillator strips arranged in two arrays along thex and y coordinates, to determine the hit point in the plane by the coincidence of the signals fromx−y scintillator strips; the coincidences are registered in a matrix of 12×12 ele-ments. The total area of the plane is 0.09 m2, and the unit weighs∼10 kg. A slot (2 mm in depth and 2 mm in width) in the plastic scintillator contains a wavelength-shifting (WLS) fiber with a diameter of 1 mm (Bicron BCF-91A). The fiber converts purple scintillation light (wavelength ∼420 nm) into green light (wavelength∼500 nm), and conveys the op-tical signal to an MAPMT. The WLS fiber transmits light with minimal attenuation, because there is a clad layer out-side it. The end of the fiber is held by a black colored holder; black silicon rubber is affixed between the fiber and the fiber holder to prevent light leakage. The fiber holder and the MAPMT (HAMAMATSU H8500) are fastened together with light shielding tape. The H8500 MAPMT has 64 anode pixels. While the quantum efficiency of the PMT is 24 % for standard scintillation light, the quantum efficiency is 14 % for the light emitted from the WLS fiber. The quantum effi-ciency of light emitted from a WLS fiber is therefore 57 % compared with that of the usual scintillation light.
When supplied by 870 V electric voltage, the typical peak of the pulse height output from the MAPMT was 80 mV, and the pulse width was 2 ns. We measured the total elec-tric power consumption by using a power meter (HIOKI 3334 AC/DC POWER HiTESTER) and found that it was 9 W including the power consumption by the electronics.
3 Model experiment
H. K. M. Tanaka: Evaluation of positioning and density profiling accuracy of muon radiography 81
14 1
Figures 2
3
Fig.1. Schematic view of the experimental setup (a) and a photograph of a 15-ton steel 4
block (b). 5
6
7
Fig. 2. Muon events as a function of azimuth angles counted within different elevation 8 Fig. 2. Muon events as a function of azimuth angles counted
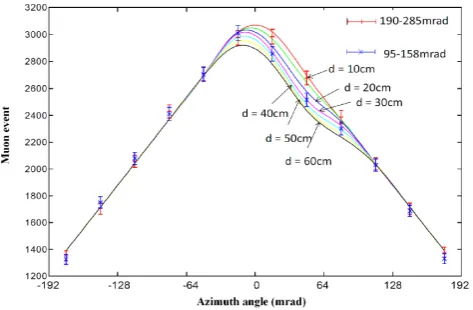
within different elevation angle regions (95< θ <158 mrad and 190< θ <285 mrad). Monte Carlo simulation results for different uniform densities (0, 5, 7.9, 10 and 13 g cm−3) are overlaid on the data.
(1θint−1θres)2/1θint2 = 0.32. The muon data were compiled and analyzed by a network-based FPGA (field programmable gate array) muon readout electronics (Uchida et al., 2010). The FPGA works on a 50-MHz system clock. The event filter (which selects events that can be used to construct the muon paths and generates path information), the histogram gener-ator, and the network processor are implemented on the sin-gle FPGA. The PMT signals analyzed in the FPGA chip are recorded in a number of bins representing the azimuth and el-evation arriving angles of cosmic ray muons. The data were read by the network processor when a remote PC accessed the electronics. The observation period was one month.
In order to compare the experimental result with simula-tions, we performed Monte Carlo simulations by taking the following steps.
1. 3-D geometrical information of the steel block was used to obtain the path length in the direction ofθ andϕ, as seen from the muon detector by constructing a virtual detection system on a computer.
2. We generated random numbers, and using these num-bers we generated muons adapted to the energy distri-bution obtained by Eq. (1).
3. The generated muons were injected into a steel block with a thickness ofX(m) in order to calculate the stop-ping length of the muons in the target by using Geant4 (Agostinelli et al., 2003), and a tableN (θ, X)was con-structed to represent the data.
4. By using the result of (1) and (3), we calculated the number of muons during a 30-day measurement period counted in direction ofθandϕ.
15
angle regions (95 < < 158 mad and 190 < <285 mrad). Monte-Carlo simulation 1
results for different uniform densities (0, 5, 7.9, 10 and 13 g/cm3) are overlaid on the 2
data. 3
4
5
Fig. 3. Muon events as a function of azimuth angles counted within different elevation 6
angle regions (95 < < 158 mad and 190 < <285 mrad). Monte-Carlo simulation 7
results for various widths (10, 20, 30, 40, 50 and 60 cm) of the steel block are overlaid 8
on the data. 9
10
Fig. 3. Muon events as a function of azimuth angles counted within different elevation angle regions (95< θ <158 mrad and 190< θ <285 mrad). Monte Carlo simulation results for various widths (10, 20, 30, 40, 50 and 60 cm) of the steel block are over-laid on the data.
4 Results and discussions
The result of a 30-day measurement period is shown in Fig. 2. The numbers of muon events counted within the differ-ent elevation angular regions of 95 mrad< θ <158 mrad and 190 mrad< θ <285 mrad are plotted with bars and crosses respectively. The whole area of the detection system is sensi-tive to muons that arrive near horizontally, but the system does not catch all the muons that enter at large angles to the horizontal. As shown in Fig. 2, the system has a geo-metrical acceptance, which can be used to correct the hor-izontal distributions of muons. In this figure, the geometri-cal acceptance was corrected for the elevation angles. The muons with angles 190–285 mrad have not passed through the block, while those with angles 95–158 have. The plots for 190 mrad< θ <285 mrad show the data without a target object, and the results confirmed the integral muon intensity as can be calculated by Eq. (1). For 95 mrad< θ <158 mrad, significant decreases in events can be seen betweenϕ= 0 and 66 mrad, primarily due to increases in the average density along the muon paths coming from an existence of the steel block.
82 H. K. M. Tanaka: Evaluation of positioning and density profiling accuracy of muon radiography
with the simulation results for different widths of the steel block, which ranges from 10 to 60 cm, the width was deter-mined as 37±15 cm at a 1σ confidence level.
The standard deviation was computed by assuming Pois-sonian statistics (Lesparre et al., 2010). Therefore, the stan-dard deviation can be significantly reduced by making mea-surements over a longer period. Also, the accuracy will be improved when the target is thicker and adequate statis-tics is available (Fig. 4). Since the average energy of quasi-horizontal muons ranges from 10 to 30 GeV, the accuracy will be improved when the target size is slightly bigger than that used in this work (the range of 30-GeV muons is 150 hg cm−2in iron). This is consistent with an uncertainty of 0.2 g cm−3that is announced for a measurement period of 45 days (Nagamine et al., 2005).
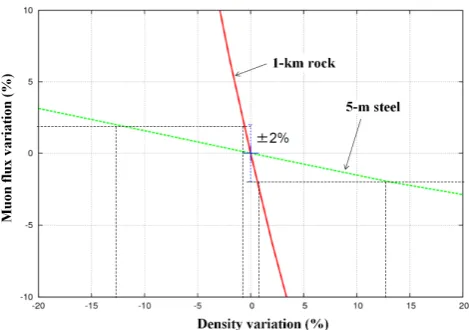
In this experiment, the density of the steel block was de-termined as 7.3±1.0 g cm−3; therefore, the accuracy in de-termining the density is 13 %. The typical energy of muons at sea level is 3–4 GeV, sufficient to penetrate meters of steel block. Most of the muons go through the steel block, and thus the absorption rate is not very sensitive to the target den-sity. However, a similar experiment with 1 km rock and ade-quate statistics gives a more accurate result. Figure 4 shows a simulation result of the sensitivity of the muon transmission rate to the target density for different path lengths. The sim-ulation compares the transmission rate between a 1-km rock (ρ= 2 g cm−3) and a 5-m steel block (ρ= 7.9 g cm−3). Since the low energy muon flux is screened by the target volume, the density can be more precisely determined for a thicker target. The statistical error in the measured number of muons in the present experiment was±2 %. For this variation, we can calculate that the accuracy in determining the density of 1 km of rock is±1 %, whereas that for a 5-m steel block is ±13 %.
Although the low density found for the steel block (7.3 in-stead of 7.8 g cm−3) is within the error, it is possibly at-tributed to background noise due to fake tracks produced by the accidental coincidences of vertical electromagnetic shower particles. Such events are likely to occur in a two-plane system as used in the experiments in this work. This effect has to be considered when the target size is larger.
The RMS angular resolution of the present system is (1θres,1ϕres=±14 mrad,±14 mrad) at an angular interval of 33 mrad. The minimum resolvable distance (MRD) (spa-tial resolution 1Xres, 1Yres) at the target volume (in this case, an Fe block) is defined by the minimum resolvable angle of the detector (in this case, the RMS angular reso-lution) (1θres1ϕres) and the distance between the target and the detector (R): (1Xres, 1Yres) =R×(1θres, 1ϕres). The spatial interval (1Xint, 1Yint) at the target volume is de-fined by the angular interval of the detector (1θint1ϕint) and the distance between the target and the detector (R): (1Xint, 1Yint) =R×(1θint,1ϕint). Therefore we expect that the the-oretical MRD will be ±7.0 cm with a spatial interval of 16.5 cm in the present case. In this work, the actual minimum
16 1
Fig. 4. Simulation results of the sensitivity of the muon transmission rate to the target 2
density for different path lengths. 3
Fig. 4. Simulation results of the sensitivity of the muon transmission rate to the target density for different path lengths.
resolvable distance (1X= 15 cm) was measured between the theoretical MRD and the spatial interval:
1Xres < 1X < 1Xint. (1)
Equation (1) confirms that the theoretical MRD (RMS an-gular resolution) of the segmented muon detection system approximately equals the actual MRD (or spatial resolution) at the target. Tanaka et al. (2007, 2008, 2009, 2011) and Lesparre et al. (2012) used one half of the spatial interval as the minimum resolvable distance. They both used a seg-mented muon detection system. Their approaches were vali-dated by this work.
5 Conclusions
The accuracy of positioning and determining densities in muon radiography was first quantitatively evaluated by utiliz-ing a steel block. In the present experiment, we measured an accuracy of 13 % in determining the density of a steel block with a length of 5 m, and based on this value we confirmed that the accuracy will be improved to 1 % when the target is a rock with a thickness of 1 km and adequate statistics is available. Also, we confirmed that the positioning resolution depends on the angular resolution of the detection system.
Acknowledgements. The experiment was supported by a
collabora-tive research between Nippon Steel Corporation and University of Tokyo. Analysis and simulation works greatly benefited from the skill and expertise of Hideaki Taira. The manuscript benefited from useful comments provided by T. Hurst, D. Gibert, and anonymous reviewers.
H. K. M. Tanaka: Evaluation of positioning and density profiling accuracy of muon radiography 83
References
Agostinelli, S., Allison, J., Amako, K., Apostolakis, J., Araujo, H., Arce, P., Asai, M., Axen, D., Banerjeel, S., Barrand, G., Behner, F., Bellagamba, L., Boudreau, J., Broglia, L., Brunengo, A., Burkhardt, H., Chauvie, S., Chuma, J., Chytrace, R., Coop-erman, G., Cosmo, G., Degtyarenko, P., Dell’Acqua, A., De-paola, G., Dietrich, D., Enami, R., Feliciello, A., Ferguson, C., Fesefeldt, H., Folger, G., Foppiano, F., Forti, A., Garelli, S., Giani, S., Giannitrapani, R., Gibin, D., G´omez Cadenas, J. J., Gonz´alez, I., Gracia Abril, G., Greeniaus, G., Greiner, W., Grichine, V., Grossheim, A., Guatelli, S., Gumplinger, P., Hamatsu, R., Hashimoto, K., Hasui, H., Heikkinen, A., Howard, A., Ivanchenko, V., Johnson, A., Jones, F. W., Kallenbach, J., Kanaya, N., Kawabata, M., Kawabata, Y., Kawaguti, M., Kelner, S., Kent, P., Kimura, A., Kodama, T., Kokoulin, R., Kossov, M., Kurashige, H., Lamanna, E., Lamp´en, T., Lara, V., Lefebure, V., Lei, F., Liendl, M., Lockmanj, W., Longo, F., Magni, S., Maire, M., Medernach, E., Minamimoto, K., Mora de Freitas, P., Morita, Y., Murakami, K., Nagamatu, M., Nartallo, R., Nieminen, P., Nishimura, T., Ohtsubo, K., Okamura, M., O’Neale, S., Oohata, Y., Paech, K., Perl, J., Pfeiffer, A., Pia, M. G., Ranjard, F., Rybin, A., Sadilov, S., Di Salvo, E., Santin, G., Sasaki, T., Savvas, N., Sawada, Y., Scherer, S., Sei, S., Sirotenko, V., Smith, D., Starkov, N., Stoecker, H., Sulkimo, J., Takahata, M., Tanaka, S., Tcherni-aev, E., Safai Tehrani, E., Tropeano, M., Truscott, P., Uno, H., Urban, L., Urban, P., Verderi, M., Walkden, A., Wander, W., We-ber, H., Wellisch, J. P., Wenaus, T., Williams, D. C., Wright, D., Yamada, T., Yoshida, H., and Zschiesche, D.: Geant4-a simula-tion toolkit, Nucl. Instrum. Meth. A, 506, 250–303, 2003. Allkofer, O. C., Carstensen, K., Dau, W. D., Jokisch, H., Klemke,
G., Oren, Y., and Uhr, R. C.: Muon Spectra from DEIS up to 7 TeV, Proc. of 17th Cosmic Ray Conf., Paris, France, 10, p. 321, 1981.
Alvarez, L. W., Anderson, J. A., Bedwei, F. E., Burkhard, J., Fakhry, A., Girgis, A., Goneid, A., Hassan, F., Iverson, D., Lynch, G., Miligy, Z., Mousaa, A. H., Sharkawi, M., and Yazolinio, L.: Search for hidden chambers in the pyramids, Science, 167, 832– 839, 1970.
Ambrosi, G., Ambrosino, F., Battiston, R., Bross, A., Callier, S., Cassese, F., Castellini, G., Ciaranfi, R., Cozzolino, F., D’Alessandro, R., de La Taille, C., Iacobucci, G., Marotta, A., Masone, V., Martini, M., Nishiyama, R., Noli, P., Orazi, M., Parascandolo, L., Parascandolo, P., Passeggio, G., Peluso, R., Pla-Dalmau, A., Raux, L., Rocco, R., Rubinov, P., Saracino, G., Scarpato, G., Sekhniaidze, G., Strolin, P., Tanaka, H. K. M., Tanaka, M., Trattino, P., Uchida, T., and Yokoyamao, I.: The MU-RAY project: Volcano radiography with cosmic-ray muons, Nucl. Instrum. Meth. A, 628, 120–123, 2011.
Basset, M., Ansoldi, S., Bari, M., Battiston, R., and Blasko, S.: MGR: An innovative, low-cost and compact cosmic-ray detec-tor, Nucl. Instrum. Meth. Phys. Res. A, 567, 298–301, 2006. Caffau, E., Coren, F., and Giannini, G.: Underground cosmic-ray
measurement for morphological reconstruction of the “Grotta Gigante” natural cave, Nucl. Instrum. Meth. Phys. Res. A, 385, 480–488, 1997.
George, E. P.: Cosmic rays measure overburden of tunnel, Com-monwealth Engineer, Tait/Melbourne, 455–457, 1955.
Lesparre, N., Gibert, D., Marteau, J., D’eclais, Y., Carbone, D., and Galichet, E.: Geophysical muon imaging: feasibility and limits, Geophys. J. Int., 183, 1348–1361, 2010.
Lesparre, N., Gibert, D., Marteau, J., Komorowski, J., Nicolin, F., and Coutant, O.: Density muon radiography of La Soufri`ere of Guadeloupe volcano: comparison with geological, electrical resistivity and gravity data, Geophys. J. Int., 190, 1008–1019, doi:10.1111/j.1365-246X.2012.05546.x, 2012.
Malmqvist, L., Jonsson, G., Kristiansson, K., and Jacobsson, L.: Theoretical studies of in-situ rock density determination using cosmic-ray muon intensity measurements with application in mining geophysics, Geophysics, 44, 1549–1569, 1979.
Matsuno, S., Kajino, F., Kawashima, Y., Kitamura, T., Mitsui, K., Muraki, Y., Ohashi, Y., Okada, A., Suda, T., Minorikawa, Y., Kobayakawa, K., Kamiya, Y., Nakamura, I., and Takahashi, T.: Cosmic-ray muon spectrum up to 20 TeV at 89◦ zenith angle, Phys. Rev. D, 29, 1–23, 1984.
Menichelli, M., Ansoldi, S., Bari, M., Basset, M., and Battiston, R.: A scintillating fibres tracker detector for archaeological applica-tions, Nucl. Instrum. Meth. Phys. Res. A, 572, 262–265, 2007. Nagamine, K., Tanaka, H. K. M., Nakamura, S. N., Ishida, K.,
Hashimoto, M., Shinotake, A., Naito, M., and Hatanaka, A.: Probing the inner structure of blast furnaces by cosmic-ray muon radiography, P. Jpn. Acad. B-Phys., 81, 257–260, 2005. Tanaka, H. K. M., Nakano, T., Takahashi, S., Yoshida, J., Takeo, M.,
Oikawa, J., Ohminato, T., Aoki, Y., Koyama, E., Tsuji, H., and Niwa, K.: High resolution imaging in the inhomogeneous crust with cosmic ray muon radiography: The density structure below the volcanic crater floor of Mt. Asama, Japan, Earth Planet. Sc. Lett., 263, 104–113, 2007.
Tanaka, H. K. M., Nakano, T., Takahashi, S., Yoshida, J., Takeo, M., Oikawa, J., Ohminato, T., Aoki, Y., Koyama, E., Tsuji, H., Ohshima, H., Maekawa, T., Watanabe, H., and Niwa, K.: Radio-graphic imaging below a volcanic crater floor with cosmic-ray muons, Am. J. Sci., 308, 843–850, 2008.
Tanaka, H. K. M., Uchida, T., Tanaka, M., Shinohara, H., and Taira, H.: Cosmic-ray muon imaging of magma in a conduit: De-gassing process of Satsuma-Iwojima Volcano, Japan, Geophys. Res. Lett., 36, L01304, doi:10.1029/2008GL036451, 2009. Tanaka, H. K. M., Miyajima, H., Kusagaya, T., Taketa, A., Uchida,
T., and Tanaka, M.: Cosmic muon imaging of hidden seismic fault zones: Rainwater permeation into the mechanical fractured zones in Itoigawa-Shizuoka Tectonic Line, Japan, Earth Planet. Sc. Lett., 306, 156–162, 2011.