B
B
O
O
O
O
T
T
S
S
T
T
R
R
A
A
P
P
P
P
I
I
N
N
G
G
S
S
U
U
P
P
E
E
R
R
V
V
I
I
S
S
E
E
D
D
C
C
L
L
A
A
S
S
S
S
I
I
F
F
I
I
E
E
R
R
P
P
A
A
R
R
A
A
D
D
I
I
G
G
M
M
O
Ol
lo
oy
ye
ed
de
e
I
I.
.
Department of Statistics, University of Ilorin
Corresponding Author: Oloyede I., [email protected] ABSTRACT: The study investigates the classification of
learning algorithms in a bootstrap paradigm, the study examined features classification with binary class attributes in a bootstrap paradigm. Support Vector Machine, k-Nearest Neighbour, Random Forest, rpart, Artificial Neural Network and Naïve Bayes learning algorithms were compared. Accuracy, Prediction error, Sensitivity and Specificity were used as assessment criteria of the classifier after tuning to have minimum cost. The study therefore sample the training set and classifying each of the training set, the summary of the prediction error was obtained based on the testing dataset, the study showed that artificial neural network outperformed other learning algorithms with respect to accuracy criterion whereas the celebrated support vector machine performed poorly amongst the learning algorithms considered, the study depicted that artificial neural network outperformed other learning algorithms with the least misclassification error. The study depicted that K nearest neighbour outperformed other learning algorithms with highest sensitivity while ANN outperformed other learning algorithms with highest specificity. This study affirmed that there would be need to use more than a learning algorithm when there are irrelevant features in the data sets.
KEYWORDS: SVM, Naïve Bayes, Bootstrap, Classification and learning algorithms.
1. INTRODUCTION
In an attempt to elicit information from the data, estimation, detection and classification approaches are the tools commonly used by the research. Classification is one of the technique used to elicit information from the data in the way in which objects of features are separated into classes particularly when the dependent variable is categorical either binary or multiclass, Ahmad et. al ([AIM13]). The classification algorithms occur in the phases of learning algorithm which examine model for the class attribute as function of the features (independent variable) of the datasets, which adopted training dataset whereas the second aspect is to apply the designed model in the first part to the new dataset (testing) so as to determine the related class of each of the features Tan et. al ([TSK06]).
Classification had been applied to many fields such as sciences, education, engineering as a way of pattern
recognition and visualization of datasets based on the class attribute, Li and Jain ([LJ98]) pointed out that naïve Bayes and subspace method outperformed nearest neighbour, decision tree in their document classification experiment, naïve Bayes outperformed others learning algorithm in testing dataset1 whereas subspace method outperformed others algorithm in the testing dataset2.
though when they were integrated they overperformed one another using accuracy, specificity, sensitivity and positive predicted value criteria. Abhisek ([Abh17]) compared different learning algorithms which were used to classify the heart disease correctly with different performance metrics and concluded that Artificial Neural Network and Support Vector Machine were the best learning algorithms for the heart disease dataset. Having examined series of literature, this study therefore seeks to investigate the comparison of learning algorithms in a bootstrap paradigm where moderate Multicollinearity exists amongst some irrelevant features.
2. MATERIAL AND METHODS
In an alternative to cross validation which seems to be cumbersome and complicated bootstrap proved to be best technique for the learning algorithms. This study therefore adopted bootstrap technique to validate the learning algorithms compared. In an
attempt to have unique result we set the seed to 1223, thus 1000 iterations were adopted in the bootstrap paradigm. We reported the average of the accuracy, misspecification error of prediction, sensitivity and specificity. The whole iteration is depicted in the graphs displayed for each learning algorithms. The model was examined on the bootstrapped training datasets while the prediction was examined on the bootstrapped testing datasets so as to validate the learning algorithms and make reasonable comparisons.
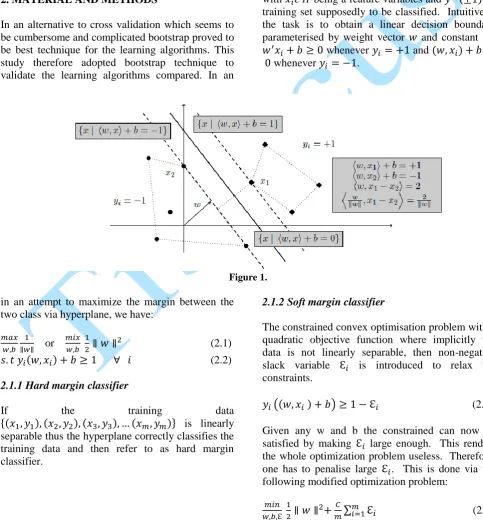
2.1. Support Vector Classification
Let where with being a feature variables and be training set supposedly to be classified. Intuitively, the task is to obtain a linear decision boundary parameterised by weight vector and constant
whenever and whenever .
Figure 1.
in an attempt to maximize the margin between the two class via hyperplane, we have:
or
(2.1)
(2.2)
2.1.1 Hard margin classifier
If the training data
is linearly separable thus the hyperplane correctly classifies the training data and then refer to as hard margin classifier.
2.1.2 Soft margin classifier
The constrained convex optimisation problem with a quadratic objective function where implicitly the data is not linearly separable, then non-negative slack variable is introduced to relax the constraints.
(2.3) Given any w and b the constrained can now be satisfied by making large enough. This renders the whole optimization problem useless. Therefore, one has to penalise large . This is done via the following modified optimization problem:
(2.5) (2.6)
where is a penalty parameter. The resultant classifier is said to be a soft margin classifier. By introducing non-negative Lagrange multiplier and
one can write the Lagrangian.
(2.7)
Then differentiate with respect to , , and set them to zero
, + =1 (2.8)
, (2.9)
(2.10)
(2.11)
, =1 (2.12)
(2.13) (2.14) (2.15)
, =1 (2.16)
(2.17) (2.18) (2.19) (2.20)
Substituting into the Lagrangian and simplifying yields the dual objective function.
(2.21) (2.22) (2.23) (2.24) (2.25) (2.26) Recall that therefore we have
(2.27)
There is need maximized the objective function with respect to which is equivalent to minimization as expressed below. Recall that and and .
(2.28) (2.29)
(2.30)
By the KKT conditions (Section 3.3) we have
(2.31)
The study considered two cases for and the implications of the KKT condition
2.2. NeuralNetworks
A neural network is a two stage regression or classification model, typically represented by a network diagram. For K-class classification, there are K units at the top, with the kth unit modelling the probability of class k. There are K target measurements Yk, k=1…, each being coded as a 0-1
variable for the kth class
Derived features Zm are created from linear
combinations of the inputs, and then the target Ym is modelled as a function of linear combinations of the inputs, and then the target Yk is modelled as a
function of linear combination of the Zm
(2.32)
(2.33)
Where
(2.35)
2.3. K-NearestNeighborClassifier
KNN is a learning algorithm that makes predictions on the model using the testing dataset by making new instance, this is achieved by searching through the whole training dataset for the K most similar instances which is regarded as the neighbors and summarizing the output variables for those set of k instances. Euclidean distance is the tool used to determine the K instances in the training dataset that is most similar to a new input. The Euclidean distance is obtained as . for the uniformity of the values of the distances, the features in the training dataset is standardized as
(2.36)
2.4. Naïve–BayesClassifier
Naïve Bayes classifier or idiot Bayes in a learning algorithms which uses the Bayes theorem to classify the dataset into model attributes and it assumed that the probability of certain feature is totally independent of another feature Ethan (2010). Bayes theorem can be expressed as
and it provides the means through which the probability of the hypothesis can be obtained given the prior knowledge about the problem.
2.5. Random Forest
This is a classifier that consists of a collection of decision trees, where each tree is constructed by applying an algorithm A on the training dataset S and an additional random vector θ where θ is sampled i.i.d from some distribution. The prediction of the random forest is obtained by a majority vote over the predictions of the individual trees. Random K data points are selected from the training dataset, then a decision tree is built for the selected K data points. Thereafter, the Ntree subset are selected from the trees, finally, result on the basis of the majority of votes is decided Shai and Shai (2014) and Abhisek (2017).
3. DATA GENERATION PROCESS
Artificial dataset of low dimensional was generated, the main focus is to assess various learning
algorithms in a way to classify training datasets in to binary class attribute subject to the redundancy in the dataset generated. The dataset was partitioned into training dataset which was used to fit the model for all the learning algorithms and the testing dataset which was used to predict the model for all the learning algorithms at the ratio of 80:20 (training:testing) respectively. 10 dimensions were redundant with moderately collinear, the probability of class attribute of y=1 or -1 was set to be equal. The first three features’ were drawn from uniform distribution with minimum(4.3;2;1) and maximum (7.9;4.4;6.9) respectively whereas the remaining fifteen features were generated with normal distribution with mean 0 and standard deviation of 20.
3.1. Performance Metrics
Performance metrics imply measurement or performance criteria on how well a learning algorithm perform in features classification, regression and selection. This adduces to various criteria such as accuracy, precision, misspecification error rate, sensitivity and specificity.
3.2. Confusion matrix
This depicts how the learning algorithm is confused after classification when model is predicted with testing datasets.
Table 1.
Correct Classification Positive Negative
Positive TP (1,1) FN (1,0)
Negative FP (0,1) TN (0,0)
TP is the true positive value that is truly classified, FP is the false positive value that falsely classified, TN is the true negative value that is truly classified while FN is the false negative value that falsely classified.
Accuracy is the measure of the proportion of proportion that is correctly classified, ([Max13]).
4. RESULTS AND INTERPRETATION
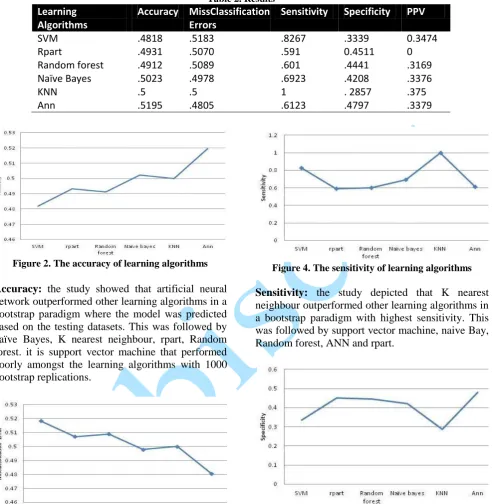
Table 2. Results
Learning Algorithms
Accuracy MissClassification Errors
Sensitivity Specificity PPV
SVM .4818 .5183 .8267 .3339 0.3474
Rpart .4931 .5070 .591 0.4511 0
Random forest .4912 .5089 .601 .4441 .3169
Naïve Bayes .5023 .4978 .6923 .4208 .3376
KNN .5 .5 1 . 2857 .375
Ann .5195 .4805 .6123 .4797 .3379
Figure 2. The accuracy of learning algorithms
Accuracy: the study showed that artificial neural network outperformed other learning algorithms in a bootstrap paradigm where the model was predicted based on the testing datasets. This was followed by naïve Bayes, K nearest neighbour, rpart, Random forest. it is support vector machine that performed poorly amongst the learning algorithms with 1000 bootstrap replications.
Figure 3. The misclassification errors of learning algorithms
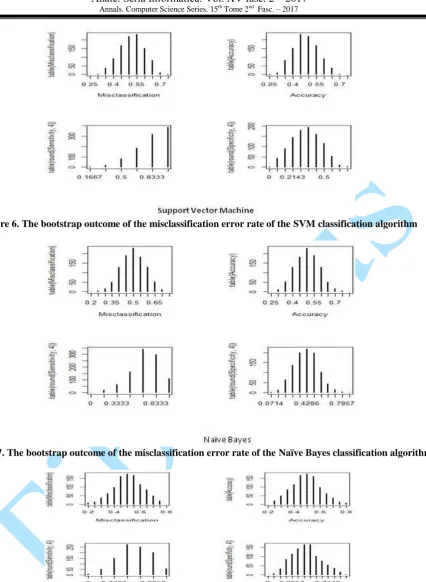
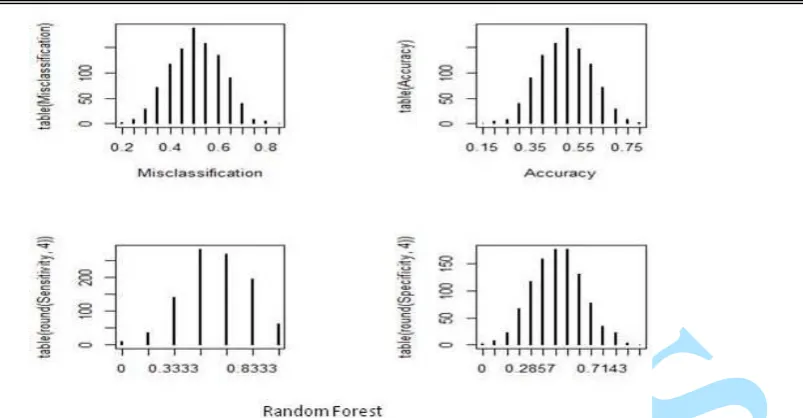
Misclassification Error: the study depicted that artificial neural network outperformed other learning algorithms in a bootstrap paradigm with minimum misclassification error of 0.4805. This was followed by naïve Bayes, K nearest neighbour, rpart, Random forest. It was support vector machine that performed poorly amongst the learning algorithms with highest misclassification error of 0.5183 in a bootstrap replication.
Figure 4. The sensitivity of learning algorithms
Sensitivity: the study depicted that K nearest neighbour outperformed other learning algorithms in a bootstrap paradigm with highest sensitivity. This was followed by support vector machine, naive Bay, Random forest, ANN and rpart.
Figure 5. The specificity of learning algorithms
Specificity: the study depicted that ANN outperformed other learning algorithms in a bootstrap paradigm with highest specificity. This was followed by rpart, random forest, naïve Bayes, support vector machine while the least is KNN.
CONCLUSION
Naïve Bayes learning algorithms were compared, the study showed that artificial neural network outperformed other learning algorithms with respect to accuracy criterion whereas the celebrated support vector machine performed poorly amongst the learning algorithms considered, the study depicted that artificial neural network outperformed other learning algorithms with the least misclassification error. The study depicted that K nearest neighbour outperformed other learning algorithms with highest sensitivity while ANN outperformed other learning algorithms with highest specificity. This study affirmed that there would be need to use more than a learning algorithm when there are irrelevant features in the data sets. Our study is in line with what are found in the literature.
REFERENCES
[Abh17] Abhisek A. - Comparative Study of Machine Learning Algorithms for Heart Disease Prediction, unpublished thesis, Helsinki Metropolia University of Applied Sciences Bachelor of Engineering, Information Technology, Pp 1:52, 2017.
[AIM13] Ahmad A., Iman P., Min T. -
Performance Comparison between Naïve Bayes, Decision Tree and k-Nearest Neighbor in Searching Alternative Design in an Energy
Simulation Tool, (IJACSA)
International Journal of Advanced Computer Science and Applications, Vol. 4, No. 11, pp 33:39, 2013,
www.ijacsa.thesai.org
[AD03] Aik C.T., David G. - An empirical comparison of supervised machine learning techniques in bioinformatics, appear in the proceedings of the first Asia Pacific Bioinformatics Conference, 2003.
[A+14] Amancio D. R., Comin C. H., Casanova D., Travieso G., Bruno O. M. - A Systematic Comparison of Supervised Classifiers. PLoS ONE
9(4): e94137, 2014.
doi:10.1371/journal.pone.0094137
[Eth10] Ethan A. - Introduction to Machine Learning, 2nd ed. Cambridge Massachusetts, MIT Press, 2010.
[LJ98] Li Y. H., Jain A. K. -Classification of Text Document, The Computer Journal, Vol. 41(8), 1998.
[Max13] Max B. - Principles of Data Mining. 2nd ed. Springer, 2013.
[RA06] Rich C., Alexandru N. - An Empirical Comparison of Supervised Learning
Algorithms Using Different
Performance Metrics, Appearing in Proceedings of the 23rd International Conference on Machine Learning, Pittsburgh, PA, pp 1-12, 2006.
[SS14] Shai S. S., Shai B. D. -Understanding Machine Learning. New York, Cambridge University Press, 2014.
[TSK06] Tan P.N., Steinbach M., Kumar V. -Introduction to Data Mining. Addison Wesley Publishing, 2006.
Figure 6. The bootstrap outcome of the misclassification error rate of the SVM classification algorithm
Figure 7. The bootstrap outcome of the misclassification error rate of the Naïve Bayes classification algorithm
Figure 9. The bootstrap outcome of the misclassification error rate of the Random Forest classification algorithm
Figure 10. The bootstrap outcome of the misclassification error rate of the Artificial Neural Network classification algorithm