www.geosci-instrum-method-data-syst.net/5/403/2016/ doi:10.5194/gi-5-403-2016
© Author(s) 2016. CC Attribution 3.0 License.
Nordic Snow Radar Experiment
Juha Lemmetyinen1, Anna Kontu1, Jouni Pulliainen1, Juho Vehviläinen1, Kimmo Rautiainen1, Andreas Wiesmann2, Christian Mätzler2, Charles Werner2, Helmut Rott3,4, Thomas Nagler3, Martin Schneebeli5, Martin Proksch5, Dirk Schüttemeyer6, Michael Kern6, and Malcolm W. J. Davidson6
1Finnish Meteorological Institute, Helsinki, Finland 2Gamma Remote Sensing AG, Gümlingen, Switzerland 3ENVEO IT GmbH, Austria
4Institute of Atmospheric and Cryospheric Sciences, University of Innsbruck, Innsbruck, Austria 5WSL Institute for Snow and Avalanche Research, Davos Dorf, Switzerland
6European Space Research and Technology Center, Noordwijk, the Netherlands
Correspondence to:Juha Lemmetyinen ([email protected])
Received: 2 December 2015 – Published in Geosci. Instrum. Method. Data Syst. Discuss.: 4 March 2016 Revised: 30 June 2016 – Accepted: 7 July 2016 – Published: 7 September 2016
Abstract. The objective of the Nordic Snow Radar Experi-ment (NoSREx) campaign was to provide a continuous time series of active and passive microwave observations of snow cover at a representative location of the Arctic boreal for-est area, covering a whole winter season. The activity was a part of Phase A studies for the ESA Earth Explorer 7 can-didate mission CoReH2O (Cold Regions Hydrology High-resolution Observatory).
The NoSREx campaign, conducted at the Finnish Me-teorological Institute Arctic Research Centre (FMI-ARC) in Sodankylä, Finland, hosted a frequency scanning scat-terometer operating at frequencies from X- to Ku-band. The radar observations were complemented by a microwave dual-polarization radiometer system operating from X- to W-bands. In situ measurements consisted of manual snow pit measurements at the main test site as well as extensive au-tomated measurements on snow, ground and meteorological parameters.
This study provides a summary of the obtained data, de-tailing measurement protocols for each microwave instru-ment and in situ reference data. A first analysis of the mi-crowave signatures against snow parameters is given, also comparing observed radar backscattering and microwave emission to predictions of an active/passive forward model.
All data, including the raw data observations, are available for research purposes through the European Space Agency and the Finnish Meteorological Institute. A consolidated dataset of observations, comprising the key microwave and
in situ observations, is provided through the ESA campaign data portal to enable easy access to the data.
1 Introduction
Knowledge on the duration, extent and total mass of seasonal snow cover is crucial for hydrological forecasts, numerical weather prediction and estimation of the energy balance of the Earth (Groisman et al., 1994; Brasnett, 1999; Barnett et al., 2005). Seasonal snow cover is also a strong indica-tor of global climate change (Derksen and Brown, 2012). The scarcity of observation networks makes data collected in situ unreliable for Arctic and boreal areas, making Earth observation from satellites an appealing option. The extent of seasonal snow cover can be retrieved with high spatial ac-curacy using both optical and radar sensors. Satellite-based methods for retrieving snow mass, or snow water equivalent (SWE), presently rely on passive microwave sensors (Kelly et al., 2003; Takala et al., 2011). Although these provide good global coverage and a long history of observations, present products suffer in terms of accuracy from the inherent coarse spatial resolution of passive microwave sensors over inho-mogeneous areas.
Ex-plorer 7 (ESA, 2012). The payload of CoReH2O was envis-aged as a dual-polarized, dual-frequency (X- and Ku-band) synthetic aperture radar (SAR), with the capability of de-tecting SWE, as well as snow accumulation on glaciers, at spatial resolutions ranging from 200 to 500 m (Rott et al., 2012). In order to support the development of geophysical re-trieval algorithms for CoReH2O, the NoSREx (Nordic Snow Radar Experiment) was initiated by ESA in 2009. The aim of the campaign was to collect near-continuous observations of snow cover radar signatures in the boreal forest/taiga region using a tower-based configuration, supported by frequent in situ observations. The campaign was designed to cover en-tire winter periods from snow-free conditions to eventual snow melt-off. With several extensions, the collected dataset for NoSREx covers a total of four snow seasons from 2009 to 2013, referred to as NoSREx I to IV in this article. The campaign was conducted at the Finnish Meteorological In-stitute Arctic Research Centre (FMI-ARC) in Sodankylä, Finland. The radar backscatter measurements were comple-mented by multi-frequency microwave radiometer observa-tions and numerous in situ observaobserva-tions of snow, soil and atmospheric properties, using both manual and automated methods. Advanced methods for quantifying the snow mi-crostructure were implemented on a campaign basis. The campaign provides a unique, near-continuous dataset of co-inciding active and passive microwave observations of snow cover and diverse measurements of snow characteristics.
Data collected during NoSREx have found use in numer-ous recent studies exploring the modelling of microwave sig-natures of snow-covered terrain (Proksch et al., 2015b; Tan et al., 2015; Chang et al., 2015; Pan et al., 2016). Here, we provide an overview of the instrumentation and data acqui-sition protocols used and of the collected microwave signa-tures. The calibration accuracy of the various instruments is discussed. We also give recommendations and suggestions on how in situ data could be used optimally to support anal-ysis of microwave observations. We discuss recent studies which have already exploited the results of the campaign and give recommendations for future experimental campaigns on snow microwave signatures.
2 Description of experiment setup 2.1 Measurement location
The main test site of NoSREx, the intensive observation area (IOA; 67.3618◦N, 26.6338◦E), was located on a for-est clearing surrounded by a sparse spruce/pine-dominated forest. The site, as well as the area at large, represents a typ-ical boreal forest/taiga landscape. According to composition survey, the soil at the IOA consisted of sand (70 %), and clay (1 %) with a thin organic surface-layer (2–5 cm). The sparse ground vegetation consisted mainly of lichen, heather and other small vegetation typical for the boreal forest region.
Small trees and bushes estimated to influence e.g. snow ac-cumulation were manually removed from the site in autumn before the onset of snow cover.
The main microwave instruments installed were the
SnowScatscatterometer (Werner et al., 2010) and theSodRad
multi-frequency radiometer system. Data from an L-band in-strument (Schwank et al., 2010) are available from the same site; these data are not presented here in detail as the rele-vant information can be found in the literature (Rautiainen et al., 2014; Lemmetyinen et al., 2016). All instruments were mounted on tower structures overlooking the forest clear-ing, partially allowing the same sectors of the test field to be covered, albeit at differing effective incidence angles. Au-tomated sensors were located adjacent to the test field, as was the main location for manual snow measurements. The loca-tion of the microwave instrumentaloca-tion and the approximate locations of various in situ sensors are depicted in Fig. 1. The measurement protocols for each instrument are described in detail in the following sections.
2.2 Microwave scatterometry
The SnowScat scatterometer, manufactured by GAMMA Re-mote Sensing, is a frequency step four-polarization scat-terometer (vertical–vertical, horizontal–horizontal, vertical– horizontal and horizontal–vertical; VV, HH, VH and HV, re-spectively), operating within the frequency range of 9.2 and 17.9 GHz (Werner et al., 2010). Equipped with a positioner device, the system allows scanning in both azimuth and ele-vation. For NoSREx, the instrument was installed on a tower structure at the height of 9.6 m above ground overlooking the IOA. The instrument was set to measure regular scans of the test field, first every 3 h in 2009 during NoSREx I. The scan of the main measurement sector (sector 1) com-prised of 17 independent look directions in azimuth at four incidence angles at 30, 40, 50 and 60◦. From the autumn of 2010 (NoSREx II), the scan interval was increased to 4 h to allow for scanning over an additional sector (sector 2) ad-jacent to the main observation section (see Fig. 1). The data presented in this study consist of calibrated sigma nought val-ues, averaged over the full azimuth scan of sector 1. Sector 2 data, however, are included in the NoSREx consolidated datasets. The technical specifications of SnowScat are given in Table 1.
SnowScat provided an internal calibration loop for com-pensation of internal temperature changes. The calibration consistency was verified by measuring dedicated calibration targets before and after each scan. A∼25 cm diameter alu-minium sphere was used for all seasons, and for NoSREx III and IV an additional flat plate target of 10×5 cm was in-stalled.
refer-Figure 1.Webcam image of NoSREx IOA and photographs of main microwave instruments, the SnowScat scatterometer and the SodRad radiometer system.
Table 1.SnowScat technical specifications.
Parameter Value
Manufacturer GAMMA Remote Sensing AG Power 230 V, max∼60 W
Weight ∼40 kg Temperature range −40–40◦C
Antenna Dual pol, < 10◦(3 dB) Antenna cross-pol iso <−20 dB
Frequency Stepped CW from 9.15 to 17.9 GHz Incidence angle −40–110◦
Azimuth angle −180–180◦ Polarization HH, HV, VV, VH
Dynamic range Receiver dynamic range > 80 dB with 16 bit ADC
Signal bias < 0.5 dB
ence during NoSREx III and IV. The nominal scan sequence was
– sphere measurement,
– plate measurement (for NoSREx III and IV), – sector 1 scan,
– sphere measurement,
– plate measurement (for NoSREx III and IV), – sector 2 scan (for NoSREx II to IV).
A typical seasonal variability of co-polarized backscatter from the calibration sphere was measured to be less than
±1dB. Larger deviations were occasionally observed but could be attributed to e.g. accumulation of snow on the sphere target.
For NoSREx III, the scan of the reference sphere was misaligned until 20 January 2012, due to human error, and calibration stability could not be verified. Measurements of the plate target in the early season proved inconclusive, as the plate target was highly susceptible to alignment errors. Therefore, SnowScat data are provided for NoSREx III only after 20 January.
2.3 Microwave radiometry
The SodRad system – including measurements at 10.65, 18.7, 21, 37 and 90 GHz (H and V pol) – was mounted on a 4.1 m high platform overlooking the forest clearing. The 90 GHz radiometer was available from 2009 until 2012, when it was replaced by the 21 GHz system. Measurements were made by performing a scan in the elevation direction, resulting in ground incidence angles from 30 to 70◦off nadir, in steps of 5◦. Although the system allowed scans in azimuth, most measurements were made in a single azimuth direc-tion. In order to avoid radio frequency interference (RFI) contamination in particular at the 10.65 and 18.7 GHz sys-tems, the measurements were timed to occur between scans of the SnowScat instrument. Thus, the elevation scan was performed every 3 h during 2009–2010 and every 4 h in sub-sequent winters. In between elevation scans, SodRad was set to measure a fixed incidence angle (50 or 53◦, depending on season). These data are available upon a separate request. The technical specifications of SodRad are given in Table 2.
– the elevation scan,
– a measurement of the sky cold target reference at zenith (measurement duration 10 min with 1 s integra-tion time),
– a fixed angle measurement (until next elevation scan). The tower-based radiometers were calibrated using a two-point calibration with external targets, using a microwave absorber at ambient temperature and using a similar target cooled by liquid nitrogen. For NoSREx I, the stability of the radiometers was verified by measuring the sky at an elevation angle of 30◦from horizontal. This was done to minimize the risk of snow accumulation on antenna apertures during the sky measurement. From NoSREx II onwards, verification of radiometer stability was performed using the cold sky refer-ence at zenith (imposing a minimal influrefer-ence from changing atmospheric conditions) after each elevation scan; any accu-mulated snow was manually removed. During NoSREx III, sky reference measurements were conducted only in March due to problems with the instrument positioner. Additional calibration experiments included measurements of external targets before and after the campaign season, including ab-sorber material cooled by liquid nitrogen. Calibration accu-racy immediately after calibration was estimated to be better than 1 K for the 18.7, 21, 36.5 and 90 GHz channels and bet-ter than 2 K for the 10.65 GHz channels. The increased un-certainty of the 10.65 GHz channels is partly due to use of a large parabolic reflector in front of the antenna feed, whereas 18.7 and 36.5 GHz channels utilize integrated horn antennas; the parabolic reflector exhibited some sidelobe effects which could not be entirely removed in the calibration. Analysis of the external calibration target experiments as well as cold sky measurements in clear-sky conditions typically indicated a drift of less than 2 K for all channels and polarizations dur-ing the cold winter period (December–March). The absolute values of the sky at nadir in clear-sky conditions were typi-cally on the order of 5, 12, 18, 20 and 35 K for 10.65, 18.7, 21 and 36 GHz, respectively. A total of 775, 654 and 412 sky reference measurements were made during NoSREx I, II and IV, respectively. The trend during NoSREx III could not be fully analysed due to availability of sky reference data only for March (85 measurements). Moreover, during NoSREx I, the 37 and 90 GHz channels exhibited decreasing drifts of−4 and−9 K, respectively, in the measured cold sky brightness temperature. The high observed drift compared to following seasons may be attributed to measuring the sky at 30◦ eleva-tion from horizontal for NoSREx I (in place of 90◦), which emphasizes variability in the prevailing weather conditions (e.g. atmospheric water vapour) due to the larger air mass in the signal path.
2.4 Manual in situ data collection
Manual snow observations consisted of weekly snow pit measurements. Snow pits were made at a distance of ca. 10–
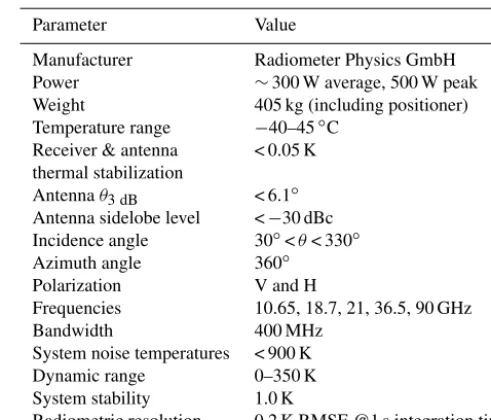
Table 2.SodRad technical specifications.
Parameter Value
Manufacturer Radiometer Physics GmbH Power ∼300 W average, 500 W peak Weight 405 kg (including positioner) Temperature range −40–45◦C
Receiver & antenna < 0.05 K thermal stabilization
Antennaθ3 dB < 6.1◦
Antenna sidelobe level <−30 dBc Incidence angle 30◦<θ< 330◦ Azimuth angle 360◦
Polarization V and H
Frequencies 10.65, 18.7, 21, 36.5, 90 GHz Bandwidth 400 MHz
System noise temperatures < 900 K Dynamic range 0–350 K System stability 1.0 K
Radiometric resolution 0.2 K RMSE @1 s integration time
20 m from the radiometer footprints in the same measure-ment field (Fig. 1). Due to the destructive nature of snow pit measurements, consecutive pits were made at a distance of 50–100 cm from the previous pit. Measured parameters in-cluded bulk snow depth (SD), density and SWE using a snow corer and manual scale, snow density profiles at 5 cm inter-vals using a 250 cm3manual cutter and scale, snow tempera-ture profile at 10 cm intervals using a digital thermometer, an assessment of snow layering based on a manual assessment of snow hardness variations, and snow grain size and type es-timation. The snow grain size and type were estimated visu-ally from macro-photography of snow samples, taken against a 1 mm reference grid. A grain size classification was made following Fierz et al. (2009); in addition, the typical grain size (average maximum diameter of typical snow grains, re-ferred to hereafter asE) was estimated visually. One snow sample was taken from the centre of each identified snow layer, and the estimated grain size of the sample was consid-ered to be applicable for the whole layer.
During NoSREx III and IV, snow specific surface area (SSA) was measured with the IceCube instrument manufac-tured by A2 Photonic Sensors, France. The measurement is based on IR reflectance of a snow sample placed inside an in-tegrating sphere (Gallet et al., 2009). The vertical snow pro-file was sampled at 3 cm resolution, excluding hard-packed layers which presented difficulties for sampling. The time se-ries of SSA measurements are not a part of the NoSREx con-solidated datasets but are available on separate request. A detailed description of the manual snow observation pro-gramme, of which the snow pit measurements are a part, is given by Leppänen et al. (2016).
Table 3.Automated data collected in NoSREx consolidated datasets from Sodankylä mini automated weather station (MAWS), the IOA automated weather station and the IOA Gamma Water Instrument.
Sensor array Variable Instrument
AWS
Average 2 m air temperature Pentronic PT100 Average dew point temperature Pentronic PT100 Average wind speed Vaisala WAA25 Maximum wind gust Vaisala WAA25 Average pressure reduced to sea level Vaisala PTB201A Average pressure at station level Vaisala PTB201A Mode of present weather ww-code/synop –
Average height of the lowest clouds Vaisala CT25K Mode of height of the lowest clouds Vaisala CT25K Average of total cloudiness Vaisala CT25K
Average of snow depth (AWS) Campbell Scientific SR50-45H
IOA/MAWS
Soil moisture, location A, depth 2 cm ThetaProbe ML2X Soil moisture, location A, depth 10 cm ThetaProbe ML2X Soil moisture, location B, depth 2 cm ThetaProbe ML2X Soil moisture, location B, depth 10 cm ThetaProbe ML2X Soil temperature, location B, depth 2 cm Pentronic PT100 Air temperature, open area Pentronic PT100 Air temperature, forest Pentronic PT100
Snow depth, open area (acoustic sensor) Campbell Scientific SR50-45H Snow depth, forest (acoustic sensor) Campbell Scientific SR50-45H
IOA/GWI Snow water equivalent (Gamma Water Instrument) Astrock Ltd. (experimental)
specific tests (see Proksch et al., 2015b), the snow profile in-formation should be treated with caution. In addition to tem-poral variability, also the spatial variability of snow should be considered. As this can be notable even at short distances, it is not recommended to use the measured profiles as they are for direct estimation of snow properties at the instrument footprints. Rather, e.g. Lemmetyinen et al. (2015) applied a simplification of the measured snow profiles to either one or two layers. In addition, a third-order fit was applied to the observations ofEto reduce uncertainty arising e.g. from ob-server bias.
2.5 Automated in situ data
Several automatic measurement instruments were installed at the IOA. Two acoustic sensors were used to record SD. One sensor was placed in the forest clearing near the SodRad platform tower and another under the forest canopy at a dis-tance of ca. 50 m. Air temperature (Tair) was measured at the
same locations. Three automated soil moisture and soil tem-perature measurement sensors were installed at different lo-cations in the test field. Snow water equivalent was measured directly with an experimental device (GWI, Gamma Water Instrument). Data from other automated in situ observations were collected into the consolidated datasets from the FMI sounding station (ca. 500 m from the IOA). The automated data available in the consolidated datasets are summarized in Table 3.
2.6 Intensive observation periods
Intensive observation periods (IOPs) were organized during the first three NoSREx campaigns. The objective of the IOPs was to complement the collected time series of basic obser-vations, in particular by employing advanced methods for characterization of snow microstructure. The measurements consisted of
– SSA analyses using near-infrared (NIR) photography (Matzl et al., 2006),
– snow micropenetrometry using the Snow MicroPen, (SMP; Schneebeli et al., 1998; Proksch et al., 2015a),
– computer tomography (CT) analysis of casted snow samples (Matzl et al., 2010).
In particular, the measurements provide a means to validate visual estimations of layering against SMP profiles, validate and compare visual grain size estimates against correlation length from CT imagery, validate density profile measure-ments against density profile from CT analysis and estimate the 3-D distribution on main sites’ snow stratigraphy from SMP measurements surrounding the test field.
backscatter. As in the case of conventional snow pit obser-vations, most measurements were made outside of the in-strument footprints. However, as a one-time test during the third campaign period, SMP measurements and casted CT samples were taken from an area in the test field observed by both SnowScat and SodRad (Proksch et al., 2015). Data from IOPs are not a part of the NoSREx consolidated datasets but can be made available on request from FMI.
3 NoSREx consolidated datasets
The key observations of NoSREx are collected in a consoli-dated dataset, providing easy access to the main time series of in situ and microwave measurements. The data are pro-vided as csv (comma-separated value) files and Excel spread-sheets. The data include
– calibrated time series of SnowScat backscatter sigma nought at four incidence angles (30, 40, 50, 60◦) and three 2 GHz frequency bands (centre frequencies: 10.2, 13.3 and 16.7 GHz). Separate data files are provided for the two measurement sectors (sector 1: main mea-surement sector; sector 2: adjacent sector). Data are provided as averages over the full azimuth scan range of both sectors, with the exception that some azimuth directions have been removed from the sector 1 data to avoid experimental plate targets set in 2010. Note that SnowScat consolidated data for NoSREx III (2011– 2012) are limited to a period after 20 January 2012, due to observed anomalies in the backscatter data.
– calibrated time series of SodRad brightness tempera-tures at 10.65, 18.7, 37 and 90 GHz, H and V pol, at four incidence angles (30, 40, 50, 60◦). Average value and standard deviation of each elevation scan provided. The 90 GHz receiver was replaced by a 21 GHz receiver from autumn 2011 onwards.
– time series of selected automated in situ observations at the IOA, the main FMI-ARC automated weather station (AWS), the meteorological mast. Data are provided as average values over the scan times (3 or 4 h) of SnowS-cat observations. Recently, an updated version with 1 h averages has been made available.
– Summary of weekly and bi-weekly manual snow pit measurements at the IOA.
4 Overview of collected data from NoSREx I to IV The NoSREx campaign seasons each had distinctive charac-teristics concerning weather conditions, snow structure and soil conditions. All of these affected the resulting microwave signatures, which are discussed in this section.
4.1 Weather and snow conditions
The four winter seasons covered by NoSREx are summarized in the following in terms of weather, snow and soil condi-tions. The distinctive characteristics of each season of NoS-REx are collected in Table 4, showing also a comparison to the 30-year average in the Sodankylä region. The date of the onset of soil freezing, maximum frost depth, onset of soil thaw and maximum frost depth are given. Regarding snow conditions, the seasons are compared for the date of perma-nent snow cover, date of maximum SWE, date of snowmelt onset, maximum SWE, and average snow density and grain size. The data are compiled based on both automated and manual observations. Two metrics related to the temperature gradient between the top and bottom of the snowpack are given, i.e. the average temperature gradient between air and soil (<1T>=<Tair −TG>) and the effective sum of the
mean daily temperature gradient, defined here as the sum of daily average temperature gradients divided by the respective daily mean snow depth.
For the NoSREx I, the early onset of permanent snow cover (day of year (DOY) 279) and mild temperatures were clearly linked to a delayed evolution of soil freezing. Melt– refreeze events in December also caused the formation of a crust at the bottom of the snowpack. The maximum mea-sured SWE was slightly over the 30-year average, while, based on snow pit observations, depth hoar was largely ab-sent. The following season (NoSREx II) saw a sharp onset of soil freezing; at its maximum, the measured soil frost depth was over 2 m in March–April 2011. The season saw harsh temperatures in early winter and a relatively thin snow cover, with a maximum SWE of only 165 mm, the lowest maximum value for the 3 years investigated. This caused rapid freezing of the soil as well as the formation of a distinct depth hoar layer in the snow, which is exhibited by the highest average and effective sum of the temperature gradient, and the largest average estimated snow grain size. The average bulk snow density was also notably low (170 kg m−3).
esti-Table 4.Summary of seasonal characteristics for soil and snow conditions in winter periods of 2009–2010, 2010–2011 and 2011–2012, compared to 30-year average in the Sodankylä region. Data are compiled based on both automated and manual observations.
Season 30-year average 2009–2010 2010–2011 2011–2012 2012–2013
Soil conditions
Onset of soil freezing (DOY) 298 289 289 320 298
Date of maximum frost depth (DOY) 91 91 90 107 106
Onset of soil thaw (DOY) 132 126 116 132 121
Date of soil thaw (DOY) 148 141 152 147 146
Max frost depth (cm) 160 161 210 115 155
Snow conditions
Date of permanent snow cover (DOY) 299 279 300 329 289
Date of SWE maximum (DOY) 109 88 72 112 102
Date of snowmelt onset (DOY) NA 90 92 115 102
Date of snow melt-off (DOY) 129 134 128 140 133
Max SWE (mm) 186.5±41.9 standard deviation 225 165 240 191
(record min 120; record max 267)
Average density (kg m−3) Not available (NA) 200 170 190 200
Grain size (Fiertz et al., 2009); NA 1.4±0.2 1.5±0.3 0.9±0.3 1.1±0.3 depth-weight average±standard deviation (mm)
Temperature
Mean temperature gradient; NA −8.7 −10.0 −8.3 −9.4
<1T>=<Tair−TG> (◦C)
Effective sum of daily NA 26.3 43.0 22.8 30.5
mean temperature gradient∗
∗ PN
d=1
< 1TdSDd>.
mates, it can be concluded that the average grain size of the snow was clearly smaller during NoSREx III than the pre-ceding two seasons, largely due to the absence of large depth hoar crystals in the dataset.
The fourth season (NoSREx IV) exhibited soil and snow conditions close to the 30-year average. Compared to preced-ing seasons, the estimates of snow grain size were on average the smallest after NoSREx III (E=1.1±0.3 mm), while the SWE maximum fell between the first and second seasons.
4.2 Microwave signatures against snow and soil conditions
Figure 2 presents the time series of observations for the four seasons of NoSREx, summarizing some of the microwave and in situ information available. Co-polarized (VV polar-ization) backscatter measurements at 50◦ incidence angle from the SnowScat instrument are shown. The data are inte-grated over three 2 GHz frequency bands (centre frequencies at 10.2, 13.3 and 16.7 GHz). Vertically polarized SodRad ob-servations at 18.7 and 37 GHz, typically used for detection of snow water equivalent, are displayed for the same time peri-ods. Selected in situ observations include SD, air tempera-ture (Tair), ground temperature (TG), bulk averages of
manu-ally measured snow density (ρS) and bulk averages of visual
estimates ofE. The microwave instruments suffered from in-stallation delays and malfunctions, which appear as data gaps in the autumn seasons of 2009, 2011 and 2012. Specialized tests and maintenance periods took place also in April 2010, April 2012 and February/March 2013. Notably, continuous measurements from snow-free conditions to snow melt-off
from both SnowScat and SodRad are available only for NoS-REx II.
The microwave signatures reveal some interesting charac-teristics; in particular, the early snow season response was characterized by sudden decreases in backscatter, originat-ing from snowmelt events (Mätzler and Schanda, 1984), fol-lowed by an increase in backscatter during refreezing. Sev-eral such periods occurred e.g. in the autumns of 2009 and 2010; for 2010, the same features can be observed in SodRad brightness temperatures. A distinct feature observed during NoSREx I, II and IV was a gradual decrease of backscatter after the initial increase (measurements during the early win-ter of NoSREx III, until January 2012, were lost due to an er-roneous setting in the SnowScat instrument). The effect can be explained by the gradual relaxation of crust structures in snow, formed during the early-season melt events and caus-ing increased backscatter (e.g. Strozzi et al., 1997), to more typical late-winter snow. The fact that the effect is more dis-cernible at 16.7 GHz than at the two lower frequency bands implies that the feature is dominated by scatter changes in the snow volume. Unfortunately, the in situ data were not able to provide a quantitative measure of the phenomena, as objective measurements of the snow structure (e.g. computer tomography samples; see Sect. 2.6) were not taken in the early season. Nevertheless, the observations are consistent with the expected backscatter behaviour of snow undergoing metamorphism (e.g. Lin et al., 2016).
Figure 2. Summary of NoSREx seasons I–IV(a–d). Panels from SnowScat VV-polarized backscattering 50◦ incidence angle; SodRad brightness temperatures at 18.7 and 37 GHz, vertical polarization, 50◦incidence angle; snow depth (SD), air temperature (Tair) and ground
temperature (TG); bulk averages of manually measured snow density (ρS) and visual estimates of snow grain size (E). Third-order fit to time
series ofEshown.
in intensity during NoSREx I and II, while for NoSREx III (Fig. 2c) no increase is apparent. A notable response at the higher Ku-band (16.7 GHz) is observed for NoSREx I, II and IV. However, in particular during the last season the increase in backscattering cannot be attributed to increase in snow mass, as the measured snow height and density remained al-most constant from March to April 2013, when an increase of Ku-band backscattering was observed. Rather, the increase can be related to the observed increase in snow grain size.
The measured SodRad brightness temperature response showed clear similarities with the backscatter measured by SnowScat. In particular, the dynamic responses of both the 18.7 and 37 GHz channels were strongest for the latter (Fig. 2b) and notable also for NoSREx I (Fig. 2a; note: early-season dynamics not visible due to late start of measure-ments). Signal dynamics at 37 GHz were much reduced dur-ing NoSREx III (Fig. 2c), indicatdur-ing a low amount of total scattering in the snowpack, despite the 3rd year exhibiting the highest total SWE.
It should be noted that, for NoSREx I and III, measure-ments had begun only after the onset of snow cover. Fur-thermore, in November 2012, SodRad measurements were halted due to maintenance immediately after the onset of snow cover. The early-season drop of the 37 GHz bright-ness temperature is thus not apparent in the data for those seasons. The SodRad instrument also malfunctioned in early April 2012, missing the last significant increase in SWE of the season.
A declining trend towards the late season can be observed in the third-order fit of E in particular for NoSREx I and II (Fig. 2a and b); this can be explained by newly fallen layers of snow with a small grain size forming an increas-ingly large part of the total snowpack, thus affecting the bulk average. For NosREx IV (Fig. 2d), the average grain size was observed to increase almost monotonously for the entire dry-snow season. This may explain why both the 16.7 GHz backscattering and 37 GHz emission signatures continue to indicate increasing scattering in the snow, despite the snow height remaining almost constant between March and April 2013.
5 Model analysis
To demonstrate the use of the NoSREx data in evaluation of microwave emission and backscattering models, the Mi-crowave Emission Model for Layered Snowpacks adapted to include backscattering (MEMLS3&a) consisting of simula-tion of both active and passive microwave response (Wies-mann and Mätzler, 1999; Mätzler and Wies(Wies-mann, 1999; Proksch et al., 2015b) was applied.
5.1 Model configuration
The expected backscatter and emission response with mea-sured snow and soil conditions was simulated for all four seasons of NoSREx using a one-layer model configuration. Daily simulations were performed using the daily averages of measured SD,ρS,TG,Tair(see Fig. 2) and snow exponential
correlation length (pex), obtained fromE using an
empiri-cal relation introduced by Durand et al. (2008). BothρSand
E were obtained from weekly manual snow measurements; thus, a third-order fit was applied to the measurement time series to obtain daily values (see Fig. 2 for fit to measure-ments ofE). This was also necessary to reduce the random variability of the manual measurements.
The calculated value forpexwas further modified in
sim-ulations by using a seasonal linear scaling factor to obtain an optimized correlation lengthpexopt(p
opt
ex =β·pex). The
verti-cally polarized brightness temperatures at 18.7 and 37 GHz were matched to observations using the scaling factor β; these channels were assumed to be least affected by snow layering as well as roughness variations at the snow–soil in-terface. The use of the scaling factor allowed assessing the validity of the model over the other orthogonal polarization for simulating brightness temperature, as well as for simu-lating backscattering, while using the same model configura-tion. The obtained values forβ, obtained iteratively at 0.05 increments, ranged from 0.9 for NoSREx I to 1.3 for NoS-REx II and IV. It can be assumed that the scaling accounts for shortcomings in both model physics and the available in-put information.
Figure 3.Comparison of modelled (shaded areas) and measured (solid lines) response of backscatter and brightness temperature dur-ing NoSREx seasons II and III (aandb). Simulations in a one-layer configuration using MEMLS3&a (Proksch et al., 2015b) for 50◦ incidence angle, applying measured parameters depicted in Fig. 2. Scattering coefficient estimated using the improved Born approx-imation (Mätzler and Wiesmann, 1999). Simulation optimized for vertically polarized brightness temperature (TBV) by using seasonal scaling factor to snow exponential correlation lengthpex.
Simula-tion error limits calculated by modifyingpexby±30 %.
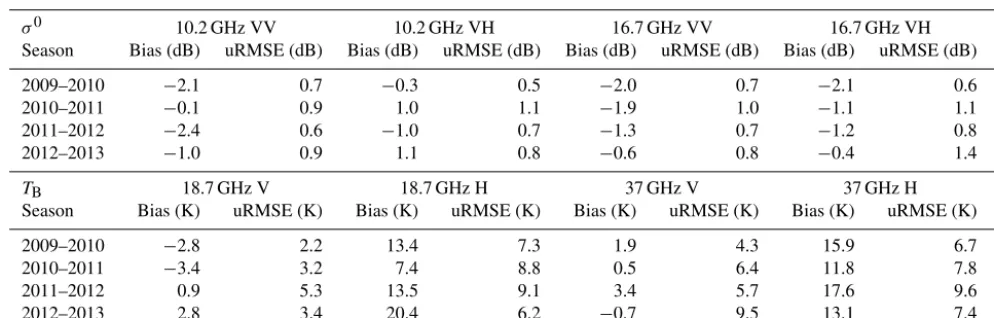
Table 5. Summary of MEMLS3&a simulation bias and unbiased RMSE for 10.2 and 16.7 GHz backscattering (above) and 18.7 and 37 GHz brightness temperature (below) against observations from SnowScat and SodRad instruments. Results over the dry-snow period (Tair<−1◦C) for NoSREx seasons I to IV. Simulations were optimized againstTBV using a seasonal scaling factorβtopex(2009–2010:
β=1.25; 2010–201:β=1.3; 2011–2012:β=0.9; 2012–2013:β=1.3).
σ0 10.2 GHz VV 10.2 GHz VH 16.7 GHz VV 16.7 GHz VH Season Bias (dB) uRMSE (dB) Bias (dB) uRMSE (dB) Bias (dB) uRMSE (dB) Bias (dB) uRMSE (dB)
2009–2010 −2.1 0.7 −0.3 0.5 −2.0 0.7 −2.1 0.6 2010–2011 −0.1 0.9 1.0 1.1 −1.9 1.0 −1.1 1.1 2011–2012 −2.4 0.6 −1.0 0.7 −1.3 0.7 −1.2 0.8 2012–2013 −1.0 0.9 1.1 0.8 −0.6 0.8 −0.4 1.4
TB 18.7 GHz V 18.7 GHz H 37 GHz V 37 GHz H
Season Bias (K) uRMSE (K) Bias (K) uRMSE (K) Bias (K) uRMSE (K) Bias (K) uRMSE (K)
2009–2010 −2.8 2.2 13.4 7.3 1.9 4.3 15.9 6.7
2010–2011 −3.4 3.2 7.4 8.8 0.5 6.4 11.8 7.8
2011–2012 0.9 5.3 13.5 9.1 3.4 5.7 17.6 9.6
2012–2013 2.8 3.4 20.4 6.2 −0.7 9.5 13.1 7.4
5.2 Comparison to observations
The result of the model estimates against 10.2 and 16.7 GHz VV- and VH-polarized backscatter measured by SnowScat (in dB) and 18.7 and 37 GHz H- and V-polarized brightness temperature (in Kelvin) observed by SodRad are presented in Fig. 3 for NoSREx seasons II and III. As explained in Sect. 4.2, these two seasons differed most in terms of snow properties (SWE and grain size). In order to illustrate the effect of snow microstructure on simulations, these are de-picted as a shaded area corresponding to fluctuating pexby
±30 % (corresponding to the highest scaling factor applied for model optimization).
Applying the optimization of the model described above, simulations of TB at both V and H polarizations reproduce
the observed trends with reasonable accuracy during both seasons. Short-term fluctuations at both polarizations are driven mainly by physical temperature of soil and snow, while the overall signal dynamics are governed by snow accumulation and microstructure. The differences in sea-sonal dynamics between the two seasons are well apparent, with the minimum TBV at 37 GHz reaching 170 K for NoS-REx II, while equivalent minimum values for NoSNoS-REx III were above 230 K.
Simulations of the active microwave response similarly highlight differences between the two seasons; for NoS-REx II, the simulated backscattering increases by ca. 3 dB for Ku-band and 2 dB for X-band VV polarization through-out the dry-snow season. For NoSREx III, the simulated in-crease was only 1.5 and 1 dB for X- and Ku-band, respec-tively. Here, applying the optimized scaling factor for pex
did not fully account for the measured increase in Ku-band (16.7 GHz) backscattering during NoSREx II, resulting in an increasing underestimation towards the end of the season. The X-band (10.2 GHz) response, however, was better
cap-tured. For NosREx III, the measured seasonal dynamic re-sponse was closer to the simulations, while the X-band simu-lations were underestimated. It is also notable that the single-layer simulations could not reproduce the sharp increase of the backscatter signal observed for NoSREx II after early-season melt–refreeze events.
Table 5 summarizes the bias and root mean square errors (RMSEs) (with bias removed) of simulated backscatter and brightness temperature against measurements separately for each of the four seasons of NoSREx. The analysis is limited to the dry-snow period, defined here as days with snow depth over 5 cm and mean air temperature below −1◦C. As the simulation was optimized for 18.7 and 37 GHz V pol bright-ness temperature, these channels exhibit the lowest bias. A residual RMSE of over 5 K and up to 10 K remains for these channels, respectively. The errors at H polarization are no-tably larger for both frequencies, with a positive bias (over-estimation) up to over 20 K. This plausibly results from the higher sensitivity of horizontal polarization to snow layer-ing effects (see e.g. Rees et al., 2010), which are omitted in the one-layer model configuration. Bias errors from−2.4 to 1.1 dB were obtained for the simulated backscatter values, using the scaledpexvalues; the magnitude of the bias varied
6 Discussion
Using data collected during NoSREx, Lin et al. (2016) demonstrated that snow microstructural morphology was a major driver for large variations from year-to-year dynam-ics of the radar backscattering signal vs. SWE, and the sig-nal was further affected by early-season melt–refreeze events which varied from one season to another. Regarding possi-bilities for retrieval of SWE, Lin et al. (2016) conclude that the complexity of the radar signal leads to stringent require-ments for a priori knowledge on the snowpack states, as well as backscattering models to account for snow microstructural temporal variations.
In this regard, the NoSREx dataset provides some interest-ing insight into possibilities of usinterest-ing active and passive mi-crowave systems in synergy to retrieve information on snow cover. Analysis of the datasets in this study indicated that the differences in both active and passive microwave dynamic response over the different seasons can largely be attributed to differences in snow microstructural properties, which af-fected the scattering efficiency of the snowpack. In a prelim-inary model analysis using the MEMLS3&a active/passive model, these signatures could also be replicated with rea-sonable accuracy for radar backscattering when the passive microwave signature was first optimized using the snow cor-relation length (i.e. microstructure). This suggests the pos-sibility of parametrizing the retrieval of snow parameters such as SWE in terms of snow microstructural properties, by exploiting information provided by active and passive mi-crowave sensors in unison. However, the analysis shows also that, when using a one-layer configuration, the MEMLS3&a model may not correctly reproduce backscattering signatures in particular during the early snow season. Multi-layer re-trieval configurations supported by e.g. physical snow mod-els for initializing snowpack states should be investigated to overcome this deficiency.
Snow grain size, which presents the main source of in-formation on snow microstructure for NoSREx, is particu-larly difficult to establish in the field. Research also indicates that the grain size by itself is insufficient to explain the full scattering behaviour of microwaves in snow (e.g. Mätzler, 2002). The problem is aggravated by snow particles of in-creasing size and complex shape, as well as by sintering and clustering of snow grains. However, using data collected dur-ing NoSREx, Leppänen et al. (2015) demonstrated that visu-ally established grain sizes E correlated with optical grain sizes measured using an objective measure of SSA. Further-more, Lemmetyinen et al. (2015) showed that an average grain size used to fit emission model predictions captured both the magnitude and the seasonal trend of the visually estimated grain sizes during NoSREx-II. Therefore, the in-formation collected onEcan be used at least as an indicator of snow microstructural evolution during the NoSREx cam-paigns, even if not employed directly in e.g. forward-model simulations of emission and backscattering.
Overall, the NoSREx data have already proven useful for establishing novel relations between snow properties and mi-crowave signatures. Chang et al. (2015) applied the SnowS-cat observations for comparisons of backsSnowS-cattering estimates using two derivations of the dense media radiative transfer (DMRT), the bicontinuous model and quasi-crystalline ap-proximations (QCAs). The bicontinuous approach is based on exact solutions of the Maxwell equations, while QCA is an analytical approximation. Both approaches showed rea-sonable agreement with SnowScat observations collected during the second campaign season. Furthermore, Tan et al. (2015) recently demonstrated the necessity of multiple-scattering enhancement in DMRT, using both active and pas-sive observations from NoSREx for model evaluation. On the other hand, Leinss et al. (2015) applied SnowScat ob-servations for differential interferometry, showing that the increase in SWE could be accurately obtained by exploit-ing the phase information retained in SnowScat observations. The high temporal resolution of SnowScat (3–4 h) allowed mitigating decorrelation effects, while phase wrapping at the relatively high frequencies was addressed with a novel two-frequency approach. Data collected in the frame of NoS-REx have also been exploited in recent studies focused on passive microwave signatures (e.g. Rautiainen et al., 2014; Pan et al., 2015).
7 Conclusions
8 Data availability
The NoSREx consolidated datasets are available after reg-istration on the ESA Earth Observations Campaign Data portal (https://earth.esa.int/web/guest/campaigns). SnowScat raw data are available for scientific use via FMI and GAMMA Remote Sensing AG. Data from NoSREx IOPs are available for scientific use on request from WSL-SLF. The time series of SSA profiles are available on separate request from FMI.
Acknowledgements. The work was conducted under the European Space Agency project “Technical assistance for the deployment of an X- to Ku-band scatterometer during the NoSREx experiment” (ESA ESTEC contract 22671/09/NL/JA/ef). The staff at FMI-ARC are acknowledged for in situ data collection and operation of microwave instruments.
Edited by: Mark Paton
Reviewed by: two anonymous referees
References
Barnett, T. P., Adam, J. C., and Lettenmaier, D. P.: Potential impact of a warming climate on water availability in snow-dominated regions, Nature, 438, 303–309, 2005.
Brasnett, B.: A global analysis of snow depth for numerical weather prediction, J. Appl. Meteorol., 38, 726–740, doi:10.1175/1520-0450(1999)038<0726:AGAOSD>2.0.CO;2, 1999.
Chang, W., Tan S., Lemmetyinen J., Tsang, L., Xu, X., and Yueh, S.: Dense Media Radiative Transfer Applied to SnowScat and SnowSAR, IEEE J. Select. T. App. Earth Obs. Remote Sens., 7, 3811–3825, doi:10.1109/JSTARS.2014.2343519, 2015. Derksen, C. and Brown, R.: Spring snow cover extent reductions
in the 2008-2012 period exceeding climate model projections, Geophys. Res. Lett., 39, L19504, doi:10.1029/2012GL053387, 2012.
Durand, M., Kim, E. J., and Margulis, S. A.: Quantifying uncer-tainty in modelling snow microwave radiance for a mountain snowpack at the point-scale, including stratigraphic effects, IEEE T. Geosci. Remote, 46, 1753–1757, 2008.
ESA: Report for Mission Selection: CoReH2O, ESA SP-1324/2 (3 volume series), European Space Agency, Noordwijk, The Netherlands, 2012.
Fierz, C., Armstrong, R. L., Durand, Y., Etchevers, P., Greene, E., McClung, D. M., Nishimura, K., Satyawali, P. K., and Sokra-tov, S. A.: The International Classification for Seasonal Snow on the Ground. IHP-VII Technical Documents in Hydrology no. 83, IACS contribution no. 1, UNESCO-IHP, Paris, 2009.
Gallet, J.-C., Domine, F., Zender, C. S., and Picard, G.: Measument of the specific surface area of snow using infrared re-flectance in an integrating sphere at 1310 and 1550 nm, The Cryosphere, 3, 167–182, doi:10.5194/tc-3-167-2009, 2009. Groisman, P. Y., Karl, T. R., and Knight, R. W.: Observed impact of
snow cover on the heat balance and the rise of continental spring temperatures, Science, 263, 198–200, 1994.
Kelly, R., Chang, A., Tsang, L., and Foster, J.: A prototype AMSR-E global snow area and snow depth algorithm, IAMSR-EAMSR-EAMSR-E T. Geosci. Remote, 41, 230–242, 2003.
Leinss, S., Wiesmann, A., Lemmetyinen, J., and Hajnsek, I.: Snow Water Equivalent of dry snow measured by differential interfer-ometry, IEEE J. Select. T. App. Earth Obs. Remote Sens., 8, 3773–3790, 2015.
Lemmetyinen, J., Derksen, C., Toose, P., Proksch, M., Pulliainen, J., Kontu, A., Rautiainen, K., Seppänen, J., and Hallikainen, M.: Simulating seasonally and spatially varying snow cover bright-ness temperature using HUT snow emission model and retrieval of a microwave effective grain size, Remote Sens. Environ., 156, 71–95, 2015.
Lemmetyinen, J., Schwank, M., Rautiainen, K., Kontu, A., Parkki-nen, T., Mätzler, C., Wiesmann, A., Wegmüller, U., Derksen, C., Toose, P., Roy, A., and Pulliainen, J.: Snow density and ground permittivity retrieved from L-band radiometry: Application to experimental data, Remote Sens. Environ., 180, 377–391, 2016. Leppänen, L., Kontu, A., Vehviläinen, J., Lemmetyinen, J., and Pul-liainen, J.: Comparison of traditional and optical grain size field measurements with SNOWPACK simulations in a taiga environ-ment, J. Glaciol., 61, 151–162, 2015.
Leppänen, L., Kontu, A., Hannula, H.-R., Sjöblom, H., and Pulli-ainen, J.: Sodankylä manual snow survey program, Geosci. In-strum. Method. Data Syst., 5, 163–179, doi:10.5194/gi-5-163-2016, 2016.
Lin, C.-C., Rommen, B., Floury, N., Schüttemeyer, D., David-son, M., Kern, M., Kontu, A., Lemmetyinen, J., Pulliainen, J., Wiesmann, A., Werner, C., Mätzler, C., Schneebeli, M. Proksch, M., and Nagler, T.: Active microwave scattering signature of snowpack – continuous multi-year SnowScat observation exper-iments, J. Sel. Top. App. Earth Obs. Remote Sens., 99, 1–21, doi:10.1109/JSTARS.2016.2560168, 2016.
Matzl, M. and Schneebeli, M.: Measuring specific surface area of snow by near-infrared photography, J. Glaciol., 52, 558–564, 2006.
Matzl, M. and Schneebeli, M.: Stereological measurement of the specific surface area of seasonal snow types: Comparison to other methods, and implications for mm-scale vertical profiling, Cold Reg. Sci. Technol., 64, 1–8, 2010.
Mätzler, C. and Schanda, E.: Snow mapping with active microwave sensors, Int. J. Remote Sens., 5, 409–422, 1984.
Mätzler, C. and Wiesmann, A.: Extension of the microwave emis-sion model for layered snowpacks to coarse-grained snow, Re-mote Sens. Environ., 70, 318–326, 1999.
Mätzler, C.: Relation between grain-size and correlation length of snow, J. Glaciol., 48, 461–466, 2002.
Pan, J., Durand, M., Sandells, M., Lemmetyinen, J., Kim, E. J., Pul-liainen, J., Kontu, A., and Derksen, C.: Differences between HUT snow emission model and MEMLS and their effects on bright-ness temperature simulation, IEEE Trans. Geosci. Remote Sens., 54, 2001–2019, 2016.
Proksch, M., Löwe, H., and Schneebeli, M.: Density, specific sur-face area, and correlation length of snow measured by high-resolution penetrometry, J. Geophys. Res.-Earth, 120, 346–362, 2015a.
include backscattering, Geosci. Model Dev., 8, 2611–2626, doi:10.5194/gmd-8-2611-2015, 2015b.
Rautiainen, K., Lemmetyinen, J., Schwank, M., Kontu, A., Ménard, C., Mätzler, C., Drusch, M., Wiesmann, A., Ikonen, J., and Pul-liainen, J.: Detection of soil freezing from L-band passive mi-crowave observations. Remote Sens. Environ., 147, 206–218, 2014.
Rees, A., Lemmetyinen, J., Derksen, C., Pulliainen, J., and English, M.: Observed and modelled effects of ice lens formation on pas-sive microwave brightness temperatures over snow covered tun-dra, Remote Sens. Environ., 114, 116–126, 2010.
Rott, H., Yueh, S., Cline, D., Duguay, C., Essery R., Haas, C., He-liere, F., Kern, M., Macelloni, G., Malnes, E., Nagler, T., Pul-liainen, J., Rebhan, H., and Thompson, A.: Cold Regions Hy-drology High-resolution Observatory for snow and cold land pro-cesses, Proc. IEEE, 98, 752–765, 2010.
Schneebeli, M. and Johnson, J.: A constant-speed penetrometer for high-resolution snow stratigraphy, Ann. Glaciol., 26, 107–111, 1998
Schwank, M., Wiesmann A., Werner, C., Mätzler, C., Weber, D., Murk A., Völksch, I., and Wegmüller, U.: ELBARA II, an L-band radiometer system for soil moisture research, Sensors, 10, 584–612, 2010.
Strozzi, T., Wiesmann, A., and Mätzler, C.: Active Microwave sig-natures of snow covers at 5.3 and 35 GHz, Radio Sci., 32, 479– 495, 1997.
Takala, M., Luojus, K., Pulliainen, J., Derksen, C., Lemmetyinen, J., Kärnä, J.-P., Koskinen, J., and Bojkov, B.: Estimating northern hemisphere snow water equivalent for climate research through assimilation of space-borne radiometer data and ground-based measurements, Remote Sens. Environ., 115, 3517–3529, 2011. Tan, S., Chang, W., Tsang, L., Lemmetyinen, J., and Proksch, M.:
Modeling both active and passive microwave remote sensing of snow using dense media radiative transfer (DMRT) theory with multiple scattering and backscattering enhancement, IEEE J. Se-lect. T. App. Earth Obs. Remote Sens., 8, 4418–4430, 2015. Werner, C., Wiesmann, A., Strozzi, T., Schneebeli, M., and
Mätzler, C.: The SnowScat ground-based polarimetric scat-terometer: Calibration and initial measurements from Davos Switzerland, in: Geoscience and Remote Sensing Sym-posium (IGARSS), 2010 IEEE International, 2363–2366, doi:10.1109/IGARSS.2010.5649015, 2010.