A 3D Simulation of Bolted Joint and Fatigue Life
Esti-mation Using Critical Distance Technique
N. Habibi
∗, M. Amoorezayi
Mechanical Engineering Department, Faculty of Engineering, University of Kurdistan, Sanandaj, Iran.
Article info
Article history:Received 08 March 2019 Received in revised form 25 August 2019
Accepted 15 Semtember 2019
Keywords:
Critical distance technique Bolted joints
Three-dimensional simulation Fatigue life estimation Preload
S-N curve
Abstract
Bolted joints are one of the most common joints in the industry and assemble the most of the machine elements and segments together. Majority of struc-tures are affected by fluctuating forces, therefore there is the risk of fatigue failure that causes countless damages, thus fatigue life estimation of bolted joints have always been important. The value of high stress concentration at the threads root especially first engaged thread causes problems for fatigue life estimation, since by applying stresses lower than yield stress of the bolt material, plastic deformation occurs at zones of thread root that reach to ultimate stress but fracture does not happen and in some cases bolt-nut joints have infinite life, so that maximum stress at thread root is not fatigue life determinant. The modified critical distance technique and expressed stress at this distance were used for determination of fatigue life in joint. In this study, the bolted joint fatigue life prediction using critical distance technique was compared to experimental results. The three-dimensional finite element analysis for bolted joint was performed. Pre-tightening process and tensile axial force were simulated in ABAQUS software after applying two steps of force including rotation displacement to the center of the nut due to clamping joints (applied torque) and tensile force, the stress distribution resultant of different tensile forces by application of the critical distance technique and mechanical properties fatigue life were determined, and S-N curve prediction matched well with experimental data.
Nomenclature
∆σw0 The fatigue endurance limit KIC The fracture toughness of material
σB The fatigue strength of material L The nut length
∆Kth The coefficient of the crack growth threshold p The pitch of the bolt rp′ The critical distance of low cycle fatigue
(high stress)
rp The critical distance of high cycle fatigue (low stress)
1. Introduction
Since centuries ago, human beings have applied threaded joints in engineering structures. It is so ap-plicable in any types of machinery for its easy
instal-lation and separation. The existence of discontinuity on the surface of the screw causes the stress concen-tration. As long as alternative loading influences most of the structures, it leads to fatigue fracture in connec-tions that results in vital and economical damage. In
∗Corresponding author: N. Habibi (Assistant Professor)
E-mail address: [email protected]
http://dx.doi.org/10.22084/jrstan.2019.18275.1085 ISSN: 2588-2597
order to prevent the failure of these joints, there are numerous investigations about creating the analysis of the connections. The stress distribution in the regions with high stress concentration, further examination of the techniques reduced stress and improved the fatigue life. In order to estimate the fatigue life of the bolted joints, this subject must be considered that due to high stress concentration in the thread roots during the ini-tial stages of loading, this region enters plastic phase. Among the effective factors on fatigue life (the amount of preload, coarse, and fine threads) are the significant factors. It is noteworthy that maximum concentration factor takes place in the first thread between the bolt and nut, and the researchers concluded that the stress concentration in these zones by changing the shape of the thread reduced. Since the early nineteenth century, the stress distribution in threaded joints has been stud-ied. The theoretical evaluation of maximum stress in the root of the threads depends on the load distribu-tion between the involved threads. Researchers such as Maduschka [1] and Sopwith [2] introduced the theories that verified by photoelectric experiments. This theory was formulated by Stoeckly and Macke [3] in 1952 as a load distribution for bolt and nut joints.
In 1986, Peterson and Kenny [4] performed a frozen stress photo-elasticity test and compared photo-elastic stress distribution to the Stoeckly stress distribution equation, and concluded that before loading of the joint, the level of the nut face reached to the maxi-mum stress, and by increasing the distance from the contact surface of the nut and bolt, stress decreases. Maruyama [5] for the first time obtained the stress dis-tribution for bolted joint by finite element method.
Piscan et al. [6] utilized classical theory for con-nection analysis and considered bolts and members as linear and parallel springs. Whereas before loading, the bolted joint was tightened so so a nonlinear strain was created therein. Piscan modeled bolted joint using the Ansys software regardless of the thread, and found that strain decreases nonlinearly by increasing the stiff-ness of the contact point that is non-linear. Williams et al. [7] studied laboratory methods, classical theory, and simulation by Ansys software; simulation was ac-complished in two ways: first simple model (without thread), second advanced mode (all of the design de-tails and plastic specifications included); he examined the effect of increasing external load on the bolt applied force.
Lehnhoff et al. [8] calculated member stiffness were by considering stress distribution of the bottom sur-face of the bolt head uniformly, while Haidar et al. [9] proposed third order function as stress distribution. He also presented a new relationship for the members’ stiffness, and results matched well with the experimen-tal data and results from Ansys software. Zhang and Poirier [10] considered the members’ stiffness as a func-tion versus external force, because when the external
force is added, the surface of the contact changes and the stiffness is a function of the applied force. Dragoni [11] and Waltermire [12] examined the effect of thread pitch and nut shape on stress concentration. One of the remarkable studies on effective factors on fatigue life is Majzoobi’s research and et al. [13]. They stud-ied the bolted joint under sinusoidal loading during experimental study using Instron universal apparatus. The results showed that the coarse thread bolts have a longer fatigue life than the fine thread bolts. Among the connections, the bolted joint with the slotted ta-pered nut and the spring washer has the highest fatigue life than the other joints [14].
Knight et al. [15] examined the effects of factors such as preload, and the area of the spring washer surface on the connection reaction during loading in a structure with two L-shaped sections that were con-nected by a bolt. Esmaeili et al. [16] showed that in both experimental and numerical methods by in-creasing the twisting torque of double lap simple bolted and hybrid (bolted/bonded), fatigue life improves due to compressive stress distribution around the hole in the plate. In addition, the compound connection has a longer fatigue life than a simple connection. Biehl [17] simulated tightening torque by ABAQUS software to obtain nut coefficient and the torque simulated as boundary conditions. He also carried out several ex-periments, and obtained preloads for each torque and finite element results matched well with experiment data.
dramatically decrease the maximum local stress in the root of the threads is increase in the roots radius in the trapezoid thread bolts with large diameters.
In the research of Selah by employing ANSYS Workbench software and three-dimensional finite ele-ment simulation, failure analysis of hybrid bonded and bolted single and double lap joints with laminated com-posite adherents subjected to axial, shear, and bending loads were performed [23]. Cojocaru and Korka [24] us-ing two-dimensional modelus-ing showed that by increase in the root radius of the threads, stress decreases. Re-cently, Jasztal and Regowski [25] studied fatigue life analysis of the bolted joints using ANSYS software. They presented ways to modify the fatigue life of the bolted joints. Furthermore, they described preload by means of mathematical relations and illustrated the preload effect mechanism on fatigue strength, graph-ically.
Yu et al. [26] investigated high-temperature low-cycle fatigue life prediction and experimental research of pre-tightened bolts; a new low-cycle fatigue model based on the Von-Mises equivalent stress/strain crite-rion was proposed, meanwhile, the proposed model was used to predict low-cycle fatigue life of pre-tightened bolts in the high temperature according to the finite element analysis results. In the review paper of Sus-mel [27], it was clearly shown that the critical distance technique is successful in predicting the high-cycle fa-tigue strength of real mechanical components weak-ened by different geometrical features and subjected to both uniaxial and multiaxial fatigue loading. Stress distribution in a bolted joint was obtained in a three-dimensional model with proper accuracy. From the innovations of the article, it is possible to apply the critical distance technique for the first time in order to calculate the fatigue life of the bolt and nut joint.
2. Analysis of Bolted Joint in Software
2.1. The Geometry of Model
A bolted joint similar to study of Refs [13, 14] with all its details including thread pitches, thread profiles based on existing standards (including curvature in the root of the threads), with bushes was modeled. The bushes were connected to a fixture, because of the in-crease in the volume of the calculations, the fixture in the modeling was not considered and the force directly with a difference percentage due to the exiting friction was applied to the bushes. Schematic of the fixture and bolted joint with bushes are illustrated in Fig. 1. The fixture can clamp various bolts up to 30mm in di-ameter and 200mm in length. The fixture was made of a material rigid enough to resist fatigue loading (VCN 150) [28]. In Fig. 1, left and right elements at the top of the fixture are not used in modeling.
Since the stress concentration in the threads root,
especially the first thread is very high during loading; therefore, these grooved areas determine the fatigue life and strength of the connection. One of the methods for estimating the fatigue life of the grooved specimens is the critical distance technique. For the first time in this study, the modified critical distance technique was used to estimate the fatigue life of the bolted joint. Therefore, the ABAQUS software was used to deter-mine the location and amount of local stresses using finite element method.
Fig. 1. Schematic of fixture and bolted joint with bush [14].
2.2. Modeling of the Bolted Joint
M12 bolted joint was simulated and analyzed using ABAQUS software. Because of all the details consid-ered, including the bolt pitch, the modeling was three-dimensional. The first step loading, which includes the torque necessary to tighten the connection, was used for the boundary conditions like Biehl research [17]. The geometrical dimensions of bolt are as follows: the external diameter = 12mm, the bolt length equal to 70mm, and bolt pitch= 1.5mm. The modeling of the bolt and nut was done according to DIN 931 and DIN 934 Standards. The hexagonal nut was considered for the bolted joint. The three-dimensional schematic of the bolt and nut, bush and the assembly view of the fixture is illustrated in Fig. 2. The bush was also mod-eled in two parts, similar to the dimensions of the Ref [14]. It is noteworthy that the analysis was performed in the form of linear elastic, only the characteristic of the Poisson’s ratio and the modulus of elasticity of ma-terials are required. The material used to make bolt and nut and Bushes were AISI 1020 and VCN 150, re-spectively. Mechanical properties of AISI 1020, VCN 150 (V155) are shown in Table 1.
that the bolt passes through the inside of the bushes and is tightened using the nut. Of course, in the soft-ware, the bolt was displaced so that the threads in-volved with the bolt and nut with consideration low clearance in accordance with Fig. 3 located in ap-propriate position. The proper clearance between the threads of bolt and nut in the present model was se-lected according to Ref [29].
Fig. 2. The three-dimensional schematic of the bolt (M12), nut, bush and fixture in ABAQUS software.
Table 1
Mechanical properties of AISI 1020 and VCN 150 [28].
Property VCN
150
AISI 1020
Hardness (HB) 111 217
Tensile (Ultimate) strength (MPa) 394.72 744.60 Tensile strength, yield (MPa) 294.74 472.3 Elongation at break (in 50mm) 36.5% 22%
Reduction of area 66% 49.9%
Modulus of elasticity (GPa) 200 210
Bulk modulus (GPa) 140
-Poisson ratio 0.290 0.30
Shear modulus (GPa) 80
-In the first step, the loading was applied as a bound-ary condition for tightening the bolt. Biehl’s research [17], similar to the present problem, was used as ref-erence sample that the bolt tightening angle was ap-plied to the point in the center of the nut. In the second step, the axial tension loading was applied, and was used to estimate the stress distribution for eval-uating the fatigue life. Moreover, the solving method of model selected static-general, in this analysis, the inertia effects were ignored, and the analysis was con-sidered completely static. Four-contact interaction was
considered for all sliding surfaces in the finite element model, that includes the interfaces between mating threads, nut face and lower bush surface, upper and lower flanges surface, surface of the bolt head and the lower bush surface. Bolt shank and hole are not in contact with clearance fit. Contact type was surface to surface. The value of the friction coefficient equal to 0.15 was assigned to all sliding surfaces.
Fig. 3. The schematic of clearance between bolt and nut.
2.3. The Model Meshing
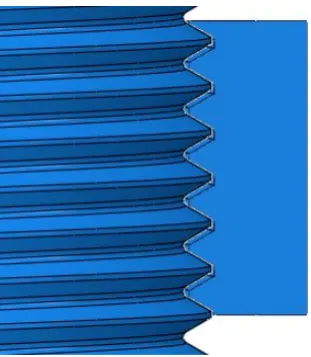
Due to the complexity of the bolt geometry and thread spiral modeling, the tetrahedron element was selected. The maximum concentration of the stress occurs at the threads root, hence finer mesh was assigned to these zones. The bolt and nut were meshed with 4-node linear tetrahedron element (ABAQUS C3D4 element). The meshing of the model (bolt and nut) is illustrated in Fig. 4.
Fig. 4. The meshing of the model (bolt and nut).
2.4. Boundary Conditions and Loading
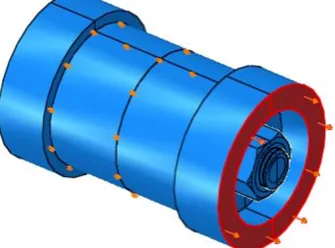
pre-vent lateral translation (θz = 0.07, x= 0, y= 0), the corresponding angle to torque (10Nm) was equal to 0.07 radians. The multi-point constraint as located at the center of the nut, and the nodes around the outer diameter of the nut were connected to each other. A prescribed rotation was applied to the multi-point con-straint. In the second step, the tensile load was applied to the bottom surface of the lower bush as pressure in the opposite direction of the loading boundary condi-tions of the model that is illustrated in Figs. 5 and 6.
Fig. 5. The boundary conditions of the model in soft-ware.
Fig. 6. The stress applied to the bush create tensile in the bolt.
2.5. Validation of Meshing
Mesh density is a significant section that controls ac-curacy of finite element result. By increasing the den-sity of the mesh (decreasing the dimensions of the el-ements), the numerical solution of the problem con-verges to a single solution, hence, mesh congruity should be checked in areas of the model where stresses, strains, contact pressure, or any other parameter that must be accurately calculated.
In order to determine the optimum number of ele-ments, a main parameter, which is the purpose of the analysis of present research, was taken into account, the stress distribution in the threads root was required to calculate the bolted joint fatigue life. The value of the Von-Mises stress obtained from the elements in
critical distance was considered.
Due to the fact that the maximum stress concentra-tion creates in the first thread area, the mesh density in this area was increased. The Von-Mises stress diagram was obtained from the maximum stress point to the center of the bolt as a result, and from the intersection of this diagram with the line of the critical distance be-tween the fatigue strength and the critical distance of the fatigue limit, stress at the critical distance was de-termined. The obtained results for mesh convergence are illustrated in table 2. According to Figs. 13 and 14, it is observed that maximum Von-Mises stress takes place in the threat root and minimum stress belongs to bolt center. In this analysis, the number of elements were equal to 6749.
Table 2
The convergence mesh for Von-Mises stress, axial loading = 47.68kN.
The Von-Mises stress in critical distance (MPa)
The number of elements
238.75 2458
325.21 3542
405.82 4876
487.24 5360
494.73 6849
3. Fatigue Life Estimation Using Critical
Distance Technique
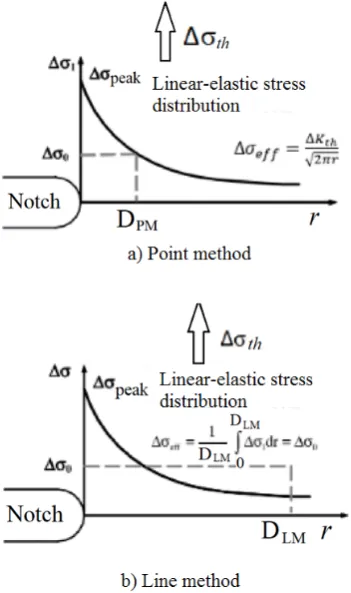
The critical distance technique is one of the most ef-fective techniques for estimation of the fatigue life and strength of materials. Neuber [30], after determination of the relation for the characteristic length, showed that the damage due to the real stress was the average stress fluctuation pattern in the fatigue region (Notch sur-rounding zone); he formulated this relation and called it the linear method. Several years later, Peterson [31] presented a point method, after Tanaka researches [32], Atzori et al. [33] and Taylor [34], finally, the relation-ship was simplified as follows [35].
L= 1
π (
∆Kth
∆σ0 )2
(1)
specimen will fail in the first cycle.
rp′ = 1 2π
( KIC
σB )2
(2)
Where the parameters of KIC and σB are fracture toughness and fatigue strength of the material, respec-tively and rp′ is critical distance for low-cycle fatigue
(high stress).
rp=
1 2π
(
∆Kth
∆σw0
)2
(3)
where ∆Kth is the threshold crack growth coefficient,
∆σw0 is fatigue endurance limit andrP is critical dis-tance in high-cycle fatigue (low stress). Therefore, in-terpolation of two points create a line, which intersects with the stress distribution diagram, the critical dis-tance is determined for the specified load by reflecting the stress that is calculated using critical distance on S-N curve, corresponding fatigue life is determined at the obtained stress distribution and for other loadings repeated and for each loading, fatigue life is predicted, therefore by connecting the points, S-N curve is created [37]. Determination of the critical distance using stress distribution with point and line methods is illustrated in Fig. 7.
Fig. 7. Determination of the critical distance using stress distribution with point and line methods [27].
A flowchart of the present work procedure is shown in Fig. 8.
Fig. 8. A flowchart of present work procedure.
4. Results and Discussion
4.1. Numerical Results
Fig. 9. The Von-Mises stress created in the model.
Fig. 10. A view of the concentration of Von-Mises stress in the root of the bolt threads.
Fig. 11. Distribution of the obtained stress according to Bill research [17].
4.2. The Fatigue Life Estimation
In this section, fatigue life for bolted joint is esti-mated by the critical distance technique and the results are compared with experimental results. The applied
stresses on bolted joint according to the Majzoobi ex-perimental tests [13] are illustrated in Table 3. The re-sults of the stress distribution are used in this section. Due to the repetition of method for different forces, only detailed steps for estimation of the highest stress loading is explained. According to previous studies, the highest concentration of stress occurs in the first root zone of engaged threads, as shown in Fig. 12. Using the nodal coordinates of maximum Von-Mises stress and the center of the bolt cross-section, the path on model was defined. Then, by determining the max-imum Von-Mises stress, the nodal coordinates are esti-mated and path of this node to point in the bolt center on cross-section is determined, this path is illustrated in Fig. 13.
Table 3
The applied tensile loading on model [13]. The number
of test
Applied force (kN)
Applied stress (MPa)
1 47.84 567.54
2 43.06 510.78
3 38.73 454.03
4 33.53 397.28
5 28.71 340.52
6 18.18 215.66
Fig. 12. Stress distribution in the first thread root area, axial load= 47.84kN.
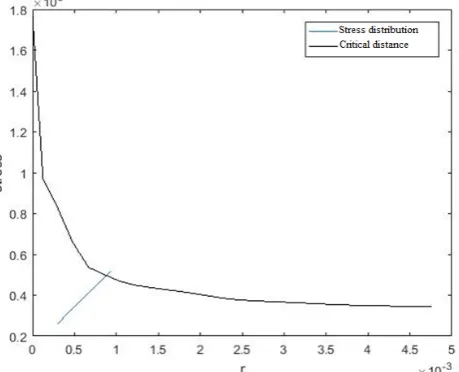
As a result, the stress distribution diagram based on the distance from the node (the location of the highest concentration of stress) for applied loading (force= 47.84kN) to the bottom of the nut is illustrated in Fig. 14. The AISI 1020 crack growth curve is avail-able for the load ratio (stress) equal to 0.1 and 0.7 in Ferreira’s research et al. [38], since the stress ratio (R) in Majzoobi study was equal to zero, the initial torque applied on the connection, causes a small elongation in the bolt, in which R = 0.1 is considered, and the crack growth pattern (Fig. 15) was used. The values of the parameters used to estimate the fatigue life are as below [38]:
∆Kth= 11.6MPa
√
m, KIC= 40MPa
√ m,
σB= 520MPa, ∆σw0 = 0.504Sut, ∆σw0= 262MPa
Fig. 14. Stress distribution curve, applied load equal to 47.84kN.
The values of endurance limit and critical fatigue strength distance are equal to 0.3mm and 0.94mm, re-spectively. By interpolation of the critical distances on fatigue limit, a line is obtained after the intersec-tion of stated line with the stress distribuintersec-tion diagram (Fig. 16), the obtained point is fatigue limit that de-termines fatigue life by reflecting this point on the S-N curve, the amount of fatigue life for specified loading was estimated equal to 59280 cycles, as illustrated in Fig. 17, fatigue limit stress is equal to 494.737MPa, when tensile stress is equal to 563.758MPa applied.
The mentioned steps repeated for different ap-plied stresses, and the fatigue S-N curve critical dis-tance technique was compared with experimental re-sults (Fig. 18). In addition, the comparison of the data obtained from the present study and the experi-mental results are illustrated in Table 4.
Table 4
The comparison of the data obtained from the present study and the experimental results.
Applied stress (MPa)
Fatigue life (experiment) [Ref. 13]
Fatigue life (critical distance Technique)
216.107 515011 475059
338.255 156193 154150
389.933 101343 114624
446.309 69386 90909
507.383 56607 67190
563.758 43585 59280
Fig. 15. The AISI 1020 crack growth curve [38].
Fig. 17. Experimental S-N curve [13].
Fig. 18. The comparison of experimental [Ref. 13] and critical distance technique fatigue life.
5. Conclusions
In this study, a three-dimensional finite element model of the bolted joint considering helix angle for threads was analyzed to simulate two steps, including pre-tightening process and axial tensile loading. Due to the applied linear elastic analysis method, stress in the threads root exceeds yield stress of the material, and singularities occur in these regions. Therefore, the ap-propriate method for fatigue life estimation of notched specimens must be utilized. In this research, the modi-fied Critical Distance Technique was applied for fatigue life estimation, in addition to estimation of the high-cycle fatigue life, which also covers low-high-cycle fatigue life.
According to the comparison of the data obtained from the present study and the experimental results ac-cording table 4, the fatigue life in low-cycle fatigue has better correspondence than high-cycle fatigue. There is a good agreement between the results and it can
be concluded that the present technique is suitable for fatigue life prediction of the bolted Joint. It is notewor-thy that the conventional critical technique was only used for calculation of fatigue strength, while the mod-ified method is used to determine the fatigue life. For the first time, the critical distance technique was used to calculate the fatigue life of the bolt and nut joint.
References
[1] L. Maduschka, Bean Spruchung, Von Schrauben Verbandungen and Zweckmabige Gestaltung der Gewindetrager, (Stresses in Threaded Connec-tions and Shape Optimization), Forschung auf dem Gebiete des Ingenie eurwesens, 7(6) (1936) 229-305.
[2] D.G. Sopwith, D. Sc., Wh. Sc., M.I. Mech., E., The distribution of load in screw threads, Proceed-ing of the Institutation of Mechanical Engineers, 159(1) (1984) 373-383.
[3] E.E. Stoeckly, H.J. Macke, Effect of taper on screw-thread load distribution, ASME Trans, 74(1) (1952) 103-112.
[4] E.A. Patterson, B. Kenny, A modification to the theory for the load distribution in conventional nuts and bolts, J. Strain Anal. Eng. Des., 21(1) (1986) 17-23.
[5] K. Maruyama, Stress analysis of a nut-bolt joint by the finite element method and the copper elec-troplating method, Bull. JSME, 17(160) (1974) 442-450.
[6] I. Piscan, N. Predincea, N. Pop, Finite element analysis of bolted joint, J. Manuf. Syst., 5(3) (2010) 167-172.
[7] J.G. Williams, R.E. Anley, D.H. Nash, T.G.F. Gray, Analysis of externally loaded bolted joints: analytical, computational and experimen-tal study, Int. J. Press. Vessels Pip., 86(7) (2009) 420-427.
[8] T.F. Lehnhoff, K.I. Kwang, M.L. Mckay, Mem-ber stiffness and contact pressure distribution of bolted joints, J. Mech. Des., 116 (1994) 550-557.
[9] N. Haidar, S. Obeed, M. Jawa, Mathematical rep-resentation of bolted-joint stiffness: a new sug-gested model, J. Mech. Sci. Tech., 25(11) (2011) 2827-2834.
[11] E. Dragoni, Effect of thread pitch and frictional coefficient on the stress concentration in metric, Bolt Connections, J. Offshore Mech. Arct. Eng., 116(1) (1994) 21-27.
[12] W.G. Waltermire, A fresh look at a basic question: Coarse or fine threads, Mach. Des., 32 (1960) 134-140.
[13] G.H. Majzoobi, G.H. Farrahi, N. Habibi, Experi-mental evaluation of the effect of thread pitch on fatigue life of bolts, Int. J. Fatigue, 27(2) (2005) 189-196.
[14] G.H. Majzoobi, G.H. Farrahi, S.J. Hardy, M.K. Pipelzadeh, N. Habibi, Experimental results and finite element predictions of the effects of nut ge-ometry, washer and Teflon tape on the fatigue life of bolts, Fatigue Fract. Eng. Mater. Struct., 28(6) (2005) 557-564.
[15] N.F. Knight, D.R. Phillips, I.S. Raju, Simulat-ing the structural response of a preloaded bolted joints, American Institute of Aeronautics and Astronautics, (2019) 1-21, DOI: 10.2514/6.2008-1842.
[16] F. Esmaeili, T.N. Chakherlou, M. Zehsaz, In-vestigation of bolt clamping force on the fa-tigue life of double lap simple bolted and hybrid (bolted/bonded) joints via experimental and nu-merical analysis, Eng. Fail. Anal., 45 (2014) 406-420.
[17] A. Biehl, A finite element analysis based approach to determining the nut factor, Master of Mechani-cal Engineering Thesis, Rensselaer Polytechnic In-stitute, Hartford, CT, Final Report, (2015).
[18] T. Fukuoka, M. Nomura, Proposition of helical thread modeling with accurate geometry and fi-nite element analysis, J. Pressure Vessel Technol., 130(1) (2008) 0112041- 0112046.
[19] Y. Hu, B. Yang, Sh.D. Nie, G.X. Dai, Performance of high strength structural bolts in tension: effects of tolerance classes, International Conference on Performance-based and Life-cycle Sructural Engi-neering, Brisbane, QLD, Australia (2015) 776-781.
[20] X. Chen, N.A. Noda1, M.A. Wahab, Y.I. Akaishi1, Y. Sano, Y. Takase, G. Fekete, Fatigue failure analysis for bolt-nut connections having slight pitch differences using experimental and fi-nite element methods, Acta Polytechnica Hungar-ica, 12(8) (2015) 61-79.
[21] Q.M. Yu, H.L. Zhou, Finite element study on pre-tightening process of threaded connection and fail-ure analysis for pressfail-ure vessel,14thInternational
Conference on Pressure Vessel Technology, 130 (2015) 1385-1396.
[22] Sh. Yosefzadeh, S. Torabi, Study and analysis of methods to reduce stress concentration in threads of bolt and nut joints, 1th National Conference on Civil Engineering and Geology, May 13-14, (2015) Aligudarz, Iran (In Persian).
[23] E. Selahi, Failure study of hybrid bonded-bolted composite single and double lap joint, J. Stress Anal., 3(2) (2019) 37-46.
[24] V. Cojocaru, Z.I. Korka, Influence of thread root radius on maximum local stresses at large diam-eter bolts under axial loading, Analele Universi-tatii, Eftimie Murgu, Resita, Anul XXI, NR (1) (2014) 85-90.
[25] M. Jasztal, M. Regowski, Fatigue life analysis of bolt joints with use of ANSYS software, Mechanik, 91(7) (2018) 600-602.
[26] Q. Yu, H. Zhou, X. Yu, X. Yang, High-temperature low cycle fatigue life prediction and experimental research of pre-tightened bolts, Met-als, 8(10) (2018) 1-14.
[27] L. Susmel, The theory of critical distances: a re-view of its applications in fatigue, Eng. Fract. Mech., 75(7) (2008) 1706-1724.
[28] J.R. Davis, Metals Handbook, ASM International. Handbook Committee, CRC Press, (1998).
[29] K.H. Brown, C. Morrow, S. Durbin, A. Baca, Guideline for bolted joint design and analysis: ver-sion 1.0, Sandia report, SAND2008-0371, Unlim-ited Release, Printed January (2008).
[30] H. Neuber, Theory of Notch Stresses: Principles for exact calculation of strength with reference to structural form and material, 2nd ed. Berlin: Springer Verlag, (1958).
[31] R.E. Peterson, Notch Sensitivity. In: G. Sines, J.L. Waisman, Eds. Metal Fatigue, New York, Mc-Graw Hill Publisher, (1959) 293-306.
[32] K. Tanaka, Engineering formulae for fatigue strength reduction due to crack-like notches, Int. J. Fract., 22(2) (1983) 39-46.
[33] B. Atzori, P. Lazzarin, R. Tovo, Evaluation of the fatigue strength of a deep drawing steel, 137 (1992) 556-561.
[34] D. Taylor, Geometrical effects in fatigue: a unify-ing theoretical model, Int. J. Fatigue, 21(5) (1999) 413-420.
[36] T. Hattori, M.A.B.A. Wahab, T. Ishida, M. Ya-mashita, Fretting fatigue life estimations based on the critical distance stress theory, Procedia Eng., 10 (2011) 3134-3139.
[37] L. Susmel, The theory of critical distances: a re-view of its applications in fatigue, Eng. Fract. Mech., 75(7) (2008) 1706-1724.
![Fig. 1. Schematic of fixture and bolted joint with bush[14].](https://thumb-us.123doks.com/thumbv2/123dok_us/8954874.1864242/3.595.312.545.223.427/fig-schematic-fixture-bolted-joint-bush.webp)
![Fig. 11. Distribution of the obtained stress accordingto Bill research [17].](https://thumb-us.123doks.com/thumbv2/123dok_us/8954874.1864242/7.595.311.549.297.564/fig-distribution-obtained-stress-accordingto-research.webp)
![Fig. 17. Experimental S-N curve [13].](https://thumb-us.123doks.com/thumbv2/123dok_us/8954874.1864242/9.595.64.304.94.489/fig-experimental-s-n-curve.webp)
