I. Introduction and Background
A
web service is a self-describing software application which can be advertised, located and used over the Internet [5]. To initiate the provisioning of web service, a user must first identify the service that is desired. “How will I effectively select the web service that will meet my performance requirements?” [1]; the answer to this question, however, still remains a challenge faced by the user because of numerous services sharing similar functionalities in the web environment. The rise in the number of Web Services has been caused due to growing demands of increasing the flexibility of IT infrastructure in order to support rapidly evolving business needs [2]. The selection of web services is not only limited to meeting the users’ needs, but also, non-functional information, including, reliability, response time, etc. [3].A. Motivation
A Web Service can also be viewed as one of the encouraging technologies that could help business units to systematize their web operations on a large scale by automatic discovery and consumption of services [5]. In the Web Service Architecture [6], the Service Requester (client or user) may receive a pool of web services from the Service Provider (server) as per the initial query in “Service Discovery” stage. Subsequently, in “Service Selection” stage, the “best” web service, which satisfies all the constraints set by the original requester, is
selected from the pool. This process of service filtration is carried out based on the degree of satisfaction to the users’ non-functional requirements known as Quality of Service (QoS) parameters. For example, while booking flights or downloading music, there exists a number of available services sharing identical functionalities, however, they exhibit different QoS. A web service with remarkable QoS can deliver big competitive influence to service providers while bringing the social prosperity to service consumers. It has been acknowledged from the literature that due to intensive global competition, the experts recognize the decision on web service selection an important activity.
B. Quality of Service (QoS) Parameters for Web Service
Selection
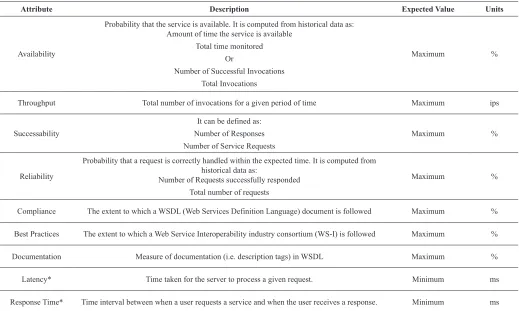
The QoS based Web Service selection has gained the attention of many researchers in recent years, since maintaining the quality of their web services has become the topmost priority of each web service provider. In this paper, therefore, the activity of web service selection is carried out based on both functional as well as non-functional QoS parameters [4, 11]. QoS attributes are measured on a scale of 0 to 9. To facilitate the description, the set of QoS attributes is divided into two subsets: Benefit (Positive) attributes and Cost (Negative) attributes, as shown in Table I. The values of positive attributes need to be maximized, whereas the values of negative attributes need to be minimized. For the sake of simplicity, the values closer to 9 for benefit criteria and closer to 1 for cost criteria are considered good.
C. Multi-Criteria Decision Making (MCDM) Methods
In past many years, Multi-Criteria Decision Making (MCDM) DOI: 10.9781/ijimai.2017.12.001
Keywords
AHP, COPRAS, SAW, Spearman’s Rank Correlation Coefficient, TOPSIS, VIKOR.Abstract
With the continuing proliferation of web services offering similar efficacies, around the globe, it has become a challenge for a user to select the best web service. In literature, this challenge is exhibited as a 0-1 knapsack problem of multiple dimensions and multiple choices, known as an NP-hard problem. Multi-Criteria Decision Making (MCDM) method is one of the ways which suits this problem and helps the users to select the best service based on his/her preferences. In this regard, this paper assists the researchers in two conducts: Firstly, to witness the performance of different MCDM methods for large number of alternatives and attributes. Secondly, to perceive the possible deviation in the ranking obtained from these methods. For carrying out the experimental evaluation, in this paper, five different well-known MCDM methods have been implemented and compared over two different scenarios of 50 as well as 100 web services, where their ranking is defined on an account of several Quality of Service (QoS) parameters. Additionally, a Spearman’s Rank Correlation Coefficient has been calculated for different pairs of MCDM methods in order to provide a clear depiction of MCDM methods showing the least deviation in their ranking. The experimental results comfort web service users in conquering an appropriate decision on the selection of suitable service.
* Corresponding author.
E-mail address: [email protected]
QoS based Web Service Selection and Multi-Criteria
Decision Making Methods
Pallavi Bagga
1, Aarchit Joshi
2, Rahul Hans
2*
1
Department of Computer Science and Engineering, Lovely Professional University, Phagwara, Punjab
(India)
2
Department of Computer Science and Engineering, DAV University, Jalandhar, Punjab (India)
methods have proven their effectiveness in addressing different complex real-world decision making problems. MCDM methods use knowledge from many fields, including economics, mathematics, behavioral decision theory, software engineering, computer technology and information systems [9]. In the context of this paper, the goal of MCDM methods is to find one web service from a pool of several web services such that the QoS is optimized and users’ end-to-end QoS requirements are satisfied. In MCDM methods, each problem is stated in matrix design as:
C1 … Cn
A1 x11 … x1n
… … … …
Am xm1 … xmn
where,
A1, A2, … Am are possible ‘m’ alternatives or choices among which decision makers have to choose, C1, C2, ..Cn are possible ‘n’ criteria or attributes the basis of which the alternatives are ordered or selected,
xij is the rating of alternative Ai with respect to criterion Cj.
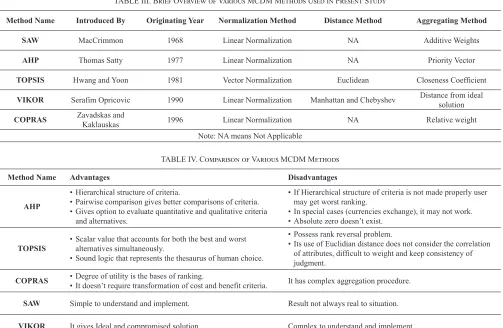
The general flowchart of MCDM method is shown in Fig 1. The sensitivity analysis is done to address the problems of uncertainty, imprecision, and inaccurate determination [10]. Various MCDM methods used for web service selection in the literature are briefly summarized in Table II, however Tables III and IV conveys overview and the advantages and disadvantages of various MCDMs used in this research concluded from literature by the authors. For a particular case, two or more MCDM methods often generate different rankings of web services.
D. Objectives of Present Research
The objectives of present study can be stated as follows: • To address the problem of web service selection based on QoS. • To study how service consumers are benefited by selecting the
appropriate Web Service based on QoS using MCDM in literature. • To implement and compare five different MCDM methods (AHP,
TOPSIS, SAW, VIKOR and COPRAS) with two different large sets of web services (50 and 100) against 9 QoS attributes. To evaluate the deviation in the rankings of different MCDM methods using Spearman’s Rank Correlation Coefficient and to conclude which MCDM methods produce similar ranking.
E. Organization of Paper
The remainder of this paper is organized as follows: Section 2 throws light upon the dataset and several methods used for present study. Section 3 discusses the results from experimental evaluation. Finally, the conclusion and highlights on possible continuations of this work are addressed in Section 4.
II. Material and Methods
A. Dataset Used
The Quality of web service (QWS) dataset version 2.0 [12, 43] is chosen for the present study. This dataset includes a set of 2,507 web services and their QWS measurement which were conducted in 2007, using Web Service Broker (WSB) framework. Each row in the dataset represents a web service and its corresponding QWS measurements on nine different QoS parameters. In this paper, two different sets of 50 and 100 web services have been constructed by random sampling for the experimental study of various MCDM methods.
B. Various MCDM Methods
MCDM methods help in selecting the optimal one from a set of alternatives with respect to the predefined set of attributes. MCDM methods are continuously growing in the application areas of Business, Mathematics, Decision Sciences, Management and Accounting, Social Sciences, Medicine, Environmental Science, Economics, Econometrics and Finance, etc. [19]. In this paper, for QoS based web service selection, five different existing MCDM methods are taken into account: Simple Additive Weighting (SAW) [15], Analytic Hierarchy Process (AHP) [14], Technique for Order Preference by Similarity to Ideal Solution (TOPSIS) [9], VIšekriterijumsko KOmpromisno Rangiranje (VIKOR) [17] and COmplex PRoportional ASsessment (COPRAS) [18]. These methods are summarized in Tables III and IV. The general formal definition of MCDM is represented in (1):
mcdm
k{f
k(A
ij)}
(1)
where,
i=1,2,…,I; k=1,2,..,K ; j=1,2,…,J
k is the set of different MCDM methods, i.e. k ={AHP=1, TOPSIS=2, COPRAS=3, VIKOR=4, SAW=5}
I is the number of alternatives J is the number of criterion
f is the Aggregating function/method
Aij is the decision matrix A obtained by taking criteria ‘i’ and alternative ‘j’ as row and column respectively
C. AHP (Analytical Hierarchy Process)
Suppose J represents the number of criterion and ajk represents the importance of jth criterion relative to kth criterion in PC matrix. The AHP consists of following steps [14]:
i) Breaking down of a problem into a hierarchy of decision criteria and alternatives.
ii) Relative importance of each criterion is measured with respect to other criterion, which is known as Pairwise Comparison PC process. The consistency checks are also performed while the evaluations are made by the decision makers.
iii) Normalization of pairwise comparison matrix by using (2.1).
Ajk = J ajk ∑i=1 aik
where, j=1,2….J; k=1,2,….J
(2.1)
iv) The Criteria Weight Vector is built with the help of (2.2).
Wj =
J∑ i=1 aik
J
where j=1,2,…J
(2.2)
v) Obtaining the matrix S of scores of alternatives as shown in (2.3).
S = [s
1, s
2,…..s
J]
(2.3)
vi) Using (2.4) to calculate the matrix of global scores V.
V = S. W
(2.4)
Fig. 1. General Flowchart of MCDM Method.
TABLE I. Various QoS Attributes Used for Web Service Selection [7-8, 27]
Attribute Description Expected Value Units
Availability
Probability that the service is available. It is computed from historical data as: Amount of time the service is available
Total time monitored Or
Number of Successful Invocations Total Invocations
Maximum %
Throughput Total number of invocations for a given period of time Maximum ips
Successability
It can be defined as: Number of Responses Number of Service Requests
Maximum %
Reliability
Probability that a request is correctly handled within the expected time. It is computed from historical data as:
Number of Requests successfully responded Total number of requests
Maximum %
Compliance The extent to which a WSDL (Web Services Definition Language) document is followed Maximum %
Best Practices The extent to which a Web Service Interoperability industry consortium (WS-I) is followed Maximum %
Documentation Measure of documentation (i.e. description tags) in WSDL Maximum %
Latency* Time taken for the server to process a given request. Minimum ms
Response Time* Time interval between when a user requests a service and when the user receives a response. Minimum ms
TABLE II. Summary of MCDM Based Existing Related Researches
Reference No. Authors Year Publisher CitationsNo. of CriteriaNo. of MCDM Target area
[34] Shaikh et al. 2004 IEEE 10 3 AHP E-business processes
[33] Chemane et al. 2005 IEEE 3 4 AHP Internet Access Technology
[30] Colace et al. 2006 IEEE 40 5 AHP E-learning
[26] Zhuang et al. 2007 IEEE 8 NS Fuzzy Multi-Attributive Group Decision-Making Web Service Selection
[38] Xiong et al. 2007 IEEE 53 6 Fuzzy MCDM Web service selection
[29] Godse et al. 2008 IEEE 23 5 AHP Prioritizing Web Service Features
[16] Tseng 2009 Elsevier 210 21 Grey theory, Fuzzy theory, DEMATEL Customer Service Quality Expectation
[25] Sun et al. 2009 Elsevier 140 12 Fuzzy TOPSIS Shopping Websites
[40] Pervaiz 2010 IEEE 35 4 AHP Access Network Selection in WLAN
[41] Yang et al. 2010 IEEE 0 4 CRML, TOPSIS Cross-organizational service selection
[37] Karim et al. 2011 IEEE 21 9 Enhanced PROMETHEE Web Services
[39] Garg et al. 2011 IEEE 193 6 AHP Cloud Services Ranking
[36] Luo et al. 2012 Elsevier 20 6 SAW Wireless Network
[31] Park et al. 2013 Springer 13 6 Pairwise comparison Enterprise Resource Planning
[32] Sun et al. 2013 IEEE 17 5 AHP Consumer-centered Cloud services
[35] Fakhfakh et al. 2013 Springer 4 3 MACBETH integrated with 2-additive Choquet integral Degree of Service Orchestrations Measurement
[28] Dragović et al. 2014 Taylor & Francis 14 5 AHP, Fuzzy Logic Web services
[27] Almulla et al. 2015 Elsevier 5 9 FDCRT, FSIRT Real world web services
[21] Lin et al. 2016 Elsevier 0 5 Hybrid of DEMATEL, PCA, ANP, VIKOR Digital Music Services
[20] Huang et al. 2016 Springer 0 6 DEMATEL, DANP Social Networking sites
[22] Lozano et al.Sánchez- 2016 Elsevier 5 10 Fuzzy AHP, Fuzzy TOPSIS Geographical Information System
[23] Gupta et al. 2016 Springer 0 6 Ordered Weighted Operators Handling Outliers in Web Data
[24] Rhimi et al. 2016 IEEE 0 NS Fuzzy logic, TOPSIS Skyline computation
[42] Taibi et al. 2017 SoftwareIMAI 0 4 Fuzzy AHP Industrial Site Selection
Note: #Citations are taken up to November 2016, NS means Not Specified
DEMATEL: Decision MAking Trial and Evaluation Laboratory, ANP: Analytical Network Procedure, PCA: Principal Component Analysis, DANP: Decision MAking Trial and Evaluation Laboratory based Network Process, FSIRT: Fuzzy Interval-based Ranking Technique, FDCRT: Fuzzy Distance Correlation Ranking Technique, MACBETH: Measuring Attractiveness by a Categorical Based Evaluation TecHnique, SAW: Simple Additive Weighting,
D. TOPSIS (Technique for Order Preference by Similarity to
Ideal Solution)
Suppose I represents the number of alternatives and J represents the number of criterion; xij is the value assigned to ith alternative with respect to jth criterion. The TOPSIS consists of following steps [9]:
i) Normalization of decision matrix using (3.1).
rij = xij [ I∑
k=1 (xkj)2 ]1/2
where i=1,2…I, j=1,2,….J
(3.1)
ii) Calculation of the weighted normalized decision matrix using (3.2).
v
ij= w
j. r
ij(3.2)
where W={w1,w2,…wJ}=relative weight about the criterion iii) Determination of the positive ideal and negative ideal solutions
which maximizes and minimizes the benefit criteria and cost criteria respectively using (3.3) and (3.4).
A+ = {v
1+, v2+,……..vJ+}
= {maxj vij | j∈ set of Benefit Criteria,
min
j, v
ij| j
∈
set of Cost Criteria}
(3.3)
A- = {v1-, v2-,……..vJ-} = {minj vij | j ∈ set of Benefit Criteria,
max
jv
ij| j
∈
set of Cost Criteria}
(3.4)
iv) Calculation of each alternative from positive ideal solutionand negative ideal solution with the help of (3.5) and (3.6) respectively (Euclidean distance).
+
D
i
= [
J∑
j=1(v
ij–v
j+)
2]
1/2, i=1,2…I
(3.5)
-
D
i
= [
J∑
j=1(v
ij–v
j-)
2]
1/2, i=1,2...I
(3.6)
v) Calculation of the relative closeness of each alternative to the ideal solutions using (3.7).
RCi = -Di +D
i+ -Di
where i= 1,2,…I
(3.7)
vi) Ranking of alternatives is done as per the increasing order of relative closeness. Higher the relative closeness to ideal solution is, better is the alternative.
E. COPRAS (COmplex PRoportional ASsessment)
Suppose I represents the number of alternatives and J represents the number of criterion; xij is the value assigned to ith alternative with respect to jth criterion; q
j represents the significance of jth criterion. The steps of COPRAS are summarized as follows [18]:
i) Normalization of decision matrix using (4.1).
rij = I xij ∑i=1 xij
where i=1,2…I and j=1,2,….J
(4.1)
ii) Calculation of Maximizing Criteria S+ and Minimizing Criteria S- using (4.2) and (4.3) respectively.
S
+i=
J’∑
j=1
r
ij. q
j(4.2)
where i=1,2,…I; j’ is the number of benefit criterion
S-
i=
J’’∑
j=1
r
ij. q
j(4.3)
where i=1,2,…I; j” is the number of cost criterion
iii) Relative weight of each alternative is obtained using 4.4.
Qi = S+i
J∑ i=1 S-i S-i . J∑
i=1 1/S-i
where i=1,2,…I
(4.4)
iv) Ranking of alternatives is done according to the ascending order of relative weight. Higher the relative weight of alternative is, higher is the priority of alternative.
F. VIKOR (VIšekriterijumsko KOmpromisno Rangiranje)
Suppose I represents the number of alternatives and J represents the number of criterion; fji is the value of jth criterion for the ith alternative The VIKOR involves the aforementioned steps [17]:
i) Determination of the best and the worst values of criterion using (5.1) and (5.2) respectively.
+f
j = maxi fji for benefit criterion +f
j = mini fji for cost criterion
where j =1,2,….J
(5.1)
-f
j = mini fji for benefit criterion -f
j = maxi fji for cost criterion
where j =1,2,….J
(5.2)
ii) Computation of the values Sj and Rj using (5.3) and (5.4) respectively.
Si = I∑
i=1
wj (+f j – fji) (+f
j - -fj)
where j =1,2,….J
(5.3)
Ri = maxj [wj (+f
j – fji) / (+fj - -fj)]
where j =1,2,….J
(5.4)
iii) Computation of Qj using (5.5).
Q
i= v(S
i– S
+) / (S
-- S
+) + (1-v)(R
i
– R
+) / (R
-- R
+) (5.5)
where i =1,2,….I; and S- = max
i{Si}; S+ = mini{Si}; R- = maxi{Ri}; R+ =mini{Ri} iv) Three different Ranking of alternatives is done according to
S, R and Q. Lower the value of Q is, better is the alternative. v) The alternative A is considered as the compromised solution if
the following two conditions are satisfied:
DQ=1/(Number of alternatives -1).
- C2-Acceptable stability in decision making: the alternative a1 must also be best ranked by S and R.
vi) If any of the conditions is not true, then the set of compromised solutions are proposed consisting of
- If only C2 is not satisfied, then alternatives a1 and a2 are
proposed.
- If only C1 is not satisfied, then alternatives a1, a2, …am are
proposed; am is determined by the relation Q(am)-Q(a1)˂DQ
for maximum ‘m’ (the positions of these alternatives are “in closeness”).
G. SAW (Simple Additive Weighting)
Suppose I represents the number of alternatives and J represents the number of criterion; xij is the value assigned to ith alternative. The SAW method consists of the following steps [15]:
i) Normalization of decision matrix using (6.1) and (6.2) respectively for cost and benefit criterion.
Vij = xij maxx
j
(6.1)
Vij = minxj
xij
(6.2)
ii) Calculation of weighted normalized values is done using (6.3).
v
ij= Vij . wj
(6.3)
where W={w1,w2,…wJ}=relative weight about the criterion; j=1,2…J
iii) The sum S is calculated correspond to each alternative using (6.4).
Si = J∑ i=1 vij
where i=1,2….I
(6.4)
iv) Ranking of alternatives is done according to the increasing order of S.
H. Spearman’s Rank Correlation Coefficient
The Spearman’s rank correlation coefficient method assists in finding the similarity between two sets of ranking obtained from two different ‘kth’ and ‘ith’ MCDM methods, using (7):
ρ
ki= 1 -
6
n
∑
i=1d
i2n
3-n
(7)
where, n is the number of web services, and di is the difference between the ranks of two MCDM methods. A larger absolute value indicates a good agreement between one MCDM method and other MCDM method [13].
III. Results and Discussions
For carrying out the experiments, two sets of web services are constructed out of present dataset: one set of 50 web services (Scenario 1) and other set of 100 web services (Scenario 2). Five different MCDM methods such as AHP, COPRAS, SAW, TOPSIS, and VIKOR
TABLE III. Brief Overview of Various MCDM Methods Used in Present Study
Method Name Introduced By Originating Year Normalization Method Distance Method Aggregating Method
SAW MacCrimmon 1968 Linear Normalization NA Additive Weights
AHP Thomas Satty 1977 Linear Normalization NA Priority Vector
TOPSIS Hwang and Yoon 1981 Vector Normalization Euclidean Closeness Coefficient
VIKOR Serafim Opricovic 1990 Linear Normalization Manhattan and Chebyshev Distance from ideal solution
COPRAS Zavadskas and Kaklauskas 1996 Linear Normalization NA Relative weight
Note: NA means Not Applicable
TABLE IV. Comparison of Various MCDM Methods
Method Name Advantages Disadvantages
AHP
• Hierarchical structure of criteria.
• Pairwise comparison gives better comparisons of criteria. • Gives option to evaluate quantitative and qualitative criteria
and alternatives.
• If Hierarchical structure of criteria is not made properly user may get worst ranking.
• In special cases (currencies exchange), it may not work. • Absolute zero doesn’t exist.
TOPSIS • Scalar value that accounts for both the best and worst alternatives simultaneously. • Sound logic that represents the thesaurus of human choice.
• Possess rank reversal problem.
• Its use of Euclidian distance does not consider the correlation of attributes, difficult to weight and keep consistency of judgment.
COPRAS • Degree of utility is the bases of ranking.• It doesn’t require transformation of cost and benefit criteria. It has complex aggregation procedure.
SAW Simple to understand and implement. Result not always real to situation.
are implemented in which the weights for different QoS attributes are calculated using AHP method in each scenario. The outline of experiments can be illustrated from Fig 2. The top five ranking of each method for each scenario is shown in Fig 3.
In order to check the consistency of user inputs to QoS attributes, the matrix analysis is usually done for AHP [14, 30], however, this effective technique of checking the evaluations made by the decision maker is used for each method while constructing the pairwise comparison matrices. The formula used for obtaining the Consistency Index is shown in (8).
CI = ((λ
max-n) / (n-1)
(8)
where, n is the matrix size and λmax is the eigen value.
Generally, the value CI = 0 is obtained by a perfectly consistent decision-maker, however, the smaller inconsistency may be tolerated. In particular, the inconsistencies are tolerable and reliable results have been expected from each method, if (9) holds true.
CI / RI < 0.1
(9)
where, RI is Random Index, means the Consistency Index when matrix has entries which are completely random [30], and the ratio CI/ RI is known as Consistency Ratio.
Fig. 2. Outline of Experimental Evaluation Process.
Scenario 1: 50 Web services and 5 MCDM methods (Table V)
AHP method shows 29th, 50th and 18th numbered are the best three web services to be selected, whereas 21st, 6th and 38th numbered are the worst three to be selected. Moreover, COPRAS method produces 29th,
23rd and 50th as the best three web services and 38th, 7th and 27th as worst three web services. On the other hand, using SAW method, 18th, 40th and 30th numbered three best web services are obtained, whereas 21st,
38th and 6th are worst. Furthermore, TOPSIS method gives best three ranks to 29th, 23rd and 50th numbered web services, while worst three ranks to 7th, 6th and 38th. Also, 30th, 19th and 24th numbered are best three web services, while 32nd, 36th and 22nd are worst three web services chosen by VIKOR method.
Scenario 2: 100 Web Services and 5 MCDM methods (Table VI)
AHP method shows 79th, 29th and 50th numbered are the best three web services to be selected, whereas 38th, 96th and 50th numbered are the worst three web services to be selected. While, COPRAS method produces 29th, 23rd and 79th as best three web services and 64th, 77th and
27th as worst three web services. Similarly, using SAW method, 18th, 95th and 40th numbered three best web services are obtained, whereas
6th, 96th and 53rd are worst. On one hand, TOPSIS method gives best three ranks to 29th, 23rd and 79th numbered web services, on the flip side, worst three ranks to 96th, 38th and 53rd. Also, 30th, 56th and 87th numbered are best three web services, while 78th, 22nd and 73rd are worst three web services chosen by VIKOR method.
Clearly, in both the scenarios (1 and 2), rankings obtained from five different MCDM methods in the QoS based Web Service Selection problem yields divergent results. This difference in ranking can be seen due to either the use of different normalization techniques on decision matrix or the use of different aggregating methods in each MCDM method. Further, in order to evaluate the closeness of ranking, for both the scenarios, Spearman’s rank correlation coefficients are calculated using (7).
The closeness of the correlation coefficient value (example, 0.9526), ranging between -1 to 1, in approximation to unity indicates complete dependency and reliability of either of the methods used. The dependency reduces with each unit reduction in the coefficient value. The negative sign indicates reverse trend existing between the two methods i.e. the rank value increasing in one method shall be declining under the second method in comparison. The inter-relationship between the MCDM methods is analyzed through correlation matrix using (7) as shown in Tables VII and VIII. It is found that AHP and TOPSIS show maximum Correlation value i.e. 0.9535 in Scenario 1 (Table VII) and 0.9526 in Scenario 2 (Table VIII), indicating the strongest correlation, as the values are generously high. Thus, it can be concluded that in this web service selection problem, AHP and TOPSIS can be used effectively for making similar types of decisions. All other combinations show positive correlation except COPRAS and VIKOR. These findings hold true for both scenarios of 50 as well as 100 web services.
(b) (a)
TABLE VII
Spearman’s Rank Correlation Coefficients with Respect to Scenario 1
Methods AHP COPRAS SAW TOPSIS VIKOR
AHP - 0.7880 0.6379 0.9535 0.2949
COPRAS 0.7880 - 0.3290 0.8226 -0.0131
SAW 0.6379 0.3290 - 0.4982 0.3886
TOPSIS 0.9535 0.8226 0.4982 - 0.1602
VIKOR 0.2949 -0.0131 0.3886 0.1602
-TABLE VIII
Spearman’s Rank Correlation Coefficients with Respect to Scenario 2
Methods AHP COPRAS SAW TOPSIS VIKOR
AHP - 0.6872 0.7343 0.9526 0.3769
COPRAS 0.6872 - 0.3306 0.7391 -0.0432
SAW 0.7343 0.3306 - 0.6151 0.4748
TOPSIS 0.9526 0.7391 0.6151 - 0.7109
VIKOR 0.3769 -0.0432 0.4748 0.7109
-IV. Conclusions and Future Scope
Nowadays, there is a need to distinguish increasing number of web services with similar functionalities, being made accessible across the Internet, using a set of QoS parameters. The QoS level displays abundant influence on degree of the web service usability as well as effectiveness, both of which further influences the service popularity. In this regard, the problem of web service selection based on QoS using MCDM method is addressed in this paper. Firstly, the rankings of web services are calculated using five different MCDM methods, including AHP, TOPSIS, VIKOR, SAW, and COPRAS. Secondly, since these rankings show divergent results, Spearman’s rank correlation coefficient is used to compute the degree of similarity in the rankings of one MCDM method with other MCDM methods. The whole process is done for two larger sets of web services: 50 (Scenario 1) and 100 (Scenario 2). Maximum co-efficient correlation value is deduced for the combination of AHP and TOPSIS in both the scenarios. The experimental outcomes on different sets of web services using different MCDM methods reveal that AHP and TOPSIS methods show good agreement with each other. In future, the work can be extended using different correlation methods such as Pearson, Kendall or any other correlation method. The more focus can also be put on Rank Reversal problem of MCDM methods.
V. Acknowledgements
The authors express their gratitude to E. Al-Masri and Q. H. Mahmoud for providing the QWS dataset which has supported this research to evaluate MCDM methods on well-validated web services based on different Quality of Service parameters.
R
EFERENCES[1] G. Chang. (2012). QoS-Based Web Service Selection Approach. In: Wu Y. (eds.) Software Engineering and Knowledge Engineering: Theory and Practice, Advances in Intelligent and Soft Computing, Vol. 115, pp. 887-892, Springer, Berlin, Heidelberg.
[2] I. Egambaram, G. Vadivelou and S. P. Sivasubramanian. (2010). QoS Based Web Service Selection. In: The International Conference on Computing, Communications and Information Technology Applications (CCITA-2010).
[3] H. Wang, P. Tong and P. Thompson. (2007). QoS-Based Web Services Selection. In: IEEE International Conference on e-Business Engineering (ICEBE 2007), pp. 631-637.
[4] S. Ran. (2003). A Model for Web Services Discovery with QoS. ACM
SIGecom Exchanges, Vol. 4, No. 1, pp. 1-10.
[5] Y. Liu, A. H. Ngu and L. Z. Zeng. (2004). QoS Computation and Policing in Dynamic Web Service Selection. In: Proceedings of the 13th International World Wide Web Conference on Alternate Track Papers & Posters, New York, USA, pp. 66-73.
[6] S. Haddad, L. Mokdad and S. Youcef. (2010). Selection of the best composite Web service based on quality of service. In: Proceedings of the 2nd International Symposium on Services Science and 3rd International Conference on Business Process and Services Computing (ISSS/ BPSC,’10), pp. 255-266.
[7] S. Susila and S. Vadivel. (2011). Web Service Selection based on QoS Attributes using Entropy Discretization Method. International Journal of Computer Applications, Vol. 30, No. 2, pp. 47-53.
[8] T. Yu and K. Lin. (2005). Service selection algorithms for Web services with end-to-end QoS constraints. Information Systems and e-Business Management, Vol. 3, No. 2, pp. 103-126.
[9] M. Behzadian, S. K. Otaghsara, M. Yazdani and J. Ignatius. (2012). A state-of the-art survey of TOPSIS applications, Vol. 39, pp. 13051-13069.
[10] P. Jankowski. (1995). Integrating geographical information systems and multiple criteria decision-making methods. International Journal of Geographical Information Systems, Vol. 9, No. 3, pp. 251-273.
[11] P. Wang. (2009). QoS-aware web services selection with intuitionistic fuzzy set under consumer’s vague perception. Expert Systems with Applications, Vol. 36, No. 3 (Part 1), pp. 4460-4466.
[12] E. Al-Masri and Q. H. Mahmoud (2007). QoS-based Discovery and Ranking of Web Services. In: 16th IEEE International Conference on Computer Communications and Networks (ICCCN), pp. 529-534.
[13] G. Kou, Y. Lu, Y. Peng and Y. Shi. (2012). Evaluation of classification algorithms using MCDM and rank correlation. International Journal of Information Technology & Decision Making, Vol. 11, No. 1, pp. 197–225.
[14] T. L. Saaty. (2008). Decision making with the analytic hierarchy process. International Journal of Services Sciences, Vol. 1, No. 1, pp. 83-98.
[15] K. Madani, M. Sheikhmohammady. S. Mokhtari, M. Moradi and P. Xanthopoulos. (2014). Social Planner’s Solution for the Caspian Sea Conflict. Group Decision and Negotiation, Vol. 23, No. 3, pp. 579-596.
[16] M.L. Tseng. (2009). A causal and effect decision making model of service quality expectation using grey-fuzzy DEMATEL approach. Expert Systems with Applications, Vol. 36, No. 4, pp. 7738-7748.
[17] H. Liao and Z. Xu. (2013). A VIKOR-based method for hesitant fuzzy multi-criteria decision making. Fuzzy Optimization and Decision Making, Vol. 12, No. 4, pp. 373-392.
[18] M. M. Fouladgar, A. Yazdani-Chamzini, A. Lashgari, E. K. Zavadskas and Z. Turskis. (2012). Maintenance strategy selection using AHP and COPRAS under fuzzy environment. International Journal of Strategic Property Management, Vol. 16, No. 1, pp. 85-104.
[19] R. Rekik, I. Kallel, J. Casillas and A. M. Alimi. (2016). Using Multiple Criteria Decision Making Approaches to Assess the Quality of Web Sites. International Journal of Computer Science and Information Security, Vol. 14, No. 7, pp. 747-761.
[20] C. Y. Huang, H. H. Wu and H. H. Lu. (2016). A MCDM Methods Based TAM for Deriving Influences of Privacy Paradox on User’s Trust on Social Networks. In: International Conference on Industrial, Engineering and Other Applications of Applied Intelligent Systems, pp. 356-363.
[21] C. L. Lin, Y. H. Shih, G. H. Tzeng and H. C. Yu. (2016). A service selection model for digital music service platforms using a hybrid MCDM approach. Applied Soft Computing, Vol. 48, pp. 385-403.
[22] J. M. Sánchez-Lozano, M. S. García-Cascales and M. T. Lamata. (2016). GIS-based onshore wind farm site selection using Fuzzy Multi-Criteria Decision Making methods. Evaluating the case of Southeastern Spain. Applied Energy, Vol. 171, pp. 86-102.
[23] A. Gupta and S. Kohli. (2015). An MCDM approach towards handling outliers in web data: a case study using OWA operators. Artificial Intelligence Review, Vol. 46, No. 1, pp. 59-82.
[24] F. Rhimi, S. B. Yahia and S. B. Ahmed. (2016). Refining the Skyline with fuzzy similarity measures and Topsis method for the optimization of web services composition. In: 2016 IEEE International Conference on Fuzzy Systems, IEEE, pp. 2091-2097.
[26] L. Zhuang, G. HeQing, L. Dong, H. Tao and Z. JuanJuan. (2007). Solving Multi-Objective and Fuzzy Multi-Attributive Integrated Technique for QoS-Aware Web Service Selection. In: International Conference on Wireless Communications, Networking and Mobile Computing (WiCom), pp. 735-739.
[27] M. Almulla, H. Yahyaoui and K. Al-Matori. (2015). A new fuzzy hybrid technique for ranking real world Web services. Knowledge-Based Systems, Vol. 77, pp. 1-15.
[28] I. Dragović, N. Turajlić, D. Radojević and B. Petrović. (2013). Combining boolean consistent fuzzy logic and AHP illustrated on the web service selection problem. International Journal of Computational Intelligence Systems, Vol. 7, pp. 84-93.
[29] M. Godse, R. Sonar and S. Mulik. (2008). The Analytical Hierarchy Process Approach for Prioritizing Features in the Selection of Web Service. In: IEEE Sixth European Conference on Web Services (ECOWS’08), pp. 41-50.
[30] F. Colace, M. D. Santo and A. Pietrosanto. (2006). Evaluation Models for E-Learning Platform: an AHP approach. In: IEEE 36th Annual Frontiers in Education Conference, pp. 1-6.
[31] J. H. Park and H. Y. Jeong. (2013). The QoS-based MCDM system for SaaS ERP applications with Social Network. The Journal of Supercomputing, Vol. 66, No. 2, pp. 614-632.
[32] M. Sun, T. Zang, x. Xu and R. Wang. (2013). Consumer-Centered Cloud Services Selection Using AHP. In: International Conference on Service Sciences (ICSS), pp. 1-6.
[33] L. Chemane, L. Ekenberg, O. Popov and T. Cossa. (2005). MCDM Model for Selecting Internet Access Technologies - A Case Study in Mozambique. In: The 2005 International Conference on Computer as a Tool, Vol. 2, pp. 1738-1741.
[34] S. E. Shaikh and N. Mehandjiev. (2004). Multi-attribute negotiation in e-business process composition. In: 13th IEEE International Workshops on Enabling Technologies: Infrastructure for Collaborative Enterprises, pp. 141-146.
[35] N. FakhFakh, H. Verjus, Frédéric Pourraz and P. Moreaux. (2013). QoS aggregation for service orchestrations based on workflow pattern rules and MCDM method: evaluation at design time and runtime. Service Oriented Computing and Applications, Vol. 7, No. 1, pp. 15-31.
[36] Y. S. Luo, K. Yang, Q. Tang, J. Zhang and B. Xiong. (2012). A multi-criteria network-aware service composition algorithm in wireless environments. Computer Communications, Vol. 35, No. 15, pp. 1882-1892.
[37] R. Karim, C. Ding and C. H. Chi. (2011). An Enhanced PROMETHEE Model for QoS-Based Web Service Selection. In: IEEE 2011 International Conference on Services Computing (SCC), pp. 536-543.
[38] P. Xiong and Y. Fan. (2007). QoS-aware Web Service Selection by a Synthetic Weight. In: Fourth International conference on Fuzzy Systems and Knowledge Discovery (FSKD), Vol. 3, pp. 632-637.
[39] S. K. Garg, S. Versteeg and R. Buyya. (2011). SMICloud: A Framework for Comparing and Ranking Cloud Services. In: Fourth IEEE International Conference on Utility and Cloud Computing (UCC), pp. 210-218.
[40] H. Pervaiz. (2010). A Multi-Criteria Decision Making (MCDM) Network Selection Model providing enhanced QoS differentiation to customers. In: 2010 International Conference on Multimedia Computing and Information Technology (MCIT), pp. 49-52.
[41] R. Yang, L. Qi, W. Lin, W. Dou and J. Chen. (2010). A Comprehensive Evaluation Method for Cross-Organizational Service Selection. In: IEEE 13th International Conference on Computational Science and Engineering (CSE), pp. 357-362.
[42] A. Taibi and B. Atmani (2017). Combining Fuzzy AHP with GIS and Decision Rules for Industrial Site Selection. International Journal of Interactive Multimedia and Artificial Intelligence, Vol. 4, No. 6, pp. 60-69.
[43] E. Al-Masri and Q. H. Mahmoud (2007). Discovering the best web service. (Poster) In: 16th IEEE International Conference on World Wide Web (WWW), pp. 1257-1258.
Pallavi Bagga
Pallavi Bagga is presently working as an Assistant Professor in the Department of Computer Science and Engineering at Lovely Professional University, Phagwara, Punjab, India. She has accomplished her Master of Technology in Computer Science & Engineering from DAV University, Jalandhar, Punjab, India in 2016. Earlier, she has completed her Bachelor of Technology in Computer Science & Engineering from Punjab Technical University, Punjab, India in 2014. Her predominant areas of research interests include Distributed Computing and Machine Learning. Nowadays, she is actively pursuing her research career in the sphere of Mobile Agents System Security using Machine Learning Algorithms.
Aarchit Joshi
Aarchit Joshi has completed his M.Tech in Computer Science and Engineering from DAV University, Jalandhar, Punjab, India. Earlier, he received his B.E. degree from Chitkara University, Barotiwala, Solan, H.P., India. His research interest topics include Multi Criteria Decision Making techniques and Optimization techniques.
Rahul Hans