International Journal of Environment, Agriculture and Biotechnology (IJEAB) Vol-3, Issue-4, Jul-Aug- 2018 http://dx.doi.org/10.22161/ijeab/3.4.48 ISSN: 2456-1878
Spatial Modeling of Cold Lava Flood Evacuation
in Kali Putih, Magelang Regency, Using Network
Analyst
Soma Trenggana
Geospatial Education and Training Center, Geospatial Information Agency, Jl. Raya Jakarta Bogor KM 46 Cibinong, West Java Provice, 16911, Indonesia
Email: [email protected]
Abstract—.The event of Mount Merapi's phreatic
eruption, at least reminds us that the riverbank of Kali Putih which is located in Magelang Regency, Central Java Province has not been completely free from the threat of cold lava flood, especially during the rainy season. Therefore, a preventive action in relation to cold lava flood mitigation matters needs to be done. As part of the preventive action, a spatial modeling was carried out in Kali Putih to get an overview of the number and distribution of affected residential areas, the location and distribution of temporary evacuation sites (TES), the most effective number of final evacuation sites (FES), and various evacuation routes formed. Modeling began by calculating the level of vulnerability of cold lava in Sub Watershed of Kali Putih to get the most vulnerable areas for cold lava flood. 3D analyst and spatial analyst were used at this stage. The analysis was continued to calculate the number of affected settlements, using vector-based analysis. Furthermore, the determination of the number and distribution of TES, the number and distribution of FES, and determination of evacuation routes were carried out using Network Analyst. From this spatial modeling, the following results were obtained: 66 out of 179 residential areas were most lik ely affected by cold lava flood, 23 temporary evacuation sites (TES), and 7 final evacuation sites (FES), 57 evacuation routes from affected settlements to TES, and 22 evacuation routes from TES to FES
Keywords— Evacuation, Cold lava flood, Network analyst, Spatial analyst, Spatial modeling.
I. INTRODUCTION
The cold lava flood as a result of Mount Merapi volcanic eruption In October 2010, has caused the mass evacu ation of residents who live on the riverbanks of the rivers that flow on the slopes of Merapi. It was recorded about 10 million cubic volcanic materials mixed with rainwater flowing in 13 rivers that hailed at Mount Merapi, and caused the cold lava flood [28]. One of the areas that
most affected by cold lava flood was the river bank of Kali Putih. Kali Putih that runs through 13 villages including Sirahan Village, Magelang Regency has ever overflowed and made Jumoyo Village, Seloboro Village, and Sirahan Village become ones of areas heavily affected by the cold lava flood.
The disaster principally brought impacts to the environment and people [24]. According to the National Disaster Mitigation Agency (BNPB), the eruptions and cold lava flood caused damages in the sectors of settlement, public infrastructure, economy and society [6]. There were more people living under poverty level so that social strata changed [6]. The residents of Sirahan Village lost their main livelihood as farmers because their farming lands and gardens were covered by the volcanic materials. Moreover, it was difficult for them to get funds to start businesses and recover their economy. The Magelang Regency Government as of 26 November 2010 - 16 March 2011 in more detail noted that losses due to lava disasters in this region include 2,082 displaced persons, 67 homes washed away, 262 houses were severely damaged, 32 houses were damaged and 47 were lightly damaged [33]. The amount of damage and losses caused by the eruption disaster was about Rp. 4.23 trillion [6].
http://dx.doi.org/10.22161/ijeab/3.4.48 ISSN: 2456-1878
The government has actually carried out several mitigation efforts in the Kali Putih area, such as building Sabo dams, raising embankments and relocating settlements to safe places. Unfortunately, the relocation effort of residents living on the banks of Kali Putih appears to have been rejected by local residents and chose to remain in their place of origin [21].
The reluctance of people living on the banks of Kali Putih to relocate, and the still high threat of cold lava flood, inevitably force the government and all parties concerned to implement a planned evacuation system. This effort is nothing but to suppress the number of damage and casualties that may arise due to cold lava flood disaster [34]. Provisions regarding this evacuation have actually been mandated in Article 45 paragraph 2 letter e, Law of the Republic of Indonesia (UURI) no. 24 Year 2007 on Disaster Management [31]. It stated in Article 45 paragraph 2, that the preparation of the evacuation site is a form of preparedness to ensure quick and precise efforts to deal with disasters.
This study will conduct spatial modeling of evacuation caused by cold lava flood in Kali Putih using Geographic Information System (GIS)-based Network Analyst [13]. The purpose of this study was to obtain an overview of the number and distribution of affected settlements, the number and distribution of temporary evacuation sites (TES), the number and distribution of final evacuation sites (FES), and the number and variation of evacuation routes formed, both routes from affected settlements to temporary evacuation sites (TES) and routes from TES to FES. This spatial modeling is expected to be a reference or even a guide for parties involved in disaster mitigation. The reason for selecting Kali Putih as an object of analysis is due to the largest impact and losses caused by the cold lava flood was on the banks of the Kali Putih [33]. Previous researches with similar topic were carried out in year 2013[12] and 2016 [34] using different methods respectively, while research concerning the modeling about the vulnerable areas of cold lava flood in Kali Putih was carried out in year 2013 [17].
1.1.Evacuation
Evacuation is considered a way to prepare people when at risk from an impending hazard [29]. It is an important part of disaster management and is an effective way of minimizing loss of lives and property damage [20]. Evacuation is considered a process that constitutes hazard detection, issuance of warning, preparation to evacuate, movement to identified shelters through a network [27]. It is important that the preventive evacuation is well organized, efficient and will need a minimum of time in order to avoid casualties. An accurate estimate of the evacuation time is helpful in determining the start of the
Refer to [27], hazard detection is required in evacuation management to ensure the extent of the affected area and the number of residents to be displaced, including the establishment of evacuation start point. A spatial analysis with the help of remote sensing and geographical information system technology so far is able to describe spatially the vulnerable areas of disaster, physically and socially [17], [8], [10]. With the spatial analysis, we can calculate the number of settlements and total inhabitant that live in the vulnerable areas that need to be displaced. 1.3.Evacuation Site
To optimize the routing problem, one has to know the destinations. To optimize the destination assignment, one has to know the minimal travel time, and hence route assignment to all destinations [16]. In Article 44 of UURI Number 24 Year 2007 [31], preparation to evacuate is considered as part of preparedness . It includes preparation of evacuation sites and determination of evacuate route. According to Regulation of The President of The Republic of Indonesia Number 70 Year 2014 About Spatial Plan For Merapi Mountain National Park [22], the disaster evacuation system shall be designated as an effort to move refugees from geological hazard areas to disaster-prone areas, facilitate the evacuation of refugees, and ensure the safety and basic needs of refugees during the occurrence of geological disasters in the area of Mount Merapi National Park. The disaster evacuation system shall consist of TES (Temporary Evacuation Site), FES (Final Evacuation Site), and evacuation line (evacuation route). The TES shall be stipulated by the following criteria: a. located in an accessible location by refugees and refugee vehicles; b. not in areas that endanger the safety of refugees, such as landslide-prone areas, high-voltage electrical grid areas, vulnerable areas of fallen trees, and river borders; c. adequate infrastructure and facilities are available with respect to security and accessibility; d. available communication networks; and e. evacuation signs are available. Meanwhile, The FES shall be stipulated by criteria: a. located outside of disaster prone areas in the rea of Merapi Mountain National Park; b. are located in locations accessible to refugees and refugee vehicles; c. not in areas that endanger the safety of refugees, such as landslide-prone areas, high-voltage electrical grid areas, vulnerable areas of fallen trees, and river borders; d. adequate infrastructure and facilities are available with respect to security and accessibility; e. available open space; f. available communications infrastructure and facilities; and g. Evacuation signs are available.
1.4.Evacuation route
International Journal of Environment, Agriculture and Biotechnology (IJEAB) Vol-3, Issue-4, Jul-Aug- 2018 http://dx.doi.org/10.22161/ijeab/3.4.48 ISSN: 2456-1878
disaster, is crucial for effective evacuation process [22]. From the point of view of the evacuee, evacuation is the whole process which include: a. organization of the departure; b. departure from home; c. travelling in the direction of a safe area; d. leaving the danger area through one of its exits; e. continuation of the journey to the destination in the safe area [32]. The evacuation route as referred to [22] shall be established to facilitate the evacuation of refugees from TES to FES. Furthermore, the evacuation route as referred to [22] shall be stipulated by criteria: a. is a road with a pavement that the refugee carrier can pass; b. available road markings: and c. evacuation signs are available. This indicates that the existing road network is a base for determination evacuation route.
1.5. Network analyst
Currently, implemented GIS network tools are dominated by routing functions [4][7][1][18]. The implementation of
GIS-based networks for transport applications has increased dramatically in the past 10 years with the presence of an almost existing service center location in every place and direction of travel based through internet services such as Mapquest and Google Maps [9]. A routing is the act of selecting a course of travel, and it is arguably the most fundamental logistical operation in the network analysis.The most common objective in routing across networks is to minimize the cost of the route [1]. There are actually four fundamental operations that can be performed in network analysis , where all of which are derivatives of route finding algorithms. These functions are: a. finding a route between point locations; b. determining the service area for a facility; c. finding the closest facility across the network; and d. creating an origin–destination matrix 9]. The last version of ArcGIS Network analyst even added 3 other functions that are: a. vehicle routing problem; b. allocation to allocation; and c. time dependent [15].
Fig.1: Study Area
II. METHODS
2.1.The Study area.
Kali Putih, geographically is located in between 110°15ꞌ0ꞌꞌ E and 110°25ꞌ30ꞌꞌ E and in between 7°20ꞌ0ꞌꞌ S and 7°39ꞌ0ꞌꞌ S. This river is part of Kali Putih sub-watershed which flows from the top of Mount Merapi to the southwest and passes through 13 villages (see Fig. 1). 2.2.Modeling Methods.
To achieve the objectives of this modeling, the study divided into four steps of analysis. The first step was to set the level of cold lava vulnerability, with the aim to produce a map of the distribution of prone areas of lava flood on the banks of Kali Putih. This step was continued
to determine settlements affected by Kali Putih cold lava flood. The second step was to determine the number and the distribution of decent TES. The third step was determination the number and the distribution of reasonable FES. The fourth step was determination of the evacuation routes from the affected settlement spots to TES and from TES to FES.
2.2.1. The level of cold lava vulnerability and the affected settlements
http://dx.doi.org/10.22161/ijeab/3.4.48 ISSN: 2456-1878
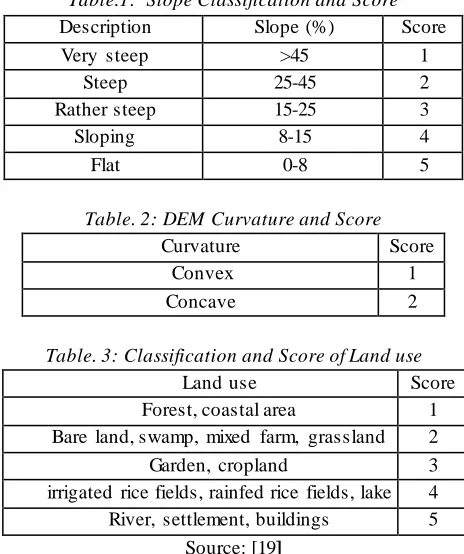
classifications, and scoring system. The first research [19] used; a. slope; b. distance from river; c. rainfall intensity; d. land use; and e. rock hardness as the analysis parameters. The second [26] used: a. landform; b. slope; c. land use; d. distance from river; and e. rainfall intensity as the analysis parameters. Both were also different in defining parameters classifications , and there was no weighted for each parameter used. Therefore, in this study we set the parameters ourselves and assign weights to each parameter. The following are the table of scoring for each parameter used in this study, which include: a. slope; b. landscape morphology; c. land use; d. DEM curvature; and e. distance from river.
Table.1: Slope Classification and Score Description Slope (%) Score
Very steep >45 1
Steep 25-45 2
Rather steep 15-25 3
Sloping 8-15 4
Flat 0-8 5
Table. 2: DEM Curvature and Score
Curvature Score
Convex 1
Concave 2
Table. 3: Classification and Score of Land use
Land use Score
Forest, coastal area 1 Bare land, swamp, mixed farm, grassland 2
Garden, cropland 3
irrigated rice fields, rainfed rice fields, lake 4 River, settlement, buildings 5
Source: [19]
Table. 4: Classification and Score of Distance from River Description Distance from River (meter) Score
Very far >500 1
Far 250-500 2
Medium 100-250 3
Close 50 - 100 4
Very Close < 50 5
Source: [19]
Table. 5: Parameter Weights Parameter Weights (%)
Land use 25
Slope 35
Curvature 25
Distance from River 15
The value of the vulnerability is determined by using the following equation:
n
K = ∑ (Wi x Xi) (1) i=1
Description:
K = vulnerability value Wi = Weight for parameter i Xi = Class score in parameter i
Score given to each parameter were determined in accordance with their contribution to the level of hazard posed by the flood event. Parameters with score 1 give the least effect on the level of vulnerability to cold lava flood. The greater the score, the greater the effect on the vulnerability to cold lava flood
A. Data used for the purposes of this analysis were a digital map of Rupabumi Indonesia on a 25,000 scale
which was downloaded from
http://tanahair.indonesia.go.id/portal-web. This map consists of layers; a. hypsography; b. administrative boundaries; c. hydrography; d built environment; e. transportation; and f. utility. For the reasons of updated information, a land use map was obtained from the result of the Ikonos 2010 image interpretation which was validated by field checking. A 30-Meter SRTM (Shuttle Radar Topography Mission) DEM downloaded from
http://dwtkns.com/srtm30m/. The population data per
village derived from the 2010 population census which was downloaded from https://www.bps.go.id/website/
fileMenu/Penduduk-Indonesia-Menurut-Desa-2010.pdf
[5].
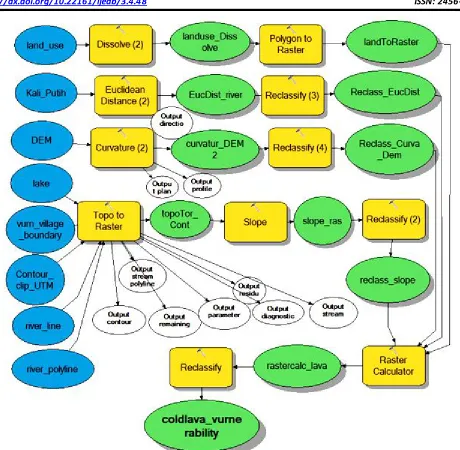
The analysis method used to predict the level of cold lava flood vulnerability was the raster-based 3D analyst and spatial analyst. Both methods are extension packages that are in ArcGIS software. Layers such as: contours, rivers and villages boundaries prone to cold lava flood, DEM, and land use were used as input analysis.
International Journal of Environment, Agriculture and Biotechnology (IJEAB) Vol-3, Issue-4, Jul-Aug- 2018 http://dx.doi.org/10.22161/ijeab/3.4.48 ISSN: 2456-1878
Fig. 2: Model builder for simulating the level of vulnerability to cold lava flood
As the main objective is to simulate evacuation routes, analysis of the level of vulnerability of cold lava flood was continued to obtain areas with the highest level of vulnerability to cold lava flood. These areas will be overlaid with residential areas to get residential areas affected by cold lava flood, both only part of the area or the entire area [27]. We assume that the population living in the affected areas is an object that must be evacuated,
and the affected areas become the start points of evacuation.
http://dx.doi.org/10.22161/ijeab/3.4.48 ISSN: 2456-1878
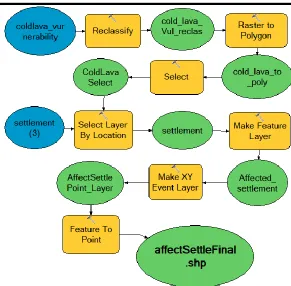
Fig. 3: Model builder of affected settlement detection
2.2.2. Determination of TES
According to National Board for Disaster Management, disaster emergency response command posts can occupy buildings or tents. Buildings or tents for disaster emergency command post occupies a strategic location with the following criteria: a. easily accessible by various parties involved in disaster emergency response activities; b. safe and free from disaster threats c. have adequate parking; d. land area of at least 500 m2 [2]. The determination of the TES basically follows the criteria set by the Regulations of The President of The Republic of Indonesia Number 70 Year 2014 About Spatial Plans For Merapi Mountain National Park [22]. In this case, we can assume that buildings such as schools, places of worship, village offices are representative places for TES. These
buildings are spacious, easily accessible, and equipped with electricity, clean water, telecommunications .
For the sake of getting potential TES, we used vector-based analysis using layers: educational facilities, village offices, religious buildings, community health centers, affected settlements and vulnerable village boundaries as input parameters . The analysis was continued by using the New Closest Facility function to select the temporary evacuation sites which was considered the most appropriate in terms of distance. Layers used for this purpose were TES_TempEvacSite as a facility layer and affectSettleFinal as an incident layer.
International Journal of Environment, Agriculture and Biotechnology (IJEAB) Vol-3, Issue-4, Jul-Aug- 2018 http://dx.doi.org/10.22161/ijeab/3.4.48 ISSN: 2456-1878
Fig. 4: Model builder of potential TES (temporary evacuation sites)
Fig. 5: Model builder of selected TES (temporary evacuation sites)
2.2.3. Determination of FES
The determination of FES also basically follows the criteria set by the Regulation of the President of the Republic of Indonesia Number 70 Year 2014 on Spatial Plans for Merapi Mountain National Park [22]. The regulation also states that FES must be at th e district level. This means that FES must be located in the district capital, which is marked by the presence of a district office.
The policy that FES must be in the district capital is quite reasonable, because FES defined as a final gathering
http://dx.doi.org/10.22161/ijeab/3.4.48 ISSN: 2456-1878
allegedly affected by cold lava flood. Those five districts are: Dukun District, Srumbung District, Muntilan District, Salam District, and Ngluwar District.
In this case, the capital of Srumbung District is considered unfit for FES because it is located on the edge
of a very vulnerable area, and must be excluded from candidates for FES. As a substitute for the capital city of Srumbung district, school buildings and religion buildings were chosen to accommodate refugees from villages under Srumbung District.
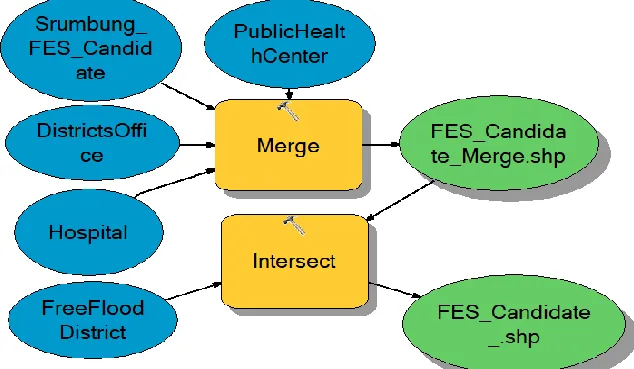
Fig. 6: Model builder of determining subsitute FES candidates of Srumbung District
The sum of all FES candidates including the substitute FES of the Srumbung District was carried out in stages as shown in Fig. 7
International Journal of Environment, Agriculture and Biotechnology (IJEAB) Vol-3, Issue-4, Jul-Aug- 2018 http://dx.doi.org/10.22161/ijeab/3.4.48 ISSN: 2456-1878
Fig. 8: Model builder of selected FES assignments
2.2.4. Modeling of Evacuation Routes from Affected Settlements to TES and from TES to FES
Determination of the evacuation routes is intended to provide direction to the refugees to reach the nearest evacuation sites from the settlement to TES and from TES to FES in case of the lava flood occurs , Determination of the evacuation routes from the affected settlement to the TES has actu ally been carried out in conjunction with the determination of the TES (Fig. 5).
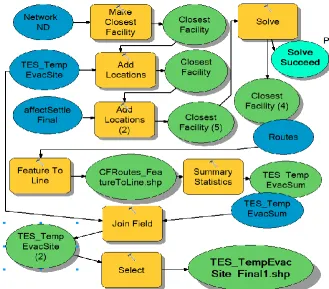
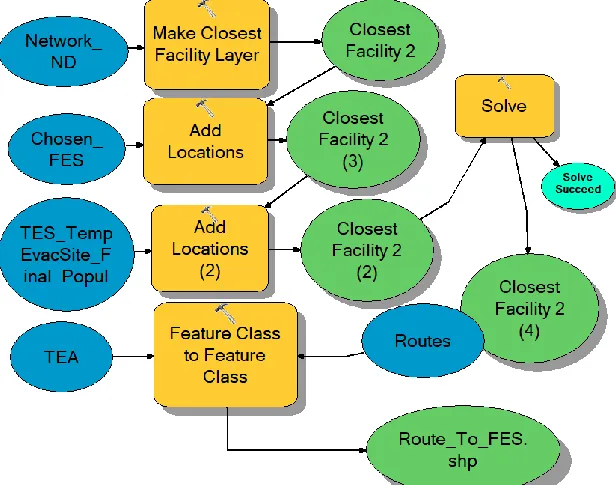
Therefore, here only an analysis of the evacuation routes from TES to FES will be carried out. Fig. 9 below is a model builder that will be used to determine the evacuation routes from TES to FES.
Fig. 9: Model builder of generation of various evacuation routes from TES to FES
III. RESULT AND DISCUSSION
3.1. The Level of Cold Lava Vulnerability and the Affected Settlements
http://dx.doi.org/10.22161/ijeab/3.4.48 ISSN: 2456-1878
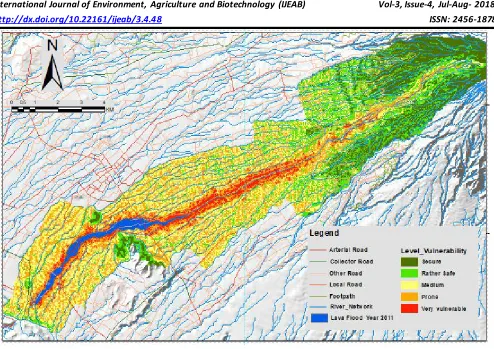
Fig. 10: Map of the vulnerability level to cold lava flood
It shows on the map that all villages in the study area are dominated by prone zones with an extent of about 4149.84 Ha or about 49.79 percent. Detail on the extent and percentage for each level of vulnerability can be seen in Fig. 11.
Fig. 11: Attribute table of layer Coldlava_vulnerability
International Journal of Environment, Agriculture and Biotechnology (IJEAB) Vol-3, Issue-4, Jul-Aug- 2018 http://dx.doi.org/10.22161/ijeab/3.4.48 ISSN: 2456-1878
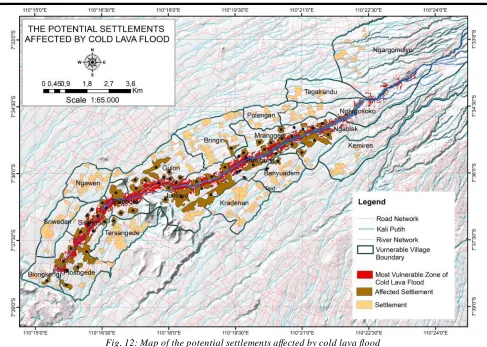
Fig. 12: Map of the potential settlements affected by cold lava flood
The use of a 30 meter DEM SRTM is actually simply to overcome the absence of elevation point data that should be available on the RBI map. As we know the elevation point data is an important component for building DEM with Topo To Raster. This elevation point can create more detailed curvature than curvature made from SRTM DEM. This may be the reason why the surface of the study area tends to look flat as shown on Fig. 10. Apart from the extent of the very vulnerable area which might be debatable, this area seems to be in contact with a number of residential areas which are spread along the Kali Putih flow, as shown on Fig. 12.
Based on the result of affected settlement detection analysis (Fig. 3), if there is a cold lava flood in accordance with the modeling results, then 66 of 179 residential areas are very likely to be affected . All residents living in these areas must be moved. Furthermore, there will be 66 pick-up points for refugees who will be moved to temporary evacuation sites (TES).
It is unfortunate that there is no data explaining the population per residential area. Population data for each pick-up point is needed to determine the number and distribution of TES.
3.2. Determination of The Temporary Evacuation Sites (TES)
Fig. 13 is a map that draws the number and distribution of selected TES. This map is the result of analysis with stages as illustrated in Fig. 4 and 5. The stages of analysis as illustrated in Fig. 4 are intended to get potential TES candidates. At this stage, a TES_TempEvacSite layer containing the number and distribution of is obtained. There are 102 prospective TES scattered throughout the affected villages, consisting of village offices, schools, mosques and churches, and public health centers (see Fig. 14)
http://dx.doi.org/10.22161/ijeab/3.4.48 ISSN: 2456-1878
Fig. 14: Attribute table containing part of the TES candidates
International Journal of Environment, Agriculture and Biotechnology (IJEAB) Vol-3, Issue-4, Jul-Aug- 2018 http://dx.doi.org/10.22161/ijeab/3.4.48 ISSN: 2456-1878
Table. 6: The Selected Temporary Evacuation Sites
No. Temporary Evacuati on Sites
1 School1 - Plosogede
2 School1 - Blongkeng 3 Village Office - Plosogede 4 School2 - Plosogede
5 School3 - Plosogede 6 Village Office - Tersangede 7 School3 - Tersangede 8 Mosque1 - Jumoyo 9 School1 - Seloboro 10 School1 - Jumoyo 11 Mosque4 - Kradenan
12 Village Office - Banyuadem 13 Mosque1 - Gulon 14 Mosque2 - Gulon
15 Mosque3 - Gulon 16 Mosque3 - Banyuadem 17 Mosque1 - Ngablak 18 Mosque1 - Bringin 19 School2 - Bringin 20 Village Office - Mranggen 21 School4 - Mranggen 22 Village Office - Ngargosoko 23 Mosque1 - Ngargosoko
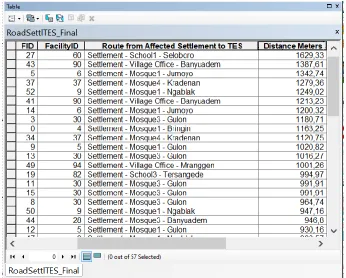
The whole process of determining the TES analysis also results in the layer of Evacuation route from the affected settlements to the TES (see Fig. 13). The New Closest Facility used in this simulation produces 57 evacuation routes from the affected settlements to the TES. The farthest distance occurs on the route from the settlement to mosque 1 in Ngablak Village with a travel distance of 1839.56 meters .
http://dx.doi.org/10.22161/ijeab/3.4.48 ISSN: 2456-1878
The shortest distance occurs on the route from the settlement to School3 in Plosogede Village with a travel distance only 0.9 meters. The average travel distance from the affected settlements to the TES is around 775 meters. If you refer to the number of affected settlements that have to be evacuated as many as 66, then the number of routes should be 66. The fact that the number of evacuation routes is only 57 indicates that there are 9 affected settlements that cannot be evacuated due to the unreachable transportation network.
Argument due to the inaccessibility of the transportation network is basically understandable. In this network simulation, it was assumed that some of the roads in the very vulnerable area were blocked due to submerged cold lava flood. In this case we can argue that in order to avoid
interruption of the evacuation route, an early warning system must be applied. With an early warning system, the evacuation process can be carried out before the cold lava flood hits the affected areas.
3.3. Determination of the Final Evacuati on Sites (FES) As mentioned above, the placement of FES in the capital of Srumbung District is certainly very risky and therefore the FES must be moved. In this case, the replacement FES must remain in the Srumbung District, and located at a distance between 2500 and 5000 meters from the TES. Data processing with stages referring to Fig . 6 model builder, managed to get 9 prospective FES buildings, consisting of 1 school and 8 mosques. (Fig. 16)
Fig. 16: Attribute table of Srumbung FES candidates
International Journal of Environment, Agriculture and Biotechnology (IJEAB) Vol-3, Issue-4, Jul-Aug- 2018 http://dx.doi.org/10.22161/ijeab/3.4.48 ISSN: 2456-1878
Fig. 19 below is a map that describes the distribution of FES that are considered most suitable for accommodating refugees from 22 TES. The Location-Allocation function with the Maximize_Attendance problem type used in this analysis shows that the determination of 7 FESs is considered reasonable. This amount is able to equally divide the number of TES that come to each FES as shown in Fig. 19. These selected FES buildings can be seen in Fig. 18.
Fig. 18: Attribute table of Chosen_FES
It can be seen on Fig. 18 that 3 FES located in Srumbung District, and none in Dukun District. The number of FES in Srumbung District seems to be related to the large number of residential areas affected in the Srumbung District. Other reasons related to the distance between the TES in Srumbung District and the number of FES that have been determined . Referring to the number of TES that should have access to FES (23 TES), a TES located at School 1 in Jumoyo Village do not seem to have access to one of the FES. the problem seems to be similar to the case of 9 affected settlements that could not be evacuated due to lack of road access .
Fig. 19: Map of chosen FES based on Location Allocation function
http://dx.doi.org/10.22161/ijeab/3.4.48 ISSN: 2456-1878
3.4. Modeling Evacuati on Route from Affected Settlements to TES and from TES to FES
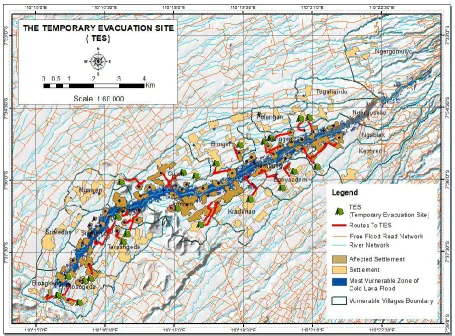
Fig. 20: Map of the evacuation routes from affected settlements to TES and from TES to FES
Figure 20 above is a map that describes the evacuation route s from affected settlements to TES and from TES to FES as a result of modeling evacuation. The modeling results of evacuation routes from affected settlements to TES have been discussed in the previous section.
It can be seen in Fig. 20 the number of evacuation routes and road networks that each route passes , both for evacuation routes from affected settlements to TES and from TES to FES. Some routes appear to pass through the same section of road. Using the same road section will cause traffic density in which can slow down the speed.
International Journal of Environment, Agriculture and Biotechnology (IJEAB) Vol-3, Issue-4, Jul-Aug- 2018 http://dx.doi.org/10.22161/ijeab/3.4.48 ISSN: 2456-1878
In this evacuation modeling, the network data set is not equipped with a turn layer, one-way or two-way information, and travel time. Restricted turn, speed adjustment, one-way or two-way settings for each road section clearly affect distance and travel time. The absence of these three data in this modeling clearly influences the results of this modeling. Although in emergency cases such as evacuation of cold lava flood in Kali Putih, all traffic rules may be ignored.
IV. CONCLUSION
Modeling the evacuation of cold lava flood in Kali Putih using Network analyst proved to be able to visually and spatially describe the distribution of affected settlement locations, the distribution of temporary evacuation sites and the direction of refugees to the nearest temporary evacuation sites (TES). Network analyst is also able to simulate the most reasonable amount of FES that is clearly very helpful in the effectiveness and efficiency of managing the final evacuation site (FES).
In spatial modeling activities, completeness, accuracy and suitability of input data, so does the spatial logic capability of the operator is needed to get results that can be accepted scientifically and logically. The case of analyzing the level of vulnerability of cold lava flood in Kali Putih is an example, where due to lack of parameters and lack of appropriate data cause the results obtained are doubtful for accuracy, both scientifically and in spatial logic.
Modeling Evacuation of cold lava flood with network analysis is quite promising in terms of the ability to describe results spatially. Especially with the model builder automation system that makes the modeling process more interactive. Therefore, deepening needs to be continued by using all types of updated data needed, so that the results obtained can actually be applied in the field, and become guidelines for all parties related to the catastrophic cold lava flood in Kali Putih. Even not only the Kali Putih case, this modeling can also be applied to all cases of disaster evacuations .
.
ACKNOWLEDGEMENTS
Our thanks go to BPPTKG (Center for Investigation and Development of Geological Disaster Technology) for its assistance in providing SPOT imagery. We would also like to thank the editors for helping us improve the article until it is eligible.
REFERENCES
[1] Abousaeidi, M., Fauzi R., Muhamad, R. (2016). Geographic information system (GIS) modeling approach to determine the fastest delivery routes.
Saudi Journal of Biological Sciences (2016) 23, 555– 564
[2] Badan Nasional Penanggulangan Bencana. (2010). Peraturan Kepala Badan Nasional Penanggulangan Bencana Nomor 14 Tahun 2010 Tentang Pedoman Pembentuk an Pos Komando Tanggap Darurat Bencana. (State Document). Retrieved from https://www.scribd.com/doc/189278949/Perka- BNPB-14-2010-Pedomaokn-Pembentukan-Pos-Komando-Tanggap-Darurat-Bencana-2
[3] Bernadeth, M. L., LIM, H.Jr., PIANTANAKULCHAI, Mo. (2013) Factors affecting flood evacuation decision and its implication to transportation planning. Journal of the Eastern Asia Society for Transportation Studies, Vol.10, 2013, 163 – 177.
[4] Bhambulkar, A V. (2011). Municipal solid waste collection routes optimized with ArcGIS network analyst. International Journal of Advance Engineering Science and Technologies. Vol No. 11, Issue No. 1, 202 - 207
[5] Biro Pusat Statistik. Jumlah Penduduk Indonesia menurut Desa (Hasil Sensus BPS). Retrieved on August 2018 from https://www.bps.go.id/website/
fileMenu/
Penduduk-Indonesia-Menurut-Desa-2010.pdf
[6] BNPB dan Bappenas. (2011). Rencana ak si rehabilitasi dan rek onstruk si: Pasca bencana erupsi Gunung Merapi Provinsi D.I.Yogyak arta dan Provinsi Jawa Tengah tahun 2011 – 2013. Retrieved on Juli 2018 from https://www.bnpb.go.id/rencana-aksi-rehabilitasi-dan-rekonstruksi-wilayah-pasca bencana-erupsi-gunung-merapi-di-prov-diy-dan-prov -jateng-tahun-2011-2013
[7] Bosonal T, Nordmark, I., Gebresenbet, G. & Ljungberg, D. (2013). GIS-based analysis of integrated food distribution network in local food supply chain. International Journal of Business and Management; Vol. 8, No. 17; 2013 ISSN 1833 -3850 E-ISSN 1833-8119, 13 - 34
[8] Bukari, S. M., Ahmad, M. A., Wai, T. L, Kaamin, M., Alimin, N. (2015). Spatial analysis in determination of flood prone areas using geographic information system and analytical hierarchy process
at Sungai Sembrong’s Catchment. Soft Soil
Engineering International Conference 2015 (SEIC2015).
[9] Curtin, K. M. (2007). Network analysis in geographic information science: Review, assessment, and projections. Cartography and Geographic Information Science, Vol. 34, No. 2, 2007, 103-111 [10]Darwin, Kombaitan, B., Yudoko, G., Purboyo, H.
http://dx.doi.org/10.22161/ijeab/3.4.48 ISSN: 2456-1878
flood prone areas and critical arterial road network by using chaid method in Bandung area. MATEC Web of Conferences 147, 02007 (2018). Retrieved from
https://doi.org/10.1051/matecconf/ 201814702007
[11]Dinas Kesehatan Provinsi Jawa Tengah. (2015). Buk u alamat pusk esmas dan rumah sak it Provinsi Jawa Tengah tahun 2014. Retrieved August 2018 from https://www.dinkesjatengprov.go.id/
[12]Doma, M. S. A. & Purwanto, T. H. (2013). Penentuan jalur evakuasi dan dampak banjir lahar dingin Gunung Merapi, Jawa Tengah. Jurnal Bumi Indonesia. Volume 2, Nomor 2, Tahun 2013. 149-154 [13]ESRI. (2010). Network analyst tutorial. Copyright ©
1995-2010. Esri All rights reserved. Retrieved from http://help.arcgis.com/en/arcgisdesktop/
10.0/pdf/network-analyst-tutorial.pdf
[14]ESRI. (2016). ArcMap 10.3, curvature. Retrieved August 2018 from http://desktop.arcgis.com/en
/arcmap/10.3/tools/3d-analyst-toolbox/curvature.htm [15]Esri. 2018. Types of network analysis layers.
Retrieved from http://desktop.arcgis.com/en/
arcmap/latest/extensions/network-analyst/types
-of-network-analyses.htm
[16]Han, L., Yuan F., Chin, S. & Hwang, H. (2006). Global optimization of emergency evacuation assignments. Interfaces, 36(6), 502-513
[17]Hidayat, F. & Rudiarto, I. (2013). Pemodelan resiko banjir lahar hujan pada alur Kali Putih Kabupaten Magelang. Jurnal Tek nik PWK Volume 2 Nomor 4 2013. 895-904
[18]Kumar, P. & Kumar, D. (2016). Network analysis using GIS techniques: A case of Chandigarh City. International Journal of Science and Research (IJSR) Volume 5 Issue 2, February 2016, 409 – 411
[19]Larasati Z. R., Hariyanto, T., Kurniawan, A. (2017). Pemetaan daerah risiko banjir lahar berbasis SIG untuk menunjang kegiatan mitigasi bencana (Studi kasus: Gunung Semeru, Kab. Lumajang). JURNAL TEKNIK ITS Vol. 6, No. 2, (2017), 2337-3520 (2301-928X Print)
[20]Na, L., Xueyan, S., Mingliang, Q. (2012). A bi-objective evacuation routing engineering model with Secondary Evacuation Expected Costs. Systems Engineering Procedia 5 (2012) 1 – 7
[21]Ni’am, L. (2014). Kepengaturan dan penolakan
relokasi: Kasus warga Watugajah pascabencana Gunung Merapi tahun 2011-2013. Jurnal Ilmu Sosial dan Ilmu Politik Volume 18, Nomor 1, Juli 2014, 1-14.
[22]Peraturan Presiden Republik Indonesia nomor 70 tahun 2014 tentang rencana tata ruang k awasan taman nasional Gunung Merapi. (2014). Retrieved
from https://www.hukumonline.com/pusatdata/ downloadfile/.../lt544f48950b14...
[23]Ramadhiyanti, D. W., Sokang, Y. E. S., Suciati, A. A., & Viola, H. (2012). Set of field notes of cold lava flood villages Sirahan (Hope for the future). Faculty of Psychology, UGM. Yogyakarta.
[24]Retnowatia, S., Ramadiyantia, D. W., Suciatia, A.A., Sokanga, Y. A,. Violaa, H. (2015). Hope intervention against depression in the survivors of cold lava flood from Merapi Mount. Procedia - Social and Behavioral Sciences 165 (2015) 170 – 178 [25]Rinawati, D. I., Sari, D. P., Handayani, N. U., and Siwi, B. R. (2018). Predicting the probability of Mount Merapi eruption using bayesian event tree_eruption forecasting. MATEC Web of Conferences 154, 01050 (2018). Retrieved from
https://doi.org/10.1051/matecconf/ 201815401050
[26]Shinta D., Priyono, K. D., Sigit, A. A. (2015). Mitigasi bencana lahar hujan Gunung api Merapi berbasis sistem informasi geografis dan penginderaan jauh di Sub das Kali Putih Magelang. Fakultas Geografi Universitas Muhamadiyah. Surakarta. [27]Stepanov, A. & Smith, J. (2009). Multi-objective
evacuation routing in transportation networks. European Journal of Operational Research, 1498, 435 - 446.
[28]Surono, Jousset, P., Pallister, J., Boichu, M., Buongiorno, M.F., Budisantoso, A., Costa, F., Andreastuti, S., Prata, F., Schneider, D., Clarisse, L., Humaida, H., Sumarti, S., Bignami, C., Griswold, J., Carn, S., Oppenheimer, C. and Lavigne, F. (2012). The 2010 explosive eruption of Java’s Merapi volcano – a ‘100-year ’ event. Journal of Volcanology and Geothermal Research, 241 -242. 121-135.
[29]Taylor, M. A. P & Freeman, S. K. (2010). A review of planning and operational models used for emergency evacuation situations in Australia. Procedia Engineering 3 (2010) 3–14
[30]Tempo.co. (2014). Rivers near Mt Merapi face cold lava flood. Retrieved from https://en.tempo.co/read/ news/2014/10/19/206615399/Rivers
-near-Mt-Merapi-Face-Cold-Lava-Flood
[31]Undang-Undang Republik Indonesia No. 24 Tahun 2007 Tentang Penanggulangan Bencana . (2007). Retrieved from https://www.bnpb.go.id/ppid/file/ UU_24_2007.pdf.
International Journal of Environment, Agriculture and Biotechnology (IJEAB) Vol-3, Issue-4, Jul-Aug- 2018 http://dx.doi.org/10.22161/ijeab/3.4.48 ISSN: 2456-1878
[33]Wimbardana, R & Sagala, S. A. H. (2013). Kesiapan masyarakat terhadap bahaya lahar dingin Gunung Merapi. Jurnal Bumi Lestari, Volume 13 No. 2, Agustus 2013. 394-406