1. Introduction
Soil exhibits a major pool of organic matter in terrestrial ecosystem and its quality depends on various physical, chemical, biological and biochemical properties. The main concept of ecological studies explains the importance of climatic conditions along with other factors in controlling the spatial as well as temporal distribution types of vegetation across worldwide1. Soil microbial biomass is the principle component of soil ecology and plays a vital role in maintaining soil quality
and ecosystem health. Soil microbial biomass as well as its abundance is regulated on the basis of quality and quantity of substrate available in that particular environment. The role of decomposition of soil organic matter is well known, in terms of essential plant nutrient cycling2. The decomposition of soil organic matter and nutrient cycle is mainly driven by soil enzymes associated with microorganisms; represents the active fraction of soil microbial population3, 4. These enzymes are extracellular in nature, secreted outside the microbial cell and catalyze the degradation of complex compounds into simple forms that are utilized by all soil entities including flora and fauna. Microorganisms are the creators of extracellular enzymes and therefore are the most obvious regulators of enzyme activity. These extracellular enzymes are mainly associated with the Abstract
Background & Aim: The present study compared the soil microbial biomass, enzymatic activity and the nutrient accessibility under different location covering dry deciduous and temperate forest of North-India. Also, the temporal variation was evaluated for two consecutive years during the pre and post monsoon season. Results: The results indicated significant temporal and spatial variation among the soil characteristics and the availability of nutrients. Soil microbial biomass carbon, nitrogen and phosphorous ranged from 151.63 - 471.1, 36.56 - 88.68 and 15.73 - 62.18 µg g-1. Acid phosphatese activity was highest in forest stand 4 and lowest in forest stand 1, while the value of β-glucosidase activity was recorded maximum at forest stand 5 i.e. 1514.95 µg g-1 h-1 whereas the lower value was in forest stand 1 i.e. 582.23 µg g-1 h-1. Furthermore, the dehydrogenase(DHA) activity ranged from 38.61 - 497.78 µg g-1 h-1 and 158.14 - 707.37 µg g-1 h-1 for the two seasons with lowest value at forest stand 1 and highest at forest stand 4. Similarly, the estimated protease and flurosceindiacetate (FDA) activity was high at forest stand 4. Comparison among different soil properties was markedly higher during the pre-monsoon season and it decreases along the forest stand located in dry deciduous region during the study period. Conclusion: The higher microbial biomass and enzymatic activities at forest stand resides in temperate region suggested the higher nutrient availability and soil fertility in temperate forest.
Keywords: Microbial biomass; soil enzymes; spatial; temporal; forest soil; inorganic nutrients.
@2016 BioMedAsia All right reserved
ORIGINAL ARTICLE
ISSN 2278-1404
International Journal of Fundamental & Applied Sciences
Spatio-temporal variation in soil microbial biomass and enzymatic activity in
different forest ecosystem of North-India
*Corresponding author Full Address :
CSIR-National Botanical Research Institute, RanaPratapMarg, Lucknow-226001, India
Phone no. +91522-2205931
E-mail: [email protected]
Lovy Raj Chandra1,2*, Surabhi Gupta1, Veena Pande2 and Nandita Singh1
1Plant Ecology and Environmental Science Division, CSIR-National Botanical Research Institute, Rana Pratap Marg,
Lucknow-226 001, Uttar Pradesh, India
2Department of Biotechnology, Bhimtal Campus, Kumaun University, Nainital-263136, Uttarakhand, India
Manuscript received 31rd May, 2016 revised 05th July, 2016, accepted 08th July, 2016
viable cells and as a result of which a positive correlation among microbial biomass content and the enzyme activity are thus often found5. The investigators use extracellular enzyme assay for estimating the magnitude of microbial demand required during the degradation of polymeric compounds. A portion of nutrients present in soil is used by the microorganism responsible for decomposition & mineralization of organic matter, for their biomass formation. As a result of fast turnover, soil microbial biomass is resembled as an important source of nutrient & comprises approximately 2-3% of total organic carbon in soil2. Soil microbial biomass and microbial activity is a direct measure of changes in the soil organic matter content, controls the availability of essential nutrients to plants and soil micro biota. Fluxes in soil microbial biomass turnover, directly regulate the pattern of nutrients cycling, which in turn influence the availability of nutrients to plants6.
Forest soils that are the biggest reservoir of biodiversity, covers a major portion of terrestrial land and mainly responsible for biosphere functioning to climate change7. The productivity of forest ecosystem related to nutrient cycling can be determined by availability of nutrients, topography and other environmental issues. As a consequence of various factors including irregular decomposition, microbial diversity existence, variation in atmospheric conditions, heterogeneity phase developed in forest soil environment8 that ultimately results in the transportation of organic matter content to soil9. The resultant of organic matter input is decided by the enzymes activity of that particular soil. Additionally, enzymatic activity varies with the changing environment, and used as soil quality indicator that reveals the biological status of soil10.
It has been argued that soil physico-chemical, microbial biomass and enzyme activity may be influenced directly or indirectly by environmental factors including temperature, moisture, organic matter content, geographical status, soil parent material, plant species11,12. The soil quality is indirectly affected by the climatic conditions through plant species that regulate the microbial community composition and their enzymes activity13. In multi-factor climate change studies the plant and soil communities changes simultaneously, making it difficult to differentiate direct and indirect effects of the climate change factors or even obscuring the response14. However the individual effect of some factors are well known; still the information regarding existing interactions that results in divergence across the soil microbial communities are limited. Hence it’s required to understand how these environmental factors promote the abundance of microbial flora that is indispensable for nutrient recycling, plant growth and other ecological services.
Presently, a large number of publications focuses on the status of soil microbial biomass in different forest ecosystem have been available. Still, the knowledge in context of seasonal behavior in microbial biomass turnover in forest ecosystem persist multifaceted relationship among physico-chemical and biological features of soil, is limited. Therefore, the present study was undertaken to assess the impact of spatio-temporal variation in soil microbial biomass, enzymes activity and nutrient accessibility under natural forest ecosystem.
2. Materials and methods
2.1 Site description
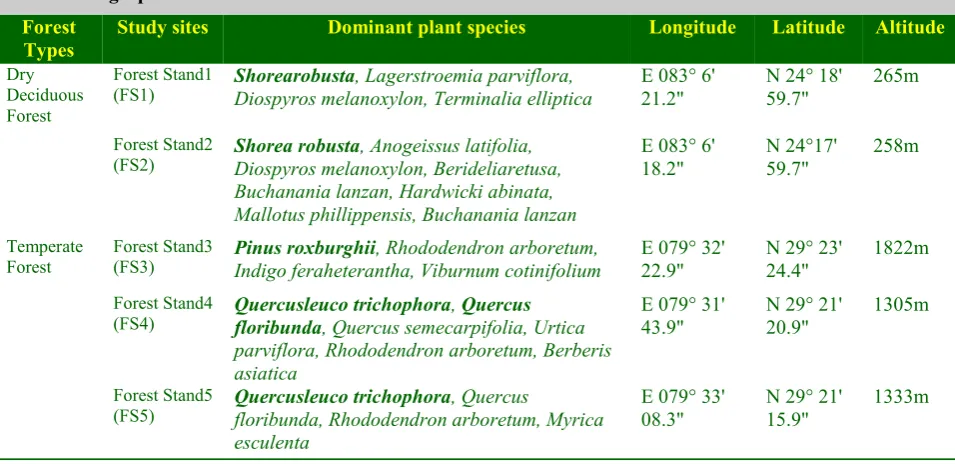
The study was undertaken in five different stands located at varying elevations, altitude and difference in vegetation types. The selected forest stands located at two different natural forests of North-India specified as dry-deciduous and temperate type, located at Sonbhadra and Nainital district of Uttar Pradesh and Uttarakhand, India, respectively. The Sonbhadra forest lies at E 83° 6' longitude, N 24° 15' latitude and Nainital forest situated at E 079° 29' longitude, N 29° 22' latitude, respectively. The geographical status of selected stands within the study area has been detailed in (table I). The Sonbhadra forest is dominated by Sal (Shorea robusta) followed by other existing species such as, Terminalia elliptica, Diospyrosmelanoxylon, Anogeissusl atifolia, Buteam onosperma and are dry-deciduous in nature. Similarly, Nainital forest is mainly dominated by Pine (Pinus roxburghii) and Oak (Quercus floribunda and Quercusl eucotrichophora) plantation, and is termed as temperate forest. In addition to the dominant species other associated species of Quercus semecarpifolia, Rhododendron arboretum, Urtica parviflora, Aceroblongum have also been occurred in the area. 2.2 Climatic conditions
The sampling was done in the pre and post monsoon season at an interval of 6 months between the two seasons from the selected sites in the month of April and October upto two annual cycles. For sampling, the selected stands were divided into five plots (5m X 5m) at an average distance of 5 km in between the plots. The soil samples were randomly collected in replicates from the rhizospheric zone of existing tree species within the established plots at 0-10cm depth and composited into single sample per plot. A total of five samples per stand were collected for one season. The same sampling procedure has been followed throughout the study. The collected samples were taken to laboratory for analysis. The samples were divided into two parts and a part of each sample was stored at 4 °C for the analysis of microbial and biochemical activities. For the physico-chemical analysis, the samples were air-dried, homogenized and sieved using 2mm mesh screen to remove the organic material and fine roots.
2.4 Soil analysis
All the analysis was done on seasonal basis except for soil texture. Soil texture was done by hydrometric method. Soil pH and electrical conductivity (EC)was measured by Orion star ion analyzer using soil:distilled water suspension (1:2.5). Total nitrogen (TN), phosphorous (TP) and potassium (TK) were estimated by the protocol given by Kjeldahl15, stannous-chloride16 and flame photometric method17, respectively. Total organic carbon was analyzed by Walkey and Black method18. Nitrate nitrogen (NO3--N) and ammonical nitrogen (NH4+ -N) was analyzed by the Phenol disulphonic acid method17 and Phenate method19, respectively.
2.5 Soil Microbial carbon, nitrogen and phosphorous Microbial biomass carbon (MBC), nitrogen (MBN) and phosphorous (MBP) was estimated using chloroform
fumigation extraction method20-22. Briefly, for each soil, triplicate subsamples (each 12.5gm fresh soil) were fumigated with ethanol-free chloroform for 24hours in vaccum desiccators and remaining were taken as control (fumigated). For MBC, fumigated and non-fumigated soils were extracted using 0.5M K2SO4 for 30min by continuous shaking. The extracts were filtered and processed using potassium dichromate method20. MBN and MBP were estimated by Kjeldahl method15 and Olsen method23, respectively followed by extraction with 0.5M NaHCO3. MBC, MBN and MBP were intended by difference between fumigated and non-fumigated values with a conversion factor of 0.33 for MBC, 0.54 for MBN and 0.40 for MBP.
2.6 Enzyme Assays
Soil enzymatic activities were determined in fresh soil. Acid phosphatase and β-glucosidase activity was measured following the protocol given by Eivazi and Tabatabai, 1977;198824,25, using p-Nitro phenyl phosphate (pNPP) and p-Nitro phenyl-β-D-glucopyranoside (pNPG) as substrate in acid phosphatase and β-glucosidase, respectively. Fluorescein diacetate (FDA) hydrolysis assay was done by the method proposed by Stubberfield and Shaw,199026 and fluorescence was quantified by measuring the absorbance after centrifuge the soil suspension incubated with phosphate buffer and FDA solution (prepare in acetone). Dehydrogenase (DHA) activity was assayed by Pepper et al.,1995 method27, the quantity of 2, 3, 5– triphenyltetrazolium chloride (TTC) reduced was measured and final activity was expressed in formazanper gram soil per hour. Protease activity was assayed using tyrosine as standard28 and measured by quantify the amount of amino acids released on incubating the sample with Na-caseinate at 50° C for 2 h
Forest Types
Study sites Dominant plant species Longitude Latitude Altitude
Dry Deciduous Forest
Forest Stand1
(FS1) ShorearobustaDiospyros melanoxylon, Terminalia elliptica, Lagerstroemia parviflora, E 083° 6' 21.2" N 24° 18' 59.7" 265m
Forest Stand2
(FS2) Shorea robustaDiospyros melanoxylon, Berideliaretusa, , Anogeissus latifolia, Buchanania lanzan, Hardwicki abinata, Mallotus phillippensis, Buchanania lanzan
E 083° 6'
18.2" N 24°17' 59.7" 258m
Temperate
Forest Forest Stand3 (FS3) Pinus roxburghiiIndigo feraheterantha, Viburnum cotinifolium, Rhododendron arboretum, E 079° 32' 22.9" N 29° 23' 24.4" 1822m
Forest Stand4
(FS4) Quercusleuco trichophorafloribunda, Quercus semecarpifolia, Urtica , Quercus parviflora, Rhododendron arboretum, Berberis asiatica
E 079° 31'
43.9" N 29° 21' 20.9" 1305m
Forest Stand5
(FS5) Quercusleuco trichophorafloribunda, Rhododendron arboretum, Myrica , Quercus esculenta
E 079° 33' 08.3"
N 29° 21' 15.9"
using Folin’s-Ciocalteau reagent, and the result was expressed in µg tyrosine per gram soil per two hours. 2.7 Statistical Analysis
The experimental data were expressed as the Mean ± SD of two consecutive seasons. Groups were compared by two factor repeated measures analysis of variance (ANOVA) and the significance of mean difference between the groups was done by Tukey’s post hoc test. Bi-variate Pearson correlation and multiple linear regression analyses were done to assess association between the variables. A two-tailed p<0.05 was considered statistically significant. Analyses were performed on SPSS software (windows version 17.0).
3. Results
3.1 Physico-chemical characteristics
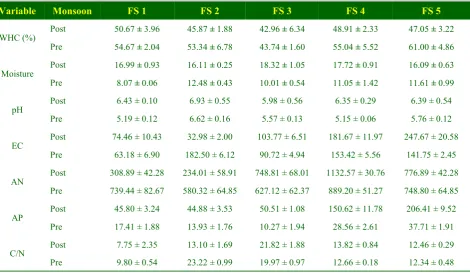
The physico-chemical characters are summarized in (table II). The pH of all the sites was acidic in nature. The mean seasonal values of soil WHC and moisture ranged from 42.96-61.00% and 8.07-18.32%, with higher values of WHC (%) in pre-monsoon whereas the moisture (%) is higher in post-monsoon.
3.2 Nutrient status
The mean seasonal concentration of total nitrogen, total phosphorous and total carbon ranged from 634.14-5660 µg g–1, 131.52-524.11 µg g–1, 4.25-69.92 mg g-1 respectively. Similarly, the value of NH+
3-N and NO3--N varied from 3.66-13.82 µg g–1 and 1.30-10.39 µg g–1, respectively. Comparatively higher values of inorganic nutrient were obtained in pre-monsoon season over all sites (Figure.I).
3.3 Soil Microbial carbon, nitrogen and phosphorous Soil microbial biomass carbon showed seasonal variation ranged from 151.63 - 471.1 µg g-1 across all the sites and varied significantly with respect to the sampling sites. Similarly, microbial biomass nitrogen ranged from 36.56 - 88.68 µg g-1 and microbial phosphorous ranged from 15.73 - 62.18 µg g-1. Microbial biomass carbon, nitrogen and phosphorous were high in pre-monsoon over post-monsoon (Figure. II).
3.4 Enzyme Assays
The seasonal variation in enzymes activity ranged between 918.97 – 3207.81 µg g-1 hr-1, 111.76 – 1514.95 µg g-1 hr-1, 38.61 – 649.94 µg g-1 hr-1, 2101.24 – 5691.12 µg g-1 hr-1 and 43.95 – 562.07 µg g-1 hr-1 for acid phosphatase, β-glucosidase, DHA, protease and FDA, respectively. Activity of all the enzymes was high in pre-monsoon whereas it was reverse in case of protease (Figure. III).
3.5 Statistical Analysis
Evaluating the effect of lands and seasons on soil characteristics, ANOVA revealed significant (p<0.01 or p<0.001) effect of both seasons and lands on soil characteristics (table III). The comparison showed that all the soil characteristics were varied significantly (p<0.01 or p<0.001) at all lands. Additionally, the seasonal variations were also found to be significant for all the soil characteristics. To see the association between the variables, bi-variate Pearson correlation and multivariate (multiple) linear regression analysis was done and summarized in (table IV, V). Most of the variables showed significant (p<0.05 or p<0.01 or Table II: Physico-chemical characteristics of different forest lands at two different seasons
Variable Monsoon FS 1 FS 2 FS 3 FS 4 FS 5
WHC (%) Post 50.67 ± 3.96 45.87 ± 1.88 42.96 ± 6.34 48.91 ± 2.33 47.05 ± 3.22 Pre 54.67 ± 2.04 53.34 ± 6.78 43.74 ± 1.60 55.04 ± 5.52 61.00 ± 4.86
Moisture Post 16.99 ± 0.93 16.11 ± 0.25 18.32 ± 1.05 17.72 ± 0.91 16.09 ± 0.63 Pre 8.07 ± 0.06 12.48 ± 0.43 10.01 ± 0.54 11.05 ± 1.42 11.61 ± 0.99
pH Post 6.43 ± 0.10 6.93 ± 0.55 5.98 ± 0.56 6.35 ± 0.29 6.39 ± 0.54 Pre 5.19 ± 0.12 6.62 ± 0.16 5.57 ± 0.13 5.15 ± 0.06 5.76 ± 0.12
EC Post 74.46 ± 10.43 32.98 ± 2.00 103.77 ± 6.51 181.67 ± 11.97 247.67 ± 20.58 Pre 63.18 ± 6.90 182.50 ± 6.12 90.72 ± 4.94 153.42 ± 5.56 141.75 ± 2.45
AN Post 308.89 ± 42.28 234.01 ± 58.91 748.81 ± 68.01 1132.57 ± 30.76 776.89 ± 42.28 Pre 739.44 ± 82.67 580.32 ± 64.85 627.12 ± 62.37 889.20 ± 51.27 748.80 ± 64.85
AP Post 45.80 ± 3.24 44.88 ± 3.53 50.51 ± 1.08 150.62 ± 11.78 206.41 ± 9.52 Pre 17.41 ± 1.88 13.93 ± 1.76 10.27 ± 1.94 28.56 ± 2.61 37.71 ± 1.91
Figure I: Spatio-temporal patterns of nutrients among selected forest stands. Values are expressed as mean ± SD and data is significant at p<0.05
Figure III: Spatio-temporal patterns of soil enzymes assay. A. Acid phosphatase, B. β-glucosidase, C. DHA, D. Protease, E. FDA. Values are expressed as mean ± SD and data is significant at p<0.05
Table III: Effect of season and location (forest land) on soil characteristics using two way ANOVA
Location Season Location x Season
F Value P Value F Value P Value F Value P Value
TOC 2811.31 <0.001 4095.53 <0.001 337.41 <0.001 TN 7026.06 <0.001 5442.52 <0.001 1135.16 <0.001 TP 484.10 <0.001 498.52 <0.001 19.23 <0.001 NH3- 333.35 <0.001 2030.00 <0.001 116.78 <0.001 NO3- 290.82 <0.001 258.37 <0.001 25.70 <0.001 MBC 179.92 <0.001 220.15 <0.001 17.60 <0.001 MBN 158.33 <0.001 625.44 <0.001 20.79 <0.001
MBP 355.49 <0.001 88.76 <0.001 4.45 0.007
p<0.001) and positive (direct) correlation with each other. Multiple regression analysis showed TOC the significant predictor of all variables except MBC and DHA. Similarly, TN showed significant predictor of all variables except MBN. In contrast, TP also showed significant predictor of all variables except MBC, MBN and acid phosphatase. To find out the independent predictors or to estimate enzymes variables from biological parameters i.e. MBC, MBN and MBP, a multivariate (multiple) linear regression analysis was further done between biological and enzymes variables considering MBC, MBN and MBP as independent variables and enzymes (acid phosphatase, β-gluocosidase, DHA, protease and FDA) the dependent variable. Multiple regression analysis showed MBC the significant predictor of β-glucosidase and protease. In
contrast, MBN was found to be significant and independent predictors of all enzyme variables. Conversely, MBP showed significant and independent predictor of protease and FDA.
4. Discussion
A significant variation has been observed among soil physico-chemical as well as biological attributes during different season and at different sites. The variation in the availability of nutrients is explained by the pattern of forest succession that is responsible for the difference in oganic matter content. This ultimate difference creates a significant variation in the pattern of total carbon, nitrogen and phosphorous content among the selected forest stand in the study29. It has beenproposed that soil organic matter directly influence the carbon, nitrogen and phosphorous content of soil30. Soil organic matter Table IV: Correlation between different soil variables
Variables TOC TN TP MBC MBN MBP Phos-Acid
phatase β-
Gluoco-sidase
DHA Protease FDA
TOC 1.00
TN 0.89*** 1.00
TP 0.31* 0.48*** 1.00
MBC 0.76*** 0.83*** 0.34** 1.00
MBN 0.83*** 0.79*** 0.28* 0.82*** 1.00 MBP 0.77*** 0.83*** 0.55*** 0.91*** 0.80*** 1.00 A. Phosp 0.92*** 0.89*** 0.38** 0.71*** 0.80*** 0.71*** 1.00 β-Gluoco 0.73*** 0.82*** 0.04ns 0.82*** 0.77*** 0.73*** 0.75*** 1.00 DHA 0.82*** 0.93*** 0.30* 0.71*** 0.77*** 0.67*** 0.91*** 0.84*** 1.00 Protease 0.33** 0.33** 0.61*** 0.11ns 0.35** 0.26* 0.42*** -0.08ns 0.34** 1.00 FDA 0.80*** 0.77*** 0.06ns 0.70*** 0.89*** 0.61*** 0.83*** 0.80*** 0.86*** 0.35** 1.00
ns- p>0.05, p<0.05, **- p<0.01, ***- p<0.001
Table V: Multiple regression analysis between the soil variables
Dependent variable
Independent variables
TOC TN TP
b p value b p value b p value
MBC 0.40 0.520 0.04 <0.001 -0.04 0.510
MBN 0.36 0.002 0.00 0.064 -0.01 0.604
MBP 0.18 0.050 0.00 0.013 0.03 0.005
A. phosp 21.86 <0.001 0.13 0.014 0.29 0.443 β-Gluco -4.84 0.042 0.33 <0.001 -1.87 <0.001
DHA -1.30 0.164 0.15 <0.001 -0.41 <0.001 Protease 36.45 0.013 -0.44 0.041 8.54 <0.001 FDA 2.16 0.037 0.06 <0.001 -0.45 <0.001
MBC MBN MBP
b p value b p value b p value
A. phosp 0.35 0.850 32.64 <0.001 9.59 0.380
β-Gluco 3.91 <0.001 9.15 0.017 -6.32 0.273
DHA 0.67 0.247 8.97 <0.001 -0.49 0.885
Protease -17.96 0.001 65.12 0.001 70.50 0.020
controls the physical, chemical and biological properties of soil ecosystem, and provides favorable condition for the survival of microbial flora31. The decrease in soil organic matter directly lowers the concentration of essential nutrients. As a result of strong demand for available nutrients in growing season, the pattern of inorganic nutrients was recorded low in post-monsoon over the pre-monsoon sampling in all the sites. Additionally with varying organic matter content among the different forest stand leads to a varied level in the nutrient status among the different forest stand located in dry-deciduous and the temperate part. However, the discharge of free ammonium and amino acids during the dry condition and nutrient leaching may also be responsible for the seasonal fluctuation in the magnitude of NH3+-N among the two sampling conditions32. In our study also these effects are justifying the variation in nutrient concentrations.
The values of MBC, MBN and MBP exhibited a significant variation among the selected forest stand. Other authors also reported the analogous results and also illustrated that pedoclimatic environment and forest type can be explicated for such variations33,34. The variations due to sites were also significant. Microbial biomass carbon, nitrogen and phosphorous being high in pre-monsoon and the values decline in post-monsoon season. Sanchez (1976)35 proposed that microbial activity declines in wet soil condition as a consequence of plasmoptysis. In wet season there is an exponential increase in microbivore but at the same time feeding of these actively growing microbivore results in the reduction of microbial biomass and increases microbial turnover. Further, during the post-monsoon period comparatively higher demand of existing nutrients by vigorously growing plants may restrict the accessibility of essential nutrients for the soil microbial inhabitants which in turn lower the amount of microbial biomass36. The recorded MBC, MBN & MBP values of present study are supported by others research37, 38. Additionally, authors have reported the nutrient limiting condition in soil among the dry deciduous forest responsible for decline microbial biomass and nutrient availability in the forest stand 1 and 237.
Enzyme assay indicate the functional potential of soil microbial composition and nutrient supply ability. Previous studies have already documented the significant correlation between enzyme activity and the microbial population that shows the potentialities of soil nutrient supply. The declined temperature and elevated water content may lower the redox potential results in anaerobic soil conditions which would limit enzyme activities during the post-monsoon season. Sardans and Penuelas, 200539, asserted that the activity of soil enzymes varied spatially as well as temporally in a given
region. In the present study, the enzyme activities are high during the pre-monsoon which kept parallel trends with microbial biomass C, N & P. Investigators reported significantly negative correlation between soil acid phosphates and phosphorous content, explaining the results in previous studies40. On the contrary, Pearson’s correlation indicated no significant correlation between soil acid phosphatase and phosphorous content in present study. However there is slight literature explaining these contradictory results to previous studies. Additionally, DHA is the measure of metabolic activity via respiration thus increase in respiration may expect that the DHA activity would increase as well41. It is recorded that the forest stand with low microbial biomass displayed comparatively low values of DHA and other enzymes. However it is very difficult to measure the relation between microbial activity and enzymes property accurately in a soil system because of highly diverse population involved in the mineralization processes of organic compounds.
The fluctuation in soil properties during the two years of study period, suggested that biotic as well as abiotic conditions exhibited significant temporal and spatial variation on soil microbial biomass and enzymatic activity with higher values during the pre-monsoon (dry period) over the post-monsoon (wet period) among the selected forest stand, which was found to be decreased along the forest stand located in the dry deciduous region. The variation in soil microbial and enzymatic activity directly influences the soil nutrient availability and overall functioning of soil. These variations in the soil attribute appear to be determining factors in maintaining the soil physico-chemical status and the overall dynamics.
Acknowledgements
The authors gratefully acknowledge UGC for providing financial support during the research. Authors indebted to Director, CSIR-NBRI for providing institutional support and technical helpto carry out the research work. The study was supported by CSIR-Network Project BSC -0109 (SIMPLE) and by DST (Grant No.DST/CCP/ PR/03/2011).
Conflict of interest
The author’s declares none.References
1. Mehta JP, Shreshthamani & Bhatt VP. Analysis of the physico-chemical properties of the soil and climatic attribute on vegetation in Central Himalaya. Nature & Science 12 (2014), 46-54.
processes to increase nitrogen availability and retention in agroecosystems. Current Opinion in Enviromental Sustainability 4 (2012), 517-522. 3. Gessner MO, Swan CM, Dang CK, McKie BG,
Bardgett RD, Wall DH &HattenschwilerS. Diversity meets decomposition. Trends in Ecology & Evolution 25 (2013), 372-380.
4. Baldrian P.Distribution of extracellular enzymes in soils: Spatial Heterogeneity and determining factors at various scales. Soil Science Society of American Journal 78 (2014), 11-18.
5. Baldrian P &Stursova M. Enzymes in forest soils. In: G. Shukla and A. Varma, editors, Soil enzymology. Springer-Verlag, Berlin (2011).
6. Melero S, Porrai JCR, Herencia JF &Madejon E. Chemical and biochemical properties in a silty loam soil under conventional and organic management. Soil Tillage & Research 90 (2006), 162-170.
7. Samantha R, Weintraub, William R, Wieder CC, Cleveland & Townsend AK. Organic matter inputs shift soil enzyme activity and allocation patterns in a wet tropical forest. Biogeochemistry 114 (2012), 313 -326.
8. Miettinen J, Shi C &Liew S. Two decades of destruction in Southeast Asia’s peat swamp forests. Frontier in Ecology and the Environment 10 2012), 124-128.
9. Taylor PG. Carbon and nutrient cycling in tropical forests: climatic, hydrologic and stoichiometric controls. Dissertation. University of Colorado, Boulder Vegetation, International Agrophysics (2012).
10. Singh RD, Arunkumar K, Patra AK, Sahu SK, Khan MA&Bhople BS. Impact of Different Land use Management on Soil Enzyme Activities and Bacterial Genetic Finger Prints of North-Western Himalayas. Current World Environment 9 (2014), 728-740.
11. Gosai K, Arunachalam A &Dutta BK. Tillage effects on soil microbial biomass in a rainfed agricultural system of Northeast India. Soil & Tillage Research 109 (2010), 68-74.
12. Baldrian P, Snajdr J, Merhautova V, Dobiasova P, Cajthaml T &Valaskova V. Responses of the extracellular enzyme activities in hardwood forest to soil temperature and seasonality and the potential effects of climate change. Soil Biology & Biochemistry 56 (2013),60-68.
13. Snajdr J, Dobiasova P, Urbanova M, Petrankova, Cajthaml MT, Frouz J &Baldrian P. Dominant trees affect microbial community composition and activity in post-mining afforested soils. Soil Biology & Biochemistry 56 (2013), 105-115.
14. Dermody O. Mucking through multifactor experiments: design and analysis of multifactor studies in global change research. New Phytologist 172 (2006),598-600.
15. Black CA. Methods of soil analysis. Agron. Monogr. 9, ASA, Madison, WI, USA (1965).
16. Sparling GP, Whale KW & Ramsay A J. Quantifying the contribution from the soil microbial biomass to the extractable P levels of fresh and air dried soils. Australian Journal of Soil Research 23 (1985), 613-621.
17. Jackson ML. Soil Chemical analysis. Englewood Cliffs, New Jersey: Prantice Hall Inc (1958).
18. Walkley A & Black IA. An examination of the Degtjareff method for determining soil organic matter and a proposed modification of chromic acid titration method. Soil Science 37 (1934), 29-38.
19. APHA, Standard methods for the examination of water and waste water, 19th Edt. (1995).
20. Vance ED, Brookes PC &Jenkenson DS. An extraction method for measuring soil microbial biomass C. Soil Biology & Biochemistry 19 (1987), 703-707.
21. Brookes PC, Powlson DS &Jenkinson DS. Measurement of microbial biomass phosphorus in soil. Soil Biology & Biochemistry 14 (1982), 319-329. 22. Brookes PC, Landman A, Pruden G &Jenkinson DS.
23. Olsen S, Watanabe FS & Bowman RA.Evaluation of fertilizer phosphate residues by plant uptake and extractable phosphorus. Soil Science Society of American Journal 47 (1983), 952-958.
24. Eivazi F &Tabatabai MA.Tabatabai, Glucosidases and galactosidases in soils. Soil Biology & Biochemistry 20 (1977), 601-606.
25. Eivazi F&Tabatabai MA. Tabatabai, Phosphatases in soils. Soil Biology & Biochemistry 9 (1988),167-172. 26. Stubberfield LCF & Shaw PJA. A comparison of tetrazolium reduction and FDA hydrolysis with other measurements of microbial activity. Journal of Microbiological Methods 12 (1990), 151-162. 27. Pepper IL, Gerba CP &Brendecke JW.Brendecke,
Environ. Microbiology: A Laboratory Manual. Academic Press, New York (1995).
28. Ladd JN & Butler JHA. Short-term assays of soil proteolytic enzyme activities using proteins and dipeptlde derivatives as substrates. Soil Biology & Biochemistry 4 (1972), 19-30.
29. Murugayah RAP, Gandaseca S, Ahmed OH &Majid NMA. Effects of different ages of a rehabilitated forest on selected physico-chemical properties. American Journal of Applied Sciences 6 (2009),1043-1046.
30. Mills AJ & Fey MV. Declining soil quality in South Africa: effects of land use on soil organic matter and surface crusting. South African Journal of Science 99 (2003), 429- 436.
31. Horwath WR. The importance of soil organic matter in the fertility of organic production systems, Western Nutrient Management Conference (2005).
32. Tripathi N & Singh RS. Cultivation impacts soil microbial dynamics in dry tropical forest ecosystem in India. ActaEcologicaSinica 33 (2013), 344-353. 33. Barbhuiya AR, Arunachalam A, Pandey HN,
Arunachalam K, Khan ML &Nath PC. Dynamics of soil microbial biomass C, N and P in disturbed and undisturbed stands of a tropical wet-evergreen forest. European Journal of Soil Biology 40 (2004), 113-121.
34. Sugihara S, Funakawa S, Kilasara M &Kosaki T. Effect of land management and soil texture on seasonal variations in soil microbial biomass in dry tropical agrosystems in Tanzaniz. Applied Soil Ecology 44 (2010), 80-88.
35. Sanchez PA. Properties and Management of Soils in the Tropics. John Wiley, New York (1976).
36. Raghubanshi AS. Dynamics of soil biomass C,N and P in a dry tropical forest in India. Biology &Fertility of Soils 12 (1991), 55-59.
37. Singh JS, Singh DP &KashyapAK. Microbial Biomass C, N and P in Disturbed Dry Tropical Forest Soils, India. Pedosphere 20 (2010), 780-788.
38. Bhattarai KP &Mandal TN. Soil microbial biomass in relation to fine root in Kiteni hill Sal forest of Ilam, eastern Nepal. Nepalese Journal of Biosciences 2 (2012), 80-87.
39. Sardans J &Penuelas J. Drought decreases soil enzyme activity in a Mediterranean Quercus ilex L. forest. Soil Biology & Biochemistry 37 (2005), 455-461.
40. Huang W, Liu J, Zhou G, Zhang D & Deng Q. Effects of precipitation on soil acid phosphatase activity in three successional forests in southern China. Biogeosciences 8 (2011), 1901-1910.