Research Journal
Volume 12, No. 3, September 2018, pages 10–15
DOI: 10.12913/22998624/93613 Research Article
NANOSECOND Yb FIBRE LASER MILLING OF ALUMINIUM BRONZE:
EFFECT OF PROCESS PARAMETERS ON THE SURFACE FINISH
Peter Šugár1, Jana Šugárová1, Martin Frnčík1, Barbora Ludrovcová1
1 Slovak University of Technology, Faculty of Materials Science and Technology, Institute of Production Technologies, J. Bottu 25, 917 24 Trnava, Slovakia, e-mail: [email protected]
ABSTRACT
In this study the relationship between laser beam machining parameters and machined
surface quality, applying nanosecond pulsed ytterbium fibre laser (wavelenght 1064 nm, maximal average output power 100 W) and aluminium bronze (AMPCO 25®) as working material, is experimentally studied. The laser micromilling was performed
via the cross hatching milling strategy. The influence of the laser pulse intensity, scan -ning speed and laser track distance on the machined surface morphology formation
and surface roughness parameters was evaluated using ANOVA (Analysis of Vari
-ance). Finally, the machining quality was evaluated by means of SEM micrographs. The results show that the laser pulse intensity played the most significant role on the final surface morphology formation. It was also documented only negligible influence of the laser track distance on the final surface roughness.
Keywords: laser milling, aluminium bronze, surface roughness.
INTRODUCTION
Laser beam milling is one of the most wide-ly used advanced machining processes that re -moves material by ablation in a layer-by-layer fashion. One of the most important consider -ations of the laser beam milling is complex quality of the machined surface, which gen-erally includes surface roughness, residual stresses, micro-hardness, white layer forma-tion, microstructure transformation and so on. Different surface quality and functional per-formance of machined product can be obtained mainly by varying laser pulses parameters and laser machining strategy, which together with a type of workpiece material determine wheth-er evaporation, melt ejection or vaporization dominates the process of material removal and machined surface morphology formation [1]. Optimal selection of process parameters is highly critical for successful material removal and high machined surface quality.
There are many studies which deal with how laser machining parameters affect the removal rate and the quality of machined surface of differ -ent types of materials [2÷8]. Regarding the laser machining of copper the research work of Tunna et al. [9] should be mentioned. They investigated physical effects of processing 99.9% copper at three wavelengths and a range of intensities. They stated that maximum removal rate per pulse when processing at 1064 nm was considerably less than the maximum removal rates observed when pro -cessing with 355 and 532 nm. The range of thermal vaporization dominated machining of copper us -ing Nd:YAG nanosecond laser was studied and the optimum laser intensities for micromachining was suggested in [10]. It was documented that the most efficient material removal is achieved by irradiat -ing pulses in the optimum fluence range. Research works [11, 12] have shown that during microma -chining of copper, both material removal rate and machined surface quality increase by using femto-second compared to picofemto-second laser pulses. Fem
tosecond laser ablation of copper, by experimental and numerical way, is studied in [13].
From the review of actual research works it is found that many studies deal with the problem of laser processing of pure copper, but less effort was devoted to the study of laser micromachining of different types of copper-based alloys [14, 15]. These studies also provide insight into optimizing process parameters to improve mainly the mate -rial removal mechanisms, a little less attention is given to the machined surfaces quality. In order to gain deeper insight in this research topic, laser mi-cromachining of aluminium bronze is studied in this article. The influence of nanosecond laser pro -cessing on the machined surface morphology and surface roughness is experimentally evaluated.
METHODS AND MATERIALS
In order to contribute to understanding the re-lationships between process parameters and sur-face quality of copper-based alloy (aluminium brass), the series of experiments were carried out applying the five axis highly dynamic laser preci
-sion machining centre Lasertec 80 Shape equipped with the low-power nanosecond ytterbium-doped fiber laser (wave length 1064 nm, maximal aver -age output power 100 W, pulse duration 120 ns, repetition rate 80 kHz) and aluminium bronze (AMPCO 25®) as working material. The mate -rial of workpiece is patented alloy that displays outstanding mechanical properties. The extreme hardness, linked with an excellent compressive strength and very good friction properties, makes it ideal as a forming and drawing die material. On the other hand, laser processing of this type of material has inherent problems due to its high reflectance and its very high thermal conductivity. Selected physical and mechanical properties of experimental material are shown in Table 1.
The experimental set up used for laser ma-chining is shown in the Fig. 1.
The influence of laser pulse energy, scanning speed and laser track distance on the response – surface roughness of machined surface – has been studied. The experimental layout was used in this study (three factors at three levels each). The fac -tors and their levels are listed in Table 2.
Table 1. Physical and mechanical properties of the
sample [16]
Rockwell hardness
[HR]
Modulus of elasticity
[GPa]
Density [g∙cm-3]
Thermal conductivity
[W∙m-1∙K-1]
40 110 6.93 33
Fig. 1. Experimental set up used for laser machining
1 – beam guidance with the highly dynamic scanner
acts as an optical axis system, 2 – Z-level measuring probe, 3 – positioning and measuring CCD camera,
4 – workpiece
Table 2. Factors of the experiment and their levels
Experimental factor Level
1 2 3
Laser pulse intensity (PI)
[x108 W.cm-2] 1.27 1.96 2.6 Scanning speed (SS)
[mm.s-1] 1000 1600 2200 Laser track distance (TD)
[µm] 12.5 20 27.5
Twenty seven cavities (with square shape and 5 mm long sides) (Fig. 2) were machined by cross hatching milling strategy, according to the full factorial plan of experiment (33). The material
was removed by layer-by-layer manner with total
number of 30 layers.
Roughness parameters were measured using a contact-gauge profilometer Zeiss Surfcom 5000. The profile parameters Ra, Rq and the Abbotte-Firestone curve parameters Rpk, Rvk were elabo -rated and reported in two directions perpendicu-lar to each other. The measurement were taken according to the standards [17, 18, 19]. Further, surface morphologies were investigated using a scanning electron microscopy (SEM) imaging. In order to quantify the effects of the studied factors and interactive influences among them on the sur -face profile parameters, the analysis of variance (ANOVA) using Minitab v. 17 software was per -formed. The Fisher’s ratio (F-ratio), which is the ratio between the variance due to the effect of a
factor and the variance due to an error term, was used to measure the significance of the factor at the desired significance level. If the F-test value is greater than the tabulated F-test value, the process parameter is considered significant.
RESULT AND DISCUSSION
Surface roughness analysis
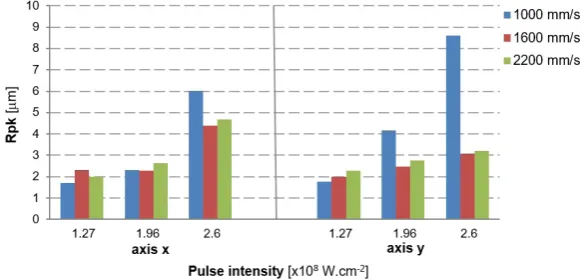
The results within the scope of changes in Rq, Rpk (this parameter is used to characterize protruding peaks that might be eliminated dur-ing function ) and Rvk (this parameter is used to characterize the valleys that will retain lubricant or worn-out materials) as a function of the laser pulse intensity applied are presented in the form of bar graphs in Fig. 3 – 5.
It may be seen that laser machined surface finishing strongly depends on laser pulse intensi -ties applied during the process. Worse surface fin -ish was reached in the cases when the high values
Fig. 3. Surface roughness parameter Rq of surfaces fabricated with different laser pulse intensities and scanning
speeds
Fig. 4. Surface roughness parameter Rpk (reduced peak height) of surfaces fabricated with different laser pulse
of pulse intensity was used. The hight values of pulse intensity in combination with the minimal scanning speed give the worst microgeometrical quality of laser machined surface in both mea-sured directions.
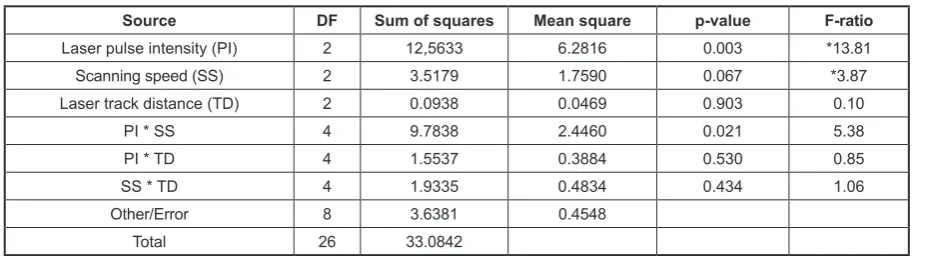
The results of the ANOVA and F-test for sur -face roughness (parameter Rq) measured in the
two direction, perpendicular to each other, are shown in Tables 3 and 4.
The results of ANOVA show that the signifi -cant effect of laser pulse intensity on surface finish variation is clearly seen in both measured direc -tions. The machined surface roughness in the y-direction is also affected by scanning speed. The Fig. 5. Surface roughness parameter Rvk (reduced valley depth) of surfaces fabricated with different laser pulse
intensities and scanning speeds
Table 3. Analysis of variance – Rq-x
Source DF Sum of squares Mean square p-value F-ratio
Laser pulse intensity (PI) 2 11.2214 5.6107 0.001 *18.29 Scanning speed (SS) 2 2.0196 1.0098 0.091 3.29 Laser track distance (TD) 2 0.4397 0.2199 0.517 0.72
PI * SS 4 5.7039 1.4260 0.031 4.65
PI * TD 4 0.9972 0.2493 0.551 0.81
SS * TD 4 0.3431 0.0858 0.883 0.28
Other/Error 8 2.4543 0.3068
Total 26 23.1792
Tabulated F-ratio at 95% confidence level: F (0.05; 2.8) = 4.46; F (0.05; 4.8) = 3.84 * significant parameter, R2 = 89,41%, R2
adj = 65,59%
Table 4. Analysis of variance – Rq-y
Source DF Sum of squares Mean square p-value F-ratio
Laser pulse intensity (PI) 2 12,5633 6.2816 0.003 *13.81 Scanning speed (SS) 2 3.5179 1.7590 0.067 *3.87 Laser track distance (TD) 2 0.0938 0.0469 0.903 0.10
PI * SS 4 9.7838 2.4460 0.021 5.38
PI * TD 4 1.5537 0.3884 0.530 0.85
SS * TD 4 1.9335 0.4834 0.434 1.06
Other/Error 8 3.6381 0.4548
Total 26 33.0842
Tabulated F-ratio at 95% confidence level: F (0.05; 2.8) = 4.46; F (0.05; 4.8) = 3.84 * significant parameter, R2 = 89%, R2
results further showed that for surface roughness there is only one significant interaction among the input parameters, which is the laser pulse inten-sity and scanning speed (F-ratio: 4.65 to 5.38).
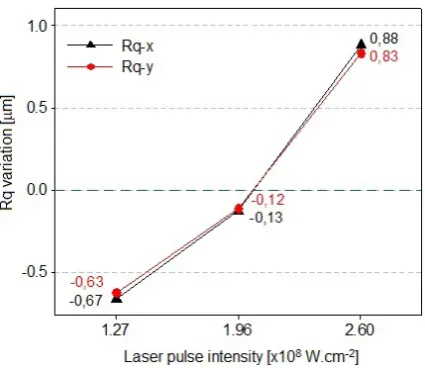
Fig. 6 – 8 show graphs of the effects of the input parameters on the surface roughness. It is clear that maximal roughness can be expected when the maximal high pulse intensity in combi-nation with low scanning speed is used.
The SEM microghaphs of selected machined surfaces in Fig. 9 show transition in surface mor -phology when different laser pulse intensities are applied. The machined surfaces are created by molten and resolified particles of micrometer scale, which are more evident in the case when the lower pulse intensity is used (a few of them are highlighted by white arrows in Fig. 9c). Laser irra -diation of lower pulse intensity resulted in creating directionaly oriented texture (Fig. 9a). Despite the fact that micro melt structure of surfaces produced under higher pulse intensity (Fig. 9b, d) seem to be finer, an unintended microcraters of diameter approximately 30 – 40 µm, randomly originated at the surface (highligted by white arrow in Fig. 9b), cause the downgrade of the surface quality.
CONCLUSIONS
On the basis of the results obtained from this investigation and statistical analysis, the
follow-ing conclusions can be drawn:
Fig. 6. Main effects plots of machined surface rough
-ness versus laser pulse intensity
Fig. 7. Main effects plots of machined surface rough
-ness versus scanning speed
Fig. 8. Main effects plots of machined surface rough
-ness versus laser track distance
Fig. 9. SEM micrographs of machined surfaces (SS =
1000 mm.s-1, TD = 20 µm), a) (250x), c (500x) – PI
= 1.27 x 10⁸W.cm-2; profile parameters Rq(x) = 1.568
µm, Rq(y) = 1.761 µm, b) (250x), d (500x) – PI = 2.6
x 108W.cm-2;profile parameters Rq(x) = 4.149 µm,
• Significant effect of the laser pulse inten -sity on the surface morphology and surface roughness has been observed that is in adi -tion affected by scanning speed. It was
con-firmed that high laser pulse intensities lead
to the worst surface finish. It agrees with the results of other authors, who studied the laser machining parameters influence on machined surface quality for copper [9, 11, 12] and re -ported that only a very narrow range (1.06 x 10⁸ to 1.8 x 10⁸ W.cm-2) of vaporisation domi -nated ablation exists for nanosecond lasers. At high intensities plasma effects and gas dy -namic effects and their impact on the surface quality should be considered [10].
• Only minimal effect has been reported in the case of laser track distance.
• For the best results the laser pulse intensity 1.27 x 10⁸ W.cm-2 is recommended in combination with scanning speed 1600 mm.s-1 and laser track distance 20 µm, which means 60 % trans -verse overlap of consecutive laser beam tracks.
ACKNOWLEDGMENTS
This research was supported by an interna-tional research project under the MANUNET 2014 call, entitled: Innovative methods of sheet metal forming tools surfaces improvement - R&D (2014/11283); and VEGA project: Laser surface texturing technology research for an optimizing of tribology conditions in the sheet metal form-ing processes (1/0669/15) and the authors would also like to thank for financial contribution from the STU Grand Scheme for Support of Young Researchers (project SURFTOOL 1386). The au -thors also express their sincere thanks to Dr. Ingrid Görögová for her assistance with surface rough -ness evaluation and dr. Martin Sahul and dr. Miro -slav Sahul for their assistance with SEM analysis.
REFERENCES
1. Mishra S. and Yadava V. Laser Beam MicroMa
-chining (LBMM) – A review. Optics & Laser Tech
-nology 73 (2015), 89 – 122.
2. Kong M. C. and Wang J. Surface Quality Analysis of Titanium and Nickel-based Alloys Using Pico
-second Laser. Procedia CIRP 13 ( 2014 ), 417 – 422.
3. Ciruana J., Arias G. and Ozel T. Neural Network Modeling and Particle Swarm Optimization (PSO) of Process Parameters in Pulsed Laser Microma
-chining of Hardened AISI H13 Steel. Materials and Manufacturing Processes, 24, no. 3 (2009), 358–368.
4. Campanelli S. L. et al. Experimental analysis of the laser milling process parameters. Journal of Materials Processing Technology, 191, no. 1–3, (2007), 220–223. 5. Semaltianos N. G. et al. Picosecond laser ablation
of nickel-based superalloy C263. Applied Physics A: Materials Science and Processing, 98, no. 2, (2010), 345–355.
6. Kaldos A. Laser machining in die making—a mod
-ern rapid tooling proces. Journal of Materials Pro
-cessing Technology, 155–156, 1815–1820.
7. Cicala E. et al. The application of the random balance method in laser machining of metals. Journal of Ma
-terials Processing Technology, 196, (1–3), 393–401. 8. Cheng J. Effects of laser operating parameters on
metals micromachining with ultrafast lasers. Ap
-plied Surface Science 256, no. 5 (2009), 1514–1520.
9. Tunna L. et al. Micromachining of copper using Nd :YAG laser radiation at 1064, 532, and 355 nm wavelengths. Optics & Laser Technology 33 (2001), 135 – 143.
10. Zhang W., Yao Y. L. and Chen K. Modelling and Analysis of UV Laser Micromachining of Copper. International Journal of Advanced Manufacturing Techology 18 (2001), 323 – 331.
11. Schielle J., Schneider L. and Loeschner U. Pro
-cess optimization in high-average-power ultrashort pulse laser microfabrication: how laser process parameters influence efficiency, throughput and quality. Applied Physics A – Materials Science & Processing, 120(3), 2015, 847 – 855.
12. Schielle J. et al. High-pulse repetition frequency ultra
-short pulse laser processing of copper. Journal of laser applications. 27(S2), 2015, S28007-1 – S28007-6.
13. Wang S. Y. et al. Micromachining of copper by femtosecond laser pulses. Applied Surface Science 265 (2013), 302 – 308.
14. Gattani V. et al. Laser Surface Texturing of Alumini
-um Silicon and Al-umini-um Bronze to Enhance Tribo
-logical Properties. International Journal of Engineer
-ing Research & Technology, 4(12), 2015, 619 – 624. 15. Maisterrena-Epstein, R. et al. Nanosecond laser
ablation of bulk Al, Bronze, and Cu: ablation rate saturation and laser-induced oxidation. Superficies y Vacío. 20(3), 2007, 1-5.
16. Ampco Metal, 2017. [online] Aviable at: <https://
www.ampcometal.com> [Accessed 1st June 2017]. 17. ISO 25178-2:2012 Geometrical product specifi
-cations (GPS) – Surface texture: Areal – Part 2: Terms, definitions and surface texture parameters. 18. ISO 25178-3:2012 Geometrical product specifica
-tions (GPS) – Surface texture: Areal – Part 3: Spec
-ification operators.
19. ISO 25178-601:2010 Geometrical product specifica
-tions (GPS) – Surface texture: Areal – Part 601: Nom
![Table 1. Physical and mechanical properties of the sample [16]](https://thumb-us.123doks.com/thumbv2/123dok_us/8806028.1774602/2.595.86.514.649.746/table-physical-mechanical-properties-sample.webp)