Int. J. Adv. Res. Sci. Technol. Volume 4, Issue 3, 2015, pp.367-373.
International Journal of Advanced Research in
Science and Technology
journal homepage: www.ijarst.com
ISSN 2319 – 1783 (Print)
ISSN 2320 – 1126 (Online)
Indoor Radon Concentration for Phosphate Rocks Samples Using CR-39 Detector.
Hesham A. Yousef1*, Gehad M. Saleh2, A. H. El-Farrash3 and A. Hamza3
1
Physics Department, Faculty of Science, Suez University, Suez, Egypt. 2
Nuclear Materials Authority, P.O. Box: 530 El-Maadi, Cairo, Egypt. 3
Physics Department, Faculty of Science, Mansoura University, Mansoura, Egypt.
*Corresponding Author’s E-mail: [email protected]
A R T I C L E I N F O A B S T R A C T
Article history:
Received Accepted Available online
11 Apr. 2015 30 Apr. 2015 05 Mar. 2015
Radon concentrations and exhalation rate were measured using Can Technique with CR-39plastic track detectors for phosphate rocks samples from Safaga and El-Hamrawayn areas in the Eastern Desert, Egypt. The values of radon concentrations ranged from 1362.21- 20045.30 Bqm-3, 764.84 -17828.48 Bqm-3 and the values of surface exhalation rate ranged from 1.22-18.07 Bqm-2h-1, 1.09-16.07 Bqm-2h-1 for Safaga and El-Hamrawayn, respectively. From the results we can conclude that the values of radon concentration in Safaga higher than El-Hamrawayn. The present study aimed to detect any harmful radiation that would affect the human and radioactivity background levels.
© 2015 International Journal of Advanced Research in Science and Technology (IJARST).
All rights reserved.
Keywords:
Radioactivity, Radon, phosphate, CR-39, Dose.
Introduction:
Radon is produced through α-decay of 226Ra in the
soil is the only gaseous decay in this series as a noble gas, part of the 222Rn emanates from the soil grains into the air and diffuse to the atmosphere. Radon is the most important natural radioactive factor harmfully the human population, because radon is radioactive gas comes from the natural decay of uranium deposits in soil, rocks and water (Swakon et al., 2005).
The largest phosphate rock deposits worldwide are located in one belt covering all North African countries and continue through Jordan and North West of Saudi Arabia (Ragheb and Khasawneh, 2010). The Egyptian phosphate is widely distributed in many locatities on the Red Sea, Nile Valley and Western Desert. Phosphate rock is the starting raw material for all phosphate products and its decay products tend to be elevated in phosphate deposits of sedimentary origin (Ashraf et al., 2001).
The use of phosphate fertilizers in the recent years leads to accumulation of 238U and 232Th in soil, which cause pollution soil, drainage water and transmitted to animals and eventually to man who consumes the meat or milk from those animals. Most of the heavy metals accumulate in the food chains of the ecosystem (El-Zakla et al., 2007). Fertilizers are used for reclaiming the land and improving the properties of crops like super phosphate which, most commonly used in Egypt. It is manufactured from the reaction between sulfuric
acid, phosphate rock and water (Ashraf et al., 2004; Rehman et al., 2006). Phosphate deposit of sedimentary origin contains higher concentration of 238U and its decay products than phosphate from volcanic or biological origin (Korkmaz et al., 2005). The investigated samples were collected from Safaga and El-Hamrawayn areas of the Eastern Desert along the Red Sea. The phosphate deposits of the Eastern Desert along the beach of Red Sea from Safaga to Quseir between latitude (25° 00' - 26° 47') and longitudes (33° 45' - 34° 25').
The present work is aiming to determine the radon concentrations and radon exhalation rate in the phosphate rocks samples from Safaga and El-Hamrawayn areas in the Eastern Desert along the beach of Red Sea. In order to detect any harmful radiation that would affect the human and radioactivity background level this, can be used as reference information to assess any changes in the radioactive background level in order to detect any harmful radiation that would affect the human and the environment.
Materials and Methods:
Int. J. Adv. Res. Sci. Technol. Volume 4, Issue 3, 2015, pp.367-373. 110°C for 3hr, minced, sieved by 1-mm mesh and
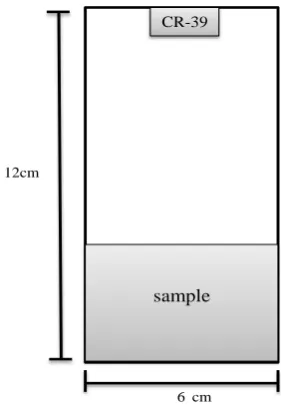
weighted. The samples were carefully sealed for thirty days in plastic cylindrical containers with dimensions of 6 cm in diameter and 12 cm in depth. Each sample container was capped tightly to an inverted cylindrical plastic cover as shown in figure 1.
A piece of CR-39 of 700 µm thickness (American Technical Plastic, Inc.) detector of area (1.5 x 1.5) cm2
fixed at the bottom center of the inverted plastic cover. After the irradiation period, the detectors were collected and chemically etched in NaOH solution 6.25N at 70°C
for 7 hr (Yip et al., 2003). After etching the CR-39 detectors were washed in distilled water and then dipped for few minutes in a 3 % acetic acid solution and washed again with distilled water and finally air dried.
The track density was determined by using optical microscope (Hafez et al., 2011) which calibrated before usages. The background of CR-39 track detector was counted by optical microscope and subtracted from the count of all detectors (Abo-Elmagd et al., 2006). The value of radon concentration in (Bqm-3) at secular equilibrium is given by the following equation:
Rn ρ
C =
ηT
(1)
Where, CRn is radon concentration (Bqm-3), ρ is the track density (track cm-2), T is the exposure time (day),
and η is the calibration coefficient of CR-39 nuclear track detectors obtained from the experimental calibration 0.22 tracks cm-2day-1/Bqm-3 of radon, respectively (Hafez et al., 2011). Radon exhalation rate is given by the relation:
CVλ EA=
1 -λT A[T + (e -1)]
λ
(2)
Where, EA is the surface exhalation rate in (Bqm-2h-1), C is the integrated radon exposure in (Bqm-3h), λ is the decay constant of radon (h-1),V is the effective volume of the cup (m3), A is the cross section area of the can
(m2) and T is the exposure time (Barooah et al., 2011).
CVλ
E =
M M[T +1(e-λT- 1)] λ
(3)
Where, EMis the mass exhalation rate in (Bqkg-1h-1) and
M is the mass of the sample (Barooah et al., 2011). The effective radium content of the sample can be calculated using the formula:
Ra ρhA
C =
ηT Me
(4)
Where, M is the mass of the sample in (kg), A is the area of cross section of the can in (m2), η h is the distance between the detector and top of the sample in
(m) (Mohamed, 2012). The annual absorbed dose rate −1
air, was calculated according to the following equation (UNSCEAR, 2000).
DRn (mSvy-1) = CRn . D. F . T . H (5)
Where, CRnis the measured mean radon concentration in air, F (0.4)is the indoor equilibrium factor. T is the indoor occupancy time (hr), H is the indoor occupancy factor (0.4) and D is the dose conversion factor (9 x10⁻⁶ mSv h-1/ Bqm-3) (UNSCEAR, 2000; Maged, 2006; Nsiah et al., 2011).
The working levels were calculated using the following equation:
C.F W L =
3700
(6)
Where, CRnis radon concentration in Bqm-3 and F is the equilibrium factor for radon has been taken as 0.4 (Mamta et al., 2011).
cm 12
cm 6 sample
CR-39
Fig: 1. Plastic cylindrical container
Results and Discussion:
The values of radon concentrations depend on many physical properties of the sample, like the chemical composition, porosity and bulk density of the samples. The values of radon concentration were measured, exhalation rate, radium concentration, annual absorbed dose rate and working level for the phosphate samples using CR-39 calculated as the following in table 1. The values of radon concentration ranged from 1362.21-20045.30 Bqm-3, surface exhalation rate ranged from 1.22-18.07 Bqm-2h-1, mass exhalation rate ranged from 21.06 - 294.40 mBqkg-1h-1, radium concentration ranged from 2.39-32.00 Bqkg-1,annual absorbed dose rate ranged from 17.10- 252 mSvy-1 and the working level ranged from 2167.70 - 147.26 mWL for Safaga area are listed in table 1.
Int. J. Adv. Res. Sci. Technol. Volume 4, Issue 3, 2015, pp.367-373. surface exhalation rate from 1.09-16.07 Bqm-2h-1, mass
exhalation rate from 27.14 -280 mBqkg-1h-1, radium concentration from 2.78-29.99 Bqkg-1, annual absorbed dose rate from 9.64-244 mSvy-1 and the working level from 82.26 to 1927.40 mWL. Figure 2, shows the comparison between the values of radon concentration for the studied areas. From the figure the average values of radon concentration in safaga higher than El-Hamrawayn and also the average surface exhalation rate in safaga higher than El-Hamrawayn as shown in figure 3. The comparison between the annual absorbed dose rate for safaga and El-Hamrawayn given by figure 4. The correlation coefficient between radon concentration and surface exhalation rate is R2 = 0.98 as shown figure 5, this is very good relation to evaluate the radon risk in atmosphere. Assessing relation
between radon an exhalation rate is necessary for the studied samples. Figure 6, shows the correlation relation between radium concentration and radon concentration for safaga area which, equal 0.92, this result shows a good linear relationship. Also the correlation relation between radon concentration and surface exhalation rate(R2 = 0.87) and the correlation relation between radium concentration and radon concentration(R2 = 0.90) as shown in figure 7 and figure 8 for El-Hamrawayn, respectively.
It seems that the Hamrawayn deposit has the lowest radioactivity level of exploited phosphate of sedimentary origin. The comparison between the obtained experimental results and the published data in different countries given by table 2.
Table: 1. Radon concentration (CRn), surface exhalation rate (EA), mass exhalation rate
(Em), radium concentration (CRa) annual absorbed dose rate (D) and working level
(WL) for the phosphate samples
mWL D(mSvy-1)
CRa (Bqkg-1)
Em (mBqkg-1h-1)
EA (Bqm-2h-1)
CRn(Bqm-3)
No. Areas
901.50 105.00
14.68 ± 0.07 135.00 ± 1.54
7.51 ± 0.08 8338.93 ± 95.62
1 S a fa ga 306.69 35.78
9.55 ± 0.03 94.88 ± 1.55
4.07 ± 0.06 2836.97 ± 46.20
2
233.56 32.99
7.07 ± 0.02 69.09 ± 1.35
3.10 ± 0.06 2160.49 ± 48,67
3
534.77 62.38
7.86 ± 0.05 72.30 ± 1.07
4.45 ± 0.6 4946.66 ± 73.57
4
2167.70 252.00
32.00 ± 0.10 294.40 ± 2.23
18.07 ± 0.13 20045.30 ± 152.08
5
495.21 57.78
14.15 ± 0.05 138.20 ± 1.07
6.57 ± 0.06 4580.75 ± 70.80
6
1301.65 151.02
20.80 ± 0.05 191.40 ± 3.50
10.85 ± 0.16 12040.30 ± 114.62
7
757.51 88.38
10.81 ± 0.08 99.50 ± 1.24
6.31 ± 0.07 7006.97 ± 87.56
8
2084.12 243.11
31.85 ± 0.10 232.00 ± 2.20
17.38 ± 0.13 19278.18 ± 145.23
9
147.26 17.10
2.35 ± 0.02 21.60 ± 0.61
1.22 ± 0.12 1362.21 ± 38.60
10
1368.69 159.01
20.70 ± 0.08 190.00 ± 1.77
11.41 ± 0.10 12660.41 ± 117.69
1 E l H a mr a w a y n 1904.20 222.03
20.86 ± 0.10 280.00 ± 2.20
15.89 ± 0.12 17613.94 ± 138.82
2
82.26 9.64
2.78 ± 0.01 27.14 ± 1.13
1.09 ± 0.04 764.84 ± 28.62
3
1051.80 122.72
16.14 ± 0.07 148.50 ± 1.57
8.77 ± 0.09 9729.21 ± 103.17
4
484.25 56.52
19.46 ± 0.04 188.20 ± 2.95
6.50 ± 0.10 4525.60 ± 70,36
5
1927.40 244.00
29.99 ± 0.10 275.80 ± 2.16
16.07 ± 0.12 17828.48 ± 139.66
6
117.46 13.71
3.69 ± 0.02 36.11 ± 1.14
1.56 ± 0.04 1086.51 ± 34.37
7
657.77 76.01
9.02 ± 0.05 83.00 ± 1.11
5.48 ± 0.07 6084.45 ± 81.59
8
1144.91 133.00
16.50 ± 0.07 152.30 ± 1.54
9.54 ± 0.09 10590 .43 ± 107.64
9
1573.23 183.50
27.51 ± 0.23 253.40 ± 2.19
7.51 ± 0.11 14552.00 ± 126.00
10
Table: 2.
The comparison between the obtained results and the published data in different
countries
References CRa
(Bqkg-1)
EA
(Bqm-2h-1)
CRn
(Bqm-3)
Country
(Saad, 2008) 0.02 - 4.12
8.90 - 1675.40 Egypt
(Maged et al., 1998) 0.05 - 2.35
10.00 - 1244.00 Egypt
(Jebur et al., 2014) 0.04 - 6.78
o.26 - 2.40 13.00 - 1197.00
Iraq
(Karim et al., 2011) 72.20 - 177.50
Iraq
(Fatimh, 2014) 0.12 - 0.57
17.00 - 77.00 Saudi
(Kadi et al., 2011) 4.27 - 33.93
0.04 - 0.35 Saudi
(Kant et al., 2006) 9.10 - 16.40
107.92 - 470.18 Iran
(Okeji et al., 2012) 36.60 - 117.00
Nigeria
The present work 2.39-32.00
1.22-18.07 1362.21-20045.30
Egypt:(Safaga)
Int. J. Adv. Res. Sci. Technol. Volume 4, Issue 3, 2015, pp.367-373.
0 2 4 6 8 10 12 14 16 18 20
1 2 3 4 5 6 7 8 9 10
E
A(B
q
m
-2
h
-1)
Samples number Fig: 3. The comparison between the surface exhalation rate of phosphate
samples for Safaga and EL Hamrawayn areas
Safaga EL Hamrawayn
0 50 100 150 200 250 300
1 2 3 4 5 6 7 8 9 10
D
(m
S
v
y
-1
)
Samples namber
Fig: 4. The comparison between the annual absorded dose of phsphate samples for Safaga and EL Hamrawayn areas
Safaga EL Hamrawayn 0
2000 4000 6000 8000 10000 12000 14000 16000 18000 20000
1 2 3 4 5 6 7 8 9 10
CRn
(B
q
m
-3)
Samples namber Fig: 2. The comparison between radon concentrations of phosphate
samples for Safaga and EL Hamrayan areas
Int. J. Adv. Res. Sci. Technol. Volume 4, Issue 3, 2015, pp.367-373.
R² = 0.9814
0 5000 10000 15000 20000 25000
0 5 10 15 20 25
EA
(B
qm
-2h -1)
C
Rn(Bqm
-3)
Fig: 5. The correlation between radon concentration(CRn) and
surface exhalation rate (EA) for samples in Safaga area
R² = 0.9254
0 5 10 15 20 25 30 35
0 5000 10000 15000 20000 25000
C
Rn(
B
q
m
-3
)
C
Ra(Bqkg
-1)
Fig: 6. The Correlation bet ween radon concentration(CRn) andRadium content(CRa) for the samples in Safaga area
R² = 0.8714
0 2 4 6 8 10 12 14 16 18
0 5000 10000 15000 20000
EA
(B
q
m
-2h -1)
CRn (Bqm-3)
Fig: 7. The correlation between radon concentration(CRn) and
Int. J. Adv. Res. Sci. Technol. Volume 4, Issue 3, 2015, pp.367-373.
R² = 0.9037
0 5000 10000 15000 20000 25000
0 5 10 15 20 25 30 35
CRn
(Bq
m
-3)
CRa (Bqkg-1)
Fig: 8. The correlation between radon concentration (CRn) and radium
concentration (CRa) for the samples of El Hamrawayn area
Conclusion:
This work is important to detect any harmful radiation that would affect the human and radioactivity background level which, can be used as reference information to assess any changes in the radioactive background level. Regarding phosphate fertilizers, the problem of radioactivity is raised at two levels, at the storage level where fertilizers continue to exhale 222Rn in the surrounding atmosphere. The level of fertilizer use where radioactive elements are thought to get into plants and the passage of radionuclides in the food chain starts with phosphate fertilizer (IAEA, 2003).
The values of radon concentrations ranged from 1362.21-20045.30 Bqm-3, 764.84-17828.48 Bqm-3 for Safaga and El-Hamrawayn areas, respectively. The variations in the values of radon concentrations due to the difference in the chemical composition and the geological form of the samples. The values higher than
the range of action levels from 200 to 600 Bqm-3
recommended by (ICRP, 1994).
The average dose received by the workers of the
phosphate mine are 0.15 to 0.29 mSvy-1, which is far
below the permitted dose of 20 mSvy-1 recommended by
the (ICRP Publication 60, 1990). The maximum permissible safe radiation dose without harm to the
individual(1 mSvy-1), with continuous external
irradiation of the whole body.
We conclude that, the values of radon concentrations in the phosphate are higher than the worldwide limit and not safety for human. The exposure and dose rates exceeded public permissible values in the sedimentary phosphate rocks, so that we must use personal protective masks to protect ourselves from inhalation alpha particles and don’t live near the area under study to minimize the exposure time of radiation. So that we must repeat the measurements to detect the variation in the concentration of radioactive
References:
1. Ashraf E.M. Khater, R.H. Higgy and M. Pimpl, (2001). Radiological impacts of natural radioactivity in Abu-Tartor phosphate deposits, Egypt. Journal of Environmental Radioactivity, 55,255–267.
2. Ashraf, E. Khater, Hussein, M.A.,and MohamedI. Hussein, (2004). Occupational exposure of phosphate mine workers, airborne radioactivity measurements and dose assessment. J. Environ. Radioact.,75, 47-57. 3. Abo-Elmagd, M., Mansy, M., Eissa, H.M. and El-Fiki,
M. A. (2006). Major parameters affecting the calculation of equilibrium factor using SSNTDs measured track densities. Radiat. Meas., 41, 235-240. 4. Barooah D., Phukan S. and Baruah R., 2011. Study of
radon exhalation rates using LR-115 (II) nuclear track detectors in coal –mining area of the foothills of Mokokchung District, Nagaland. Indian Journal of Pure and Applied Physics, 49, 665-668.
5. El-Zakla T., Abdel-Ghany H .A. and Hassan A. M. (2007).Natural radioactivity of some local fertilizers.Rom. J. Phys. 52(5-7), 731-739.
6. Fatimh Alshahri, (2014). Measurement of 222radon concentration and exhalation rate from phosphate using SSBD Detector in Saudi Arabia. Arab J. Sci. Eng., 39, 5765-5770.
7. Hafez, A. F., El-Farrash, A. H., and Yousef, H. A., (2011).Determination of Radon Concentration in Some Environmental Samples using Cup Technique. Journal of Environmental Sciences, 40 (4), 535- 548.
8. ICRP, 1990. Recommendations of the International Commission on Radiological Protection, Radiation Protection, Elmsford, NY: Pergamon Press, Inc., Publication (60), 1990.
9. IAEA, 2003. Radiation Protection against Radon in Workplaces other than Mines. Safety Reports Series No. 33, IAEA, Vienna.
10. ICRP, 1994, Publication (65) Protection against Radon-222 at Home and work. Barking, Essex, U.K.: Elsevier Science, Ltd.; 1994.
11. Jebur J. H, Subber A. H, (2014). Natural radon .Exhalation rate from fertilizer used in Basra Governorate, Iraq. International J. phys. Res. (IJRRI), 4(6), 1-10.
12. Korkmaz Belliturk and Turgut Saglam A. (2005).research on the urea hydrolysis rate in the soil of Thrace region. J. Central European Agriculture, 6(2) 107-114.
Int. J. Adv. Res. Sci. Technol. Volume 4, Issue 3, 2015, pp.367-373. 14. Karim M. S., Abbas Mnower E. M. and Abass K. H.
(2011). Measurement of radon gas concentration in fertilizer samples by using nuclear track detector (CR-39). Journal of Kufa Physics, 3(2), 443-452.
15. Kadi M. N., (2012). Natural radioactivity and radon exhalation in phosphate fertilizer, Arabian Journal for science and Engineering, 37-15.
16. Maged, A. F. and Saad, E. A. (1998).Radon exhalation rate from some fertilizers, clay and potatoes in Egypt. Environ. Manag., Health, 9(3), 130-135.
17. Maged A. F., (2006). Radon concentrations in elementary schools in Kuwait. Health Phys, 90 (3) 258-262.
18. Mamta Gupta, Mahur A. K., Sonkawade and Verma K. D., (2011). Monitoring of indoor radon and its progeny in dwellings of Delhi using SSNTDs. Advances in Applied Science Research, 2(5), 421- 426.
19. Mohamed Abd-Elzaher.2012. An overview on studying 222Rn Exhalation rates using passive technique solid state nuclear track detectors. American Journal of Applied science, 9 (10), 1653- 1659.
20. Nsiah-Akoto I., Fletcher J .J., Oppon O. C., and Andam A. B., 2011. Indoor radon levels and the associated effective dose rate determination at dome in the greater Accra Region of Ghana. Research Journal of Environmental and Earth Sciences, Vol., 3(2) pp. 24-130.
21. Okeji M. C, and Agwu K. K., (2012).Assessment of indoor concentration in phosphate fertilizer warehouses in Nigeria. Radiation Physics and Chemistry, 81(3)253-255.
22. Rehman S., Imtiaz N., Faheem M. and Matiullah, (2006). Determination of 238U contents in ore samples using CR-39 based radon dosimeter disequilibrium case. Radiat. Meas.,41, 471- 476.
23. Ragheb, M., and Khasawneh, M. Uranium fuel as by product of phosphate fertilizer production. 1st International Conference of Renewable energy (INREC) 21-24 March, 2010.
24. Swakon J., Kozak K., Paszkowski M., Gradzinski R., Loskiewicz J., Mazur J., Janik M., Bogacz J., Horwacik T. and Olko P., (2005). Radon concentration in soil gas around local disjunctive tectonic zones in the Krakow area. J. Environ. Radioact. 78, 137-149.
25. Saad A. F, (2008). Radium activity and radon exhalation rate from phosphate ores using CR-39 online with on electronic radon analyzer Alpha GUARD. Radiat. Meas.,43, 463-466.
26. UNSCEAR, 2000. Sources and effects of ionizing radiation. Report to the General Assembly with scientific annexes. United Nations, New York, 2000. 27. Yip C.W.Y., Ho J.P.Y., Nikezic D., and Yu K.N.