Physico-Chemical Studies on Terbium Soaps in Solid State
R. K. Shukla1, Tej Bahadur Singh2 and Mithlesh Shukla1
1Department of Chemistry,
R.B.S. College, Agra, U. P., INDIA.
2Department of Chemistry,
Jaswant Singh Bhadauriya Institute of Technology, Mathura, U. P., INDIA. email: [email protected].
(Received on: November 13, 2016)
ABSTRACT
The physico-chemical characteristics of terbium soaps (Myristate and stearate) in solid state were investigated by I.R., X-ray diffraction and thermogravimetric analysis. The I.R. result revealed that the fatty acids exist in dimeric states through hydrogen bonding and terbium soaps possesses partial ionic character. The X-ray diffraction measurements were used to calculate the long spacing and results confirmed the double layer structure of iron soaps. The decomposition reaction was found kinetically of zero order and the energy of activation for the decomposition processes for myristate and stearate were found to be 7.65 to 38.18 K. cal. mol-1.
Keywords: Terbium Soaps, I.R., X-ray diffraction and TGA measurements.
INTRODUCTION
The study of metallic soaps is becoming increasingly important in industrial as well as in academic fields. Several workers1-8studied on nature and structures of these soaps are of
great importance for their use in industries and for explaining their characteristics under different conditions. The present work deals with the infrared, X-ray and thermal studies of terbium soaps in solid state and has been initiated with a view to obtain information in solid state and energy of activation for the decomposition reaction.
EXPERIMENTAL
distilled water and alcohol and recrystallized with a mixture of benzene and methanol and dried under reduced pressure.
The I.R. spectra of fatty acids and their corresponding terbium soaps were recorded with a NICOLET 5 DXFT instrument (U.S.A.) in the region of 4000–200 cm-1 using potassium
bromide disc technique. X-ray diffraction patterns were obtained with a RIGAKU (Geigerflese-RB-RU-200) X-ray diffractometer using Cu-Kα radiations filtered by a nickel foil over the range of diffraction angle 2θ = 30 to 800 where θ is Bragg’s Angle. The TGA
analysis of terbium soaps was carried out by 780 series – Stanton Rederoft (U.K.) in the static air medium at constant heating rate of 100C per minute and maintaining similar condition
throughout the investigation.
RESULT AND DISCUSSION
Infrared spectra
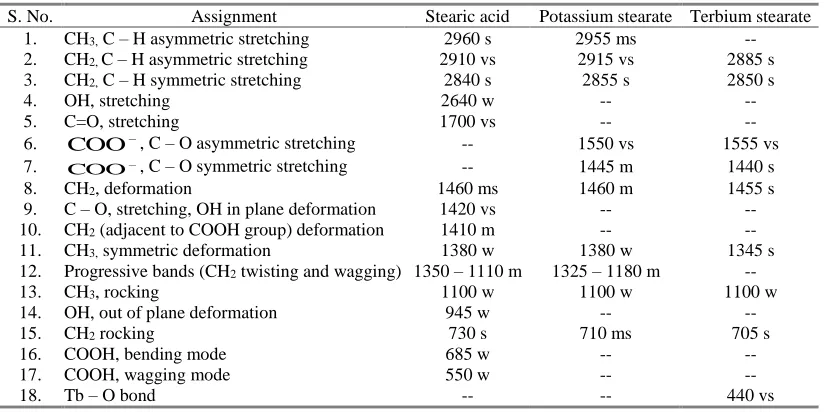
The wave number of some important absorption band in infrared absorption spectra of terbium soaps (myristate and stearate) were assigned and compared with those of corresponding fatty acid as mention in Table – 1. The absorption maxima of aliphatic portion of both fatty acids remain unchanged on the formation of potassium and iron soaps. The absorption bond observed near 2640, 1700, 1370, 1410, 940, 690 cm-1 in myristic acid and
2650, 1700, 1410 – 1430, 940, 680 cm-1 in stearic acid are associated with the localized
carboxyl group of acid molecule in dimeric state and which confirm the existence of intermolecular hydrogen bonding. The absorption maxima near 1700, 1410, 690, 550 cm-1 in
myristic acid and 1700, 1430, 680, 550 cm-1 in stearic acid are characteristic frequencies of
carboxyl group were not observed in the spectra of potassium and terbium soaps. The complete disappearance of the carboxyl frequency near 1700 cm-1 in the spectra of terbium soaps
indicates that there is a complete resonance between two C = O bonds of carboxylic group of the soap molecule and the two bonds become identical with their force constants assuming an intermediate value between those of normal double and single bonds. The appearance of two absorption bonds corresponding to symmetric and antisymmetric stretching vibrations of carboxylate iron near 1430 – 1445 cm-1 and 1560 – 1550 cm-1 respectively in the spectra of
iron soaps instead of one band of carboxyl frequency near 1700 cm-1 confirms the ionic nature
of these soaps. The bond observed near 440 and 460 cm-1 in the spectra of iron soaps correspond
two Fe O bond. The IR spectra of terbium soaps do not show any absorption maxima in the region of 3500 – 3300 cm-1, which confirms absence of water of crystallization in these soaps.
The result shows that the fatty acids exist with dimeric structure through hydrogen bonding between carboxyl group of two acid molecules where as terbium soaps ionic in nature and the metal to oxygen bond in these soaps have ionic characters. The assigned frequencies are in agreement with the result of other workers9 – 11.
X-ray diffraction analysis
The intensities of the various diffracted X-ray as a function of diffraction angle, 2θ for iron soaps were observed and the inter planner spacing, d have been calculated from the positions of the intense peaks using Bragg’s relationship nλ=2dsinθ where, λ is wave length of radiation. The calculated spacing together with the relative intensities with respect to the most intense peak is recorded in table 2. The appearance of the diffraction up to 14th and 38th
order in diffraction patterns of terbium myristate and stearate respectively, confirms good crystallinity for these soaps. The average planner distance i.e. long spacing for terbium myristate and stearate are 39 – 25 A0 and 47.05 A0 and the difference is 7.8 A0 corresponds to
double length of methylene (-CH2) in the fatty acid radical constituents of the soap molecules.
The values of long spacing for these soaps are approximately equal to the double of the length of the fatty acid radical of the soap molecules. It is therefore suggested that the zig-zag chain of fatty acid radicals extended straight forward in their soap molecules. The observed values the long spacing, however are smaller than the calculated dimensions of these anions from Pauling’s values of atomic radii and bond angles and this suggested that the molecular axes of these soap molecules are somewhat inclined to the basal planes. The metal ion Tb+++
fit into spaces between the oxygen atoms of the ionized carboxyl group without a large strain of bond. Much diffraction in the intermediate range are also observed in the diffraction pattern of terbium soaps and are attributed to the diffraction of X-rays by planes of atom of much smaller separation than the basal plane. The calculated spacing from these peaks corresponds to the shorter side spacing i.e. the lateral distance between one soap molecule and the next in a larger. It is observed that the long spacing peak are fairly intense right the short spacing peaks are relatively weak on the basis of long and short spacing. It is proposed that metal ions in terbium soaps are arranged in a parallel plane i.e. a basal plane equally spaced in the sap crystal with fully extended zig-zag chains of fatty acid radicals. On the both sides of each basal planes and terbium soaps have double layer structure as proposed by Vold and Hattiangdi12. Thermogravimetric Analysis
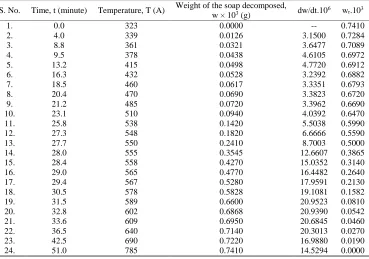
The results of thermogravimetric analysis of terbium soaps (myristate and stearate) are given in table 3.1-3.2 and it is observed that the final residue in metal oxide and the weight of residue are in agreement with theoretically calculated weight of terbium oxide from the molecular formula of the soap. A white substance deposited at the cold part of the sample tube surrounding the sample and it is identified as myristone and stearone in the case of myristate and stearate respectively.
The thermal decomposition of terbium myristate and stearate : 2(RCOO)3Tb 3 RCOR + Tb2O3 + 3CO2
Where, R is –C13H27 and C17H35 for myristate and stearate respectively.
Thermal decomposition results of terbium soaps have been explained in terms of Freeman-Carrol13.
Freeman and Carroll is rate expression for thermal decomposition may be expressed as:
log
r
where, E = Energy of activation, R = Gas constant
η = Order of decomposition reaction, T = Temperature
ωr = difference between the total loss and loss in weight at time at time t, i.e. ω0 – ωt
and dω/dt = value of rate of weight loss obtained from the loss in weight Vs time curves at appropriate times.
Table 1: IR Absorption Frequencies (cm-1) Together with their assignments
S. No. Assignment Myristic acid Potassium myristate Terbium myristate
1. CH3, C – H asymmetric stretching 2960 vw -- 2950 vw
2. CH2, C – H asymmetric stretching 2910 vs 2910 vs 2910 vs
3. CH2, C – H symmetric stretching 2850 s 2840 vs 2840 s
4. OH, stretching 2645 vw -- --
5. C=O, stretching 1700 vs -- --
6. COO, C – O asymmetric stretching -- 1540 vs 1560 s
7. CH2, deformation 1460 ms 1460 ms 1450 s
8. C – O, stretching, OH in plane deformation 1435 ms 1440 ms 1435 ms 9. COO, C – O symmetrical stretching -- 1415 ms 1350 s 10. Progressive bands (CH2 twisting and
wagging) 1340 – 1180 w 1340 – 1185 w 1305 – 1180 w
11. CH3, rocking 1110 – 1060 w 1110 – 1120 w 1100 – 1160 w
12. OH, out of plane deformation 940 -- --
13. COO deformation -- 930 m 935 m
14. CH2 rocking 750 – 720 ms 750 – 720 ms 720 s
15. COOH, bending mode 690 ms -- --
16. COOH, wagging mode 550 ms -- --
17. Tb – O bond -- -- 430 vs
Table 2: IR Absorption Frequencies (cm-1) Together with their assignments
S. No. Assignment Stearic acid Potassium stearate Terbium stearate 1. CH3, C – H asymmetric stretching 2960 s 2955 ms --
2. CH2, C – H asymmetric stretching 2910 vs 2915 vs 2885 s
3. CH2, C – H symmetric stretching 2840 s 2855 s 2850 s
4. OH, stretching 2640 w -- --
5. C=O, stretching 1700 vs -- --
6. COO, C – O asymmetric stretching -- 1550 vs 1555 vs
7.
COO , C – O symmetric stretching -- 1445 m 1440 s
8. CH2, deformation 1460 ms 1460 m 1455 s
9. C – O, stretching, OH in plane deformation 1420 vs -- -- 10. CH2 (adjacent to COOH group) deformation 1410 m -- --
11. CH3, symmetric deformation 1380 w 1380 w 1345 s
12. Progressive bands (CH2 twisting and wagging) 1350 – 1110 m 1325 – 1180 m --
13. CH3, rocking 1100 w 1100 w 1100 w
14. OH, out of plane deformation 945 w -- --
15. CH2 rocking 730 s 710 ms 705 s
16. COOH, bending mode 685 w -- --
17. COOH, wagging mode 550 w -- --
Table – 3.1: Thermogravimetric Analysis of Terbium Myristate
S. No. Time, t (minute) Temperature, T (A) Weight of the soap decomposed, w × 103
(g) dw/dt.10
6 w
r.103
1. 4.0 323 0.0000 -- 0.5221 2. 6.6 360 0.0134 2.0303 0.5087 3. 9.3 410 0.0220 2.3656 0.5001 4. 12.0 450 0.0344 2.8666 0.4877 5. 14.5 490 0.0454 3.1310 0.4767 6. 17.3 550 0.1478 8.5434 0.3743 7. 20.0 570 0.2840 14.2000 0.2381 8. 22.8 610 0.3550 15.5701 0.1671 9. 25.8 650 0.4558 17.6666 0.0663 10. 28.0 690 0.4730 16.8923 0.0491 11. 30.6 730 0.4795 15.6700 0.0426 12. 33.8 770 0.4920 14.5562 0.0301 13. 36.6 810 0.5050 14.3442 0.0171 14. 38.6 850 0.5058 13.1036 0.0141 15. 41.3 890 0.5090 12.3244 0.0131 16. 44.0 930 0.5120 11.6364 0.0101 17. 46.6 970 0.5175 11.1052 0.0046 18. 49.3 1010 0.5180 10.5071 0.0041 19. 52.8 1050 0.5190 9.8295 0.0031 20. 54.6 1090 0.5200 9.5238 0.0021 21. 57.5 1130 0.5221 9.0800 .00000
Table – 3.2 : Thermogravimetric Analysis of Terbium Stearate
S. No. Time, t (minute) Temperature, T (A) Weight of the soap decomposed,
w × 103 (g) dw/dt.10 6
wr.103
Fig.1 Infrared adsorption spectrum of terbium myristate
10 20 30 40 50 60 70 80
10 20 30 40 50 60 70
10 20 30 40 50 60 70 80 90 100 120 10 20 30 40 50 60 70 80 90 100
W
ei
gh
t L
os
s,
W
×
1
0
5
Time, t
¤
•
Tb StearateTb M yristate ¤ • ¤ • ¤ • ¤ • ¤ • ¤ • ¤ • ¤ • ¤ • ¤ • ¤ • ¤ • ¤ • ¤ • ¤ • ¤ • ¤ • ¤ • ¤ • ¤ • • •
Fig.3 Thermogram of terbium myristate and stearate
REFERENCES
1. T.D. Haworth and F.M. Raab, J. Coll. Inter. Sci. 134 (2), 580 (1990). 2. R.G. Bossert, J. Chem. Educ., 27, 10 (1950).
3. L.M. Stumpf, J. Am. Paint, 38, 60 (1953).
4. K.N. Mehrotra, M. Chauhan and R.K. Shukla, Tenside Surf. Det. 34 , 2124 (1997). 5. K.N. Mehrotra, P. Rajwanshi, S. Mishra and M.K. Rawat, J. Indian Chem. Soc. 74, 399
6. T. Sugimura, Nippon Kagaku Kaishi Japan, 4, 654 (1980). 7. N. Pilpel, Ind. Chemist, 39, 134 (1963).
8. J. Chacko and G.J. Parmeswaran, Thermo Anal, 29, 3 (1984). 9. C. Duval, J. Lacamte and F. Douville, Ann. Phy., 17, 5 (1942). 10. R.E. Kagarise., J. Phys. Chem. 59 : 271 (1955).
11. Y. Koga and R. Matsuura, Mem. Fac. Sci. Kyushu Uni. Ser., C 4 (1), 62 (1961). 12. R.D. Vold and G.S. Hattiangdi, Ind. Eng. Chem., 41, 2311 (1949).