INTRODUCTION
Compressor blades are used as critical ele‑ ments of the aircraft engine. This naming is con‑ nected to geometry, work conditions, and poten‑ tial failures [5]. The blades from the first stage of the compressor are thin in comparison to the rest of the geometrical parameters [4]. This feature makes the blade susceptible to resonant bend‑ ing. In the case of the existing mechanical vibra‑ tions, resonance may occur. The worst scenario is when on a notch or crack is observed on the lead‑ ing edge [14]. The notch may occur when a hard object (like stone i.e.) is sucked into the engine and hits the blade. On the other hand, the forces caused by airflow and centrifugal forces connect‑ ed to high rotational velocity act on the blade. Ad‑ ditionally, because of the weight of the aircraft, the blade is usually made of special high‑strength alloys with lower density and is exposed to spe‑ cial treatment. This treatment, such as shot peen‑ ing or layering, may increase the local strength
and resistance to the fatigue crack initiation. In the aviation technology, laminates and composite materials also appear increasingly often [8, 12]. However, due to the fact that plastic deformation and cyclic strengthening are not observed in com‑ posite materials, the fatigue equations presented in this paper should not be used in the analysis of the components made with composite techniques.
The failures and fatigue fractures connected to low cycle fatigue (LCF) are extremely dan‑ gerous. Every engine has its own special plan of inspection to prevent any failures. In the case of resonance and notch, in order to high deforma‑ tion and strains made by bending, theoretically a situation when notch will be formed and crack will start to propagate between two next inspec‑ tions may happen. Low Cycle Fatigue is directly connected to high values of strains (elastic and plastic strain) [11]. In the literature, connecting the LCF [2, 15] with a Strain‑Life numerical analysis is popular. In analytical and numerical
Evaluation of Material Data to the Numerical Strain‑Life Analysis
of the Compressor Blade Subjected to Resonance Vibrations
Arkadiusz Bednarz
11 Rzeszow University of Technology, Al. Powstancow Warszawy 8, 35‑959 Rzeszow, Poland
e‑mail: [email protected]
ABSTRACT
This paper presents the impact of selecting the fatigue material model on the numerically determined fatigue life
of a compressor blade. In the work, the first stage compressor blade of the PZL‑10W turbine engine was used.
The research object contained a geometric notch with a known location and shape. In numerical studies, 8 fatigue
estimation methods were used in the ε ‑N analysis (based on the Manson‑Coffin‑Basquin model). At the same time,
three methods for estimating material constants associated with the cyclic hardening were employed. On the basis of the selected models, 24 sets of fatigue parameters were obtained, which were used in numerical studies. The numerical tests were carried out under resonant conditions with amplitudes of 1.5 and 1.8 mm. The numerical tests
were confirmed by the experimental fatigue tests. As a result of the above‑mentioned tests, the impact of selecting
the material fatigue model and hardening model on the obtained results was determined and they were referred to
the initiation of the crack with the length a = 0.2 mm (achieved during experimental studies). The obtained results
will constitute the basis for further fatigue tests.
Keywords: fatigue life, crack initiation, vibrations, strain‑life, compressor blade, strain hardening Volume 14, Issue 1, March 2020, pages 184–190
https://doi.org/10.12913/22998624/117115
Research Journal
Accepted: 2020.02.05The main purpose of this work was to de‑ termine the relationship between the material fatigue model and a number of load cycles until crack initiation in the case of the blade with the notch. Numerical estimations of the fatigue life were compared with the experimental results. The conducted considerations can serve as a hint as to which material model to use for an element with complex geometry and a complex state of the load. The obtained results have both a theoretical and practical value.
STRAIN‑LIFE MATERIAL DATA
As mentioned, the Low Cycle Fatigue is de‑ termined by Strain‑Life (ε‑N) analysis. In order to conduct the ε ‑N analysis which is based on the Manson‑Coffin‑Basquin (MCB) equation (eq. 1), it is necessary to estimate the material data. The MCB equation is based on the relation between strain amplitude and two fatigue components. To‑ tal strain amplitude ∆𝜀𝜀2 is obtained from an arith‑ metic average of the elastic and plastic strain
∆𝜀𝜀 2 =
𝜀𝜀𝑒𝑒+ 𝜀𝜀𝑝𝑝
2 =
𝜎𝜎𝑓𝑓′
𝐸𝐸 (2𝑁𝑁)𝑏𝑏+ 𝜀𝜀𝑓𝑓′(2𝑁𝑁)𝑐𝑐 (1)
where: ∆𝜀𝜀2 – total strain amplitude
pressor from the PZL‑10W turbine engine is made of the EI‑961 chromium alloy (GOST: 13H12N2V2MF). Eight different material fatigue models were used in the presented work: Manson, 4‑point Manson, Mitchell, Muralidharan‑Man‑ son, Baumel‑Seeger, Ong, Roessle‑Fatemi and Median. The equations used to estimate the mate‑ rial data for each model were taken from litera‑ ture. Each model is based on the tensile properties of the alloy or a fixed value. The estimated values of this material data were presented in Table 1.
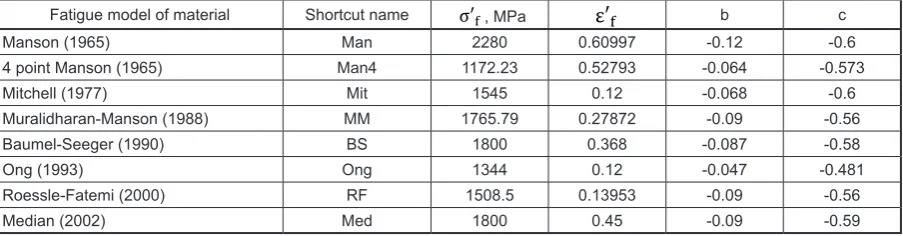
The material data for the MCB fatigue models (from Table 1) allow creating an MCB curve for every material model of the EI‑961 alloy. These curves were shown in Figure 1.
The highest value of 𝜎𝜎𝑓𝑓′ is observed for the
Manson model (2280 MPa), while the lowest for the Ong model. In the case of 𝜀𝜀𝑓𝑓′, the highest
value is also observed for Manson model, while the lowest value for the Mitchell and Roessle‑Fa‑ temi models (0.12). In the case of the fatigue strength exponent, the highest value is observed for the Manson model. In this model, the value of “b” is assumed in advance (not calculated). The lowest “b” value was obtained for the Ong model. In the case of fatigue ductility exponent, the highest value is observed for the Manson and Mitchell model, and the lowest value for the Ong model. The fatigue strength exponent and fatigue
Table 1. Fatigue models of material
Fatigue model of material Shortcut name σ′f, MPa ε′f b c
Manson (1965) Man 2280 0.60997 ‑0.12 ‑0.6
4 point Manson (1965) Man4 1172.23 0.52793 ‑0.064 ‑0.573
Mitchell (1977) Mit 1545 0.12 ‑0.068 ‑0.6
Muralidharan‑Manson (1988) MM 1765.79 0.27872 ‑0.09 ‑0.56
Baumel‑Seeger (1990) BS 1800 0.368 ‑0.087 ‑0.58
Ong (1993) Ong 1344 0.12 ‑0.047 ‑0.481
Roessle‑Fatemi (2000) RF 1508.5 0.13953 ‑0.09 ‑0.56
ductility exponent value define the rate of defor‑ mation change (tangent of the curve slope) on the Manson‑Coffin‑Basquin chart.
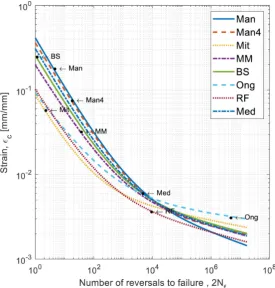
Due to the fact that steels (and alloys) exhibit the phenomenon of strain hardening due to load‑ ing, the material model proposed by Ramberg‑Os‑ good (RO) – eq. 2, developed for the curve of cy‑ clic hardening (σ – εα) is used for the calculation of strain based on stress:
∆𝜀𝜀 =∆𝜎𝜎𝐸𝐸 + 2(2𝐾𝐾′)∆𝜎𝜎 1/𝑛𝑛′ (2)
where: K′ – cyclic strength coefficient, MPa
n′ – cyclic strain hardening exponent In this paper, three different models of cyclic hardening were used. The most common is Man‑ son hardening (for Ramberg‑Osgood equation). It assumes that the cyclic strain hardening exponent is constant for every material model. Other hard‑ ening models like Fatemi and Xianxin are more complex. The cyclic hardening coefficient and exponent for different fatigue material models (of MCB) were shown in Table 2.
On the basis of the data above (Table 3), the diagram in Figure 2 was drawn. The clos‑ est to the tensile test curve is the curve deter‑ mined based on the Fatemi model. The other
two curves, in the observed deformation range from 0 to 0.05 mm/mm, are characterized by a large divergence. At the same time, observing the trends of changes taking place in Figure 2, it can be assumed that for the deformations above 0.04 mm/mm, the Manson model will be closer to the tensile curve. The Xianxin model in the whole range is far from the tensile curve.
NUMERICAL FATIGUE ANALYSIS
Basic assumptions of the analysis
The fatigue constants determined and pre‑ sented in the second chapter, as well as the quan‑ tities defining cyclic hardening, were used to cre‑ ate the paddle fatigue numerical analysis during resonance vibrations. This analysis has several stages. In the first stage, the resonance state (with a given amplitude) and the corresponding stress and strain values were achieved. Then, for dy‑ namic results, the fatigue analyses were carried out. The same geometrical model of the blade was used in all numerical analyses. This model is a blade of the first stage of the PZL‑10W turbine helicopter engine. The material model built on Young modulus (linear elastic model) was used in
the numerical analysis. The use of such a model has simplified and shortened the time of analysis. The numerical analyses performed based on the finite element method were conducted using com‑ mercial ANSYS software [1].
Analysis preparation and numerical simulations
The geometric model of a notched blade was digitized using tetrahedral elements (with square shape functions). In addition, a discrete mesh was compacted around the notch bottom to in‑ crease the resolution of the results obtained and to achieve greater accuracy. The element size was selected by iterative reduction of the element size until the difference in equivalent stress was obtained on the assumed level (difference below 0.1 MPa).
The geometric model of the blade con‑ tained a geometric notch, located on the leading edge, 3 mm from the blade foot. This notch was V‑shaped and 0.5 mm deep. The rounding radi‑ us at the bottom of the notch was 0.05 mm. The notch dimensions were chosen so that they cor‑ respond to the notch dimensions from the experi‑ mental studies.
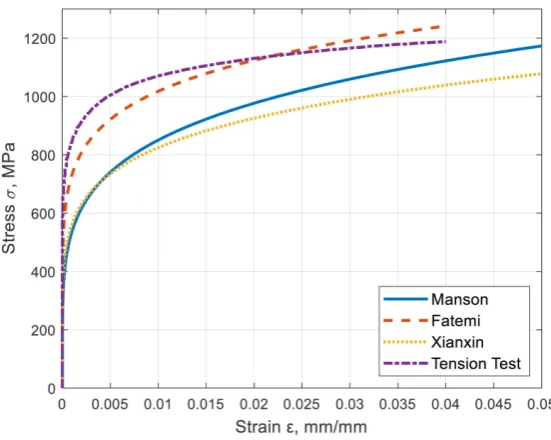
As a result of the numerical modal analy‑ sis, the distribution of the equivalent stress σeqv (Figure 3) and the principal stress σ1 was deter‑ mined for two values of the amplitude of reso‑ nance vibrations – A = 1.5 mm and A = 1.8 mm. The identical location of the maximum stress value was observed in both amplitude variants. The largest value of the equivalent stress was ob‑ served at the bottom of the notch, at a distance of about 0.2 mm from the inner side of the blade. The first mode of resonance vibrations is a bend‑ ing form and occurs at a frequency of 789 Hz.
In the case of resonance vibration with an amplitude of A = 1.8 mm, the maximum value of equivalent stress (determined by the Huber‑Mis‑ es‑Hencky hypothesis) was σeqv = 987 MPa (Figure 4a). The maximum value of the principal stress was σ1 = 1171 MPa (Figure 4b). In the case of resonance with an amplitude of A = 1.5 mm, the stress values were: σeqv = 822 MPa and σ1 = 976 MPa, respectively.
RESULTS OF NUMERICAL FATIGUE
ANALYSIS
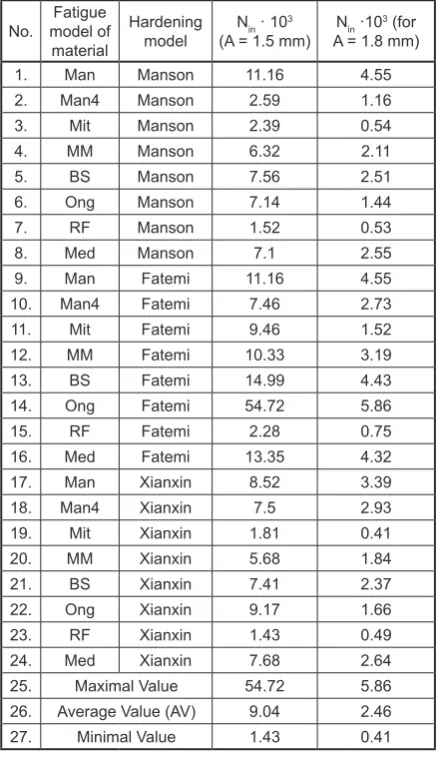
The obtained values of the principal stress‑ es were used to conduct the numerical fatigue analysis. The obtained material models (eight models – Table 1) and hardening models (3
models – Table 2) created 24 data configurations for ε‑N numerical fatigue analysis. The results of the discussed analyses are presented in Table 3. Additionally, three values were determined, i.e. the maximum, average and minimum value of the number of cycles for the crack initiation.
Firstly, the results of numerical fatigue analy‑ sis of a compressor blade working under the con‑ ditions of resonance vibrations with an amplitude of 1.5 mm were discussed. The highest number of load cycles for crack initiation is observed when using the Ong model with Fatemi hardening and was Nin = 54.72·103. The lowest number of load
cycles for crack initiation was Nin = 1.43·103
and is observed for the Roessle‑Fatemi model Xianxin hardening. The average value in the case of resonance with a vibration amplitude of the tip of the blade A = 1.5 mm, is equal to 9.04·103. The
Fig. 4. Distribution of the equivalent stress σeqv (a) and the principal stress σ1 (b) near the notch, for the analyzed
blade with the resonance amplitude of A = 1.8 mm.
Fig. 3. Distribution of the equivalent stress on both the internal (a) and external (b) surfaces
11. Mit Fatemi 9.46 1.52
12. MM Fatemi 10.33 3.19
13. BS Fatemi 14.99 4.43
14. Ong Fatemi 54.72 5.86
15. RF Fatemi 2.28 0.75
16. Med Fatemi 13.35 4.32
17. Man Xianxin 8.52 3.39
18. Man4 Xianxin 7.5 2.93
19. Mit Xianxin 1.81 0.41
20. MM Xianxin 5.68 1.84
21. BS Xianxin 7.41 2.37
22. Ong Xianxin 9.17 1.66
23. RF Xianxin 1.43 0.49
24. Med Xianxin 7.68 2.64
25. Maximal Value 54.72 5.86
26. Average Value (AV) 9.04 2.46
27. Minimal Value 1.43 0.41
Table 4. Results of experimentalfatigueanalysis No. Amplitude A, mm Nin · 103
1. 1.5 190.3
2. 1.8 12.9
increase in the vibration amplitude to the value of A = 1.8 mm caused that the average value of the number of load cycles for crack initiation de‑ creased to the value of Nin = 2.46·103 (nearly a
4‑fold fall). The highest Nin value also occurred for the Ong model with Fatemi hardening, while the lowest occurred using Mitchell model with Xianxin hardening. From the results obtained, it can be concluded that the maximum value of the number of cycles until crack initiation, with an increase in amplitude from 1.5 mm to 1.8 mm, caused a nearly 10‑fold decrease.
RESULTS OF EXPERIMENTAL
INVESTIGATION
The experimental part of the work, related to the initiation of the crack, was carried out us‑ ing the Unholtz‑Dickie UDCO‑TA‑250 vibrating system in the Turbomachinery Laboratory of the Rzeszow University of Technology. The blades
blade foot (depth of the notch was equal to 0.5 mm and radius in the bottom equal to 0.05 mm). The intensity of exertion, during tests, was 10 g (1 g equals gravitational acceleration, 9.81 m/s2). The amplitude of displacements of the tip of the blade was equal to 1.5 or 1.8 mm (depending on the case of study). During the experimental research, only the first form of resonant vibrations was ana‑ lyzed. The flexural vibrations cause the bending of the feather of the blade, resulting in fatigue of the blade material. After the specified number of cycles, the initiation of the crack was observed at the bottom of the notch.
The results of the experiment are summarized in Table 4. This table contains the information on the number of cycles necessary to initiate the crack. The determined number of cycles for crack ini‑ tiation corresponds to the minimum fatigue crack length. The crack was detected when the minimum crack length of 0.2 mm was reached. The initiation of the fracture was observed using a microscope and a fluorescent fluid. The blade was put into reso‑ nance and several thousand load cycles were ap‑ plied. The test was then stopped and the blade was checked for cracking. If the crack was not initiated, another series of load cycles was applied. This pro‑ cedure was repeated until a crack was detected.
For the amplitude of resonance vibrations equal to A = 1.5 mm, the number of cycles to initiate a crack with a length of about 0.2 mm was over Nin = 190·103. For a 20% higher am‑
plitude (A = 1.8 mm), the number of cycles for crack initiation was Nin = 12.9·103. An increase
CONCLUSIONS
The numerical fatigue analysis showed a large discrepancy in the results of the number of load cycles for fatigue crack initiation for a given load variant. The scatter in the results is observed: the smallest value is nearly 40 times lower than the largest one (for resonance amplitude A = 1.5 mm). In addition, numerical and experimental studies showed a high qualitative similarity of the impact of the increase in the resonance vibration ampli‑ tude on the values of the obtained numbers of load cycles for the initiation of a fatigue crack. In the examined cases of the notched blades, an increase in amplitude by 20% (from 1.5 mm to 1.8 mm) causes a 4‑fold decrease in fatigue life, as indicated in the numerical tests. The analysis of the results of experimental studies showed that the discussed increase in the vibration amplitude caused a nearly 15‑fold decrease in fatigue life. It is worth mention‑ ing that the results of numerical fatigue analysis based on the Ong model (with Fatemi hardening) show that the increase in the vibration amplitude resulted in a nearly 10‑fold decrease in fatigue life. At the same time, in the case of the results of the mentioned numerical fatigue analyses based on the Ong model, the number of load cycles for the ini‑ tiation of fatigue crack are only 2–3 times smaller than the results of experimental tests.
It should be mentioned that one of the reasons for the differences in results may be inaccuracy (and inability to measure) in certain quantities characterizing the material. In addition, a high resonance frequency value increases the fatigue strength. The moment of fatigue crack detection also influences the results of experimental tests. For the presented experimental tests, the mini‑ mum length of fatigue crack was a = 0.2 mm.
On the basis of the results obtained in this paper, the use of the Fatemi hardening model as well as the Ong or Baumel‑Seeger fatigue model is recommended in the case of the numerical fa‑ tigue analysis of the compressor blade. The use of other fatigue and hardening models may result in a large error in the estimated fatigue life values. These models are useful for the fatigue analysis of aircraft engine compressor blades.
Acknowledgment
The research leading to these results was co‑financed from funds for the statutory ac‑ tivity of Department of Aircrafts and Aircraft
Engines, Rzeszow University of Technology (DS.ML.19.001) and also the Fulbright Program (sponsored by U.S. Department of State).
REFERENCES
1. Browell R. and Hancq A. Calculating and Display‑
ing Fatigue Results. ANSYS Inc., 2006.
2. Chengzong L., Zhiyong Z., Xin C. and Yuanxiao
S. Low‑Cycle Fatigue Analysis and Experiment of Steel Specimens with Stress Concentration. Journal
of Applicatied Mechanics, 17(3), 2000, 107–110. 3. Dowling N.E. Mean Stress Effects in Stress‑Life and
Strain‑Life Fatigue. Blackburg: Virginia Polytech‑
nic Institute and State University, F2004/51, 2004.
4. Hunecke K. Jet Engine: Fundamentals of theory, de‑
sign and operation. Airlife Publishing, England, 2014.
5. Jakubowski R. Evaluation of performance proper‑ ties of two combustor turbofan engine; Eksploatacja
i Niezawodność 17(4), 2015, 575–581.
6. Lichoń D. and Bednarz A. The study on algorithm for identification the fatigue crack length of compressor
blade based on amplitude‑frequency resonant charac‑
teristics. Journal of Kones 24, 2017, 156–164. 7. Meggiolaro M.A. and Castro J.T.P. Statistical evalua‑
tion of strain‑life fatigue crack initiation predictions.
International Journal of Fatigue, 26, 2004, 463–476.
8. Mazurek P. Fatigue Strength of Thin‑Walled Rect‑
angular Elements in the State of Post‑Critical De‑ formation. Advances in Science and Technology
Research Journal,13(2), 2019, 84–91.
9. Mihaliková M., Lišková A., Vojtko M. and Kvačkaj T. Research of fatigue and mechanical properties AlMg‑ 1SiCu aluminium alloys. Advances in Science and
Technology Research Journal, 9(28), 2015, 56–60. 10. Nakhodchi S. and Salimpour M.E. Fatigue life predic‑
tion in damaged and un‑damaged compressor blades.
Engineering Solid Mechanics, 2, 2013, 43–50.
11. Neimitz A., Galkiewicz J., Lipiec S. and Dzioba I.
Estimation of the Onset of Crack Growth in Ductile
Materials. Materials 10, 2018.
12. Puchała K., Szymczyk E., and Jachimowicz J. Modelowanie laminatów w praktyce inżynierskie. Przegląd Mechaniczny 3, 2019, 29–34.
13. Stephens R.I., Fatemi A., Stephens R.R. and Fuchs
H.O. Metal Fatigue in Engineering. John Wiley& Sons, Ottawa, Canada, 2000.
14. Witek L. Numerical stress and crack initiation anal‑ ysis of the compressor blades after foreign object damage subjected to high‑cycle fatigue. Engineer‑
ing Failure Analysis, 18, 2011, 2111–2125.
15. Witek L., Bednarz A. and Stachowicz F. Fatigue
analysis of compressor blade with preliminary defect.