w w w . i a j p s . c o m
Page 435
CODEN (USA): IAJPBB ISSN: 2349-7750
I
I
N
N
D
D
O
O
A
A
M
M
E
E
R
R
I
I
C
C
A
A
N
N
J
J
O
O
U
U
R
R
N
N
A
A
L
L
O
O
F
F
P
P
H
H
A
A
R
R
M
M
A
A
C
C
E
E
U
U
T
T
I
I
C
C
A
A
L
L
S
S
C
C
I
I
E
E
N
N
C
C
E
E
S
S
Available online at:
http://www.iajps.com
Research Article
DEVELOPMENT AND VALIDATION OF TLC
DENSITOMETRIC METHOD FOR THE SIMULTANEOUS
ESTIMATION OF ASPIRIN AND TICLOPIDINE
HYDROCHLORIDE IN TABLET DOSAGE FORM
Bhusal Ramesh Dattatraya*, Kolhe Mahesh Hari, Laware Ravindra Bhimraj, Hajare
Pranit Pandurang.
Department of Pharmaceutics, Pravara Rural College of Pharmacy, Loni, Pravaranagar, Tal-
Rahata, Dist- Ahmednagar, Maharashtra
Abstract:
Accurate, specific, precise and robust TLC densitometric method has been developed for simultaneous estimation of Aspirin (ASP) and Ticlopidine hydrochloride (TIC) in tablet dosage form. The chromatographic separation was performed on precoated silica gel TLC 60 F254 plates using n-Hexane: Ethyl acetate: Methanol (6.5:1.5:2 v/ v/v) as mobile phase. This system was found to give compact bands for Aspirin and Ticlopidine hydrochloride (RF values 0.52 ± 0.05and 0.75 ± 0.05 respectively). Densitometric analysis of Aspirin and Ticlopidine hydrochloride were performed at 239 nm. Regression analysis data for the calibration plots were indicative of good linear relationships between response and concentration over the range 1000-5000 ng/band for Aspirin and 500-2500 ng/band for Ticlopidine hydrochloride. The method was validated as per ICH guidelines for accuracy, precision, LOD, LOQ and robustness
Keywords:
Aspirin (ASP), Ticlopidine hydrochloride (TIC)Corresponding author:
Mr. Ramesh D. Bhusal,
Asst. Professor,
Dept. of Pharmaceutcs,
Pravara Rural College of Pharmacy, Loni,
Pravaranagar, Tal- Rahata, Dist- Ahmednagar,
Maharashtra.
Mob- +917028114397
E-Mail:
[email protected]
Please cite this article in press as Ramesh D.Bhusal et al, Development and Validation of TLC Densitometric Method for the Simultaneous Estimation of Aspirin and Ticlopidine Hydrochloride in Tablet Dosage Form,
Indo Am. J. Pharm. Sci, 2016; 3(5).
w w w . i a j p s . c o m
Page 436
INTRODUCTION:Aspirin (ASP) Description:
The prototypical analgesic used in the treatment of mild to moderate pain. It has anti-inflammatory and antipyretic properties and acts as an inhibitor of cyclooxygenase which result in the inhibition of the biosynthesis of prostaglandins. Acetylsalicyclic acid also inhibits platelet aggregation and is used in the prevention of arterial and venous thrombosis.
Colour: off white to white
Appearance: Fine crystalline powder slightly hygroscopic
Odor: Odorless
The structural formula of Aspirin is
Chemistry:
IUPAC name : 2-acetoxybenzoic acid Molecular Formula : C9H8O4
Molecular weigh t : 180.2 g/mol Solubility: Freely soluble in Ethanol, methanol, Dimethyl formamide. Also soluble in DMSO. Category: Antiplatelet agent, Anti-inflammatory; analgesic.
Ticlopidine Hydrochloride (TIC) Description:
Ticlopidine is an effective inhibitor of platelet aggregation. The drug has been found to significantly reduce infarction size in acute myocardial infarcts and is an effective antithrombotic agent in arteriovenousfistulas, orto-coronary bypass grafts, ischemic heart disease, and venous thrombosis. Colour: off white to white
Appearance: Fine crystalline powder Odor: Odorless
The structural formula of Ticlopidine Hydrochloride is
. HCl
Chemistry:
IUPAC name : 5-(2-chlorobenzyl)-4, 5, 6, 7-tetrahydrothieno[3, 2-c]pyridine
Molecular Formula : C14H14ClNS.HCl
Molecular weight : 263.786 g/mol. Solubility: Freely soluble in ethanol (95%), in chloroform and in ether; practically insoluble in water.
Category: Anti-inflammatory; analgesic.
Detailed survey of literature for ASP alone or in combination with other drugs is reported to be estimated by several methods based on different techniques such as UV spectrophotometry, HPLC and HPTLC for its determination from pharmaceuticals. Similarly literature survey for TIC alone or in combination with other drugs is reported to be estimated by UV spectrophotometry, HPLC and HPTLC method. But no methods have been reported for simultaneous determination of ASP and TIC. Hence in the present work a successful attempt has been made to estimate both these drugs simultaneously by TLC densitometric method. Currently TLC densitometric is becoming a routine technique for analysis of drug.
MATERIALS AND METHODS: Chemicals and Reagents
Preparation of Standard Stock Solutions
Standard stock solution A: Accurately weighed quantity of ASP (10.0 mg) was transferred to 25.0 ml volumetric flask, dissolved and diluted to the mark with methanol. (concentration 400 µg /ml)
Standard stock solution B: Accurately weighed quantity of TIC (25.0 mg) was transferred to 25.0 ml volumetric flask, dissolved and diluted to the mark with methanol. (Concentration 1000 µg/ ml).
Standard stock solution C: An accurately weighed quantity of ASP (10.0 mg) and TIC (25.0 mg) was transferred to 25.0 ml volumetric flasks, dissolved and diluted up to mark with methanol. (Concentration: 400 µg/ml of ASP and 1000 µg/ml of TIC).
Selection of Mobile Phase
Aliquot portions of standard stock solutions A and B (5 µl each) were applied on TLC plates in the form of band (band size: 6 mm) and the plates were run in different solvent systems. In an attempt to achieve the desired Rf value range
w w w . i a j p s . c o m
Page 437
were made by using different solvent systemscontaining non-polar and relatively polar solvents. Among the different mobile phase combinations tested, mixture of n-Hexane, Ethyl acetate and Methanol (6.5:1.5:2, v/v/v) gave compact bands which showed symmetrical peak on chromatogram and desired Rf value. The Rf
values were found to be 0.52 and 0.75 for Aspirin and Ticlopidine hydrochloride, respectively.
Selection of Wavelength for Densitometric
Evaluation of Separated Bands:
Standard stock solution A and B were individually applied on TLC plate with the help of CAMAG LINOMAT-V automatic sample applicator, the plate was chromatographed in twin-through glass chamber saturated with mobile phase for 20 min. After chromatographic development, the plate was removed and air dried. The bands on the TLC plate were scanned over the wavelength range of 200-700 nm. The wavelengths 239 nm was selected for densitometric evaluation of ASP and TIC bands as both the drugs showed significant absorbance at this wavelength. The spectrum obtained for ASP and TIC are depicted in Fig.No.1.
Optimum Chromatographic Conditions
The following chromatographic conditions were optimized by trial and error for densitometric analysis of ASP and TIC
Stationary phase : Aluminium plates precoated with silica gel 60 F254 (Merck)
Mobile phase : n-Hexane: Ethyl acetate: Methanol (6.5:1.5:2 v/ v/v)
Plate size : 10 cm x 10 cm Mode of application : Band
Band size : 6 mm (Distance between two bands: 5.6 mm)
Sample volume : 5 µl
Development chamber: Twin-through glass chamber, 10 cm x 10 cm with stainless steel lid. Saturation time : 20 min.
Separation technique : Ascending Migration distance : ≈ 80 mm Temperature : 25 ± 50c
Scanning mode : Absorbance/Reflectance Slit dimensions : 5 x 0.45 mm
Scanning wavelength : 239 nm
The retention factors of ASP and TIC were ASP : 0.52 ± 0.05
TIC : 0.75 ± 0.05
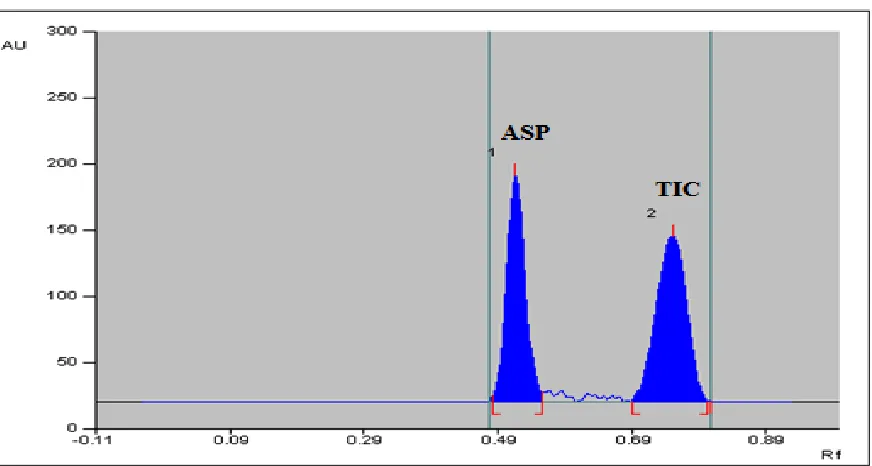
The typical densitogram obtained for ASP and TIC is shown in Fig.No.2
Study of Linearity Range:
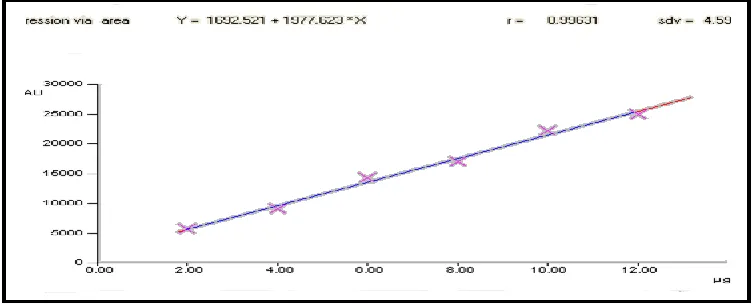
The standard stock solution C containing ASP (400 µg/ml) and TIC (1000 µg/ml) was applied on the TLC plates in the range 2-12 µl with the help of micro syringe using LINOMAT-V automatic sample applicator. The plate was then developed and scanned under the above mentioned chromatographic conditions.
Peak area was recorded for each drug concentration and the calibration curves of Concentration Vs. Peak area were constructed for both the drugs. The calibration curve for TIC and ASP are depicted in Fig.No.3 and 4, respectively.
Analysis of Standard Laboratory mixture:
Six sample solutions were prepared and analyzed in following manner:
An accurately weighed quantity of 10 mg ASP and 25 mg TIC was transferred to 25.0 ml volumetric flasks, dissolved and diluted up to the mark with methanol. (Concentration 400 µg/ml ASP and 1000 µg/ml TIC).
On TLC plate two bands of standard stock solution C and four bands of sample solution, 5 µl each, were applied and the plate was developed and scanned under the optimized chromatographic conditions. After scanning, the peaks obtained for standard and sample were integrated and the peak area obtained for standard and sample bands was recorded. Amount of the drugs present in sample (in mg) was obtained by comparing the mean peak area of sample bands with that of standard bands. Results of analysis of standard laboratory mixture and its statistical evaluation are shown in Table No. 1 and 2, respectively.
Analysis of the Tablet Formulation
Six samples were prepared and analyzed in following manner:
Twenty tablets were weighed, average weight was calculated and the tablets were then crushed to obtain fine powder. Accurately weighed quantity of tablet powder equivalent to about 50 mg of ASP and 125 mg of TIC was transferred to 25.0 ml volumetric flask, added 15 ml methanol and ultrasonicated for 20 min; volume was then made upto mark with methanol. The solution was mixed and filtered through Whatman filter paper No. 42. From the filtrate, 2.0 ml solution was diluted to 10.0 ml with methanol.
w w w . i a j p s . c o m
Page 438
developed and scanned under the optimumchromatographic conditions. After scanning, the peak obtained for standard and sample bands were integrated and the peak area obtained for standard and sample bands was recorded. The amount of ASP/TIC (in mg/tablet) was calculated by comparing mean peak area of sample bands with that of standard bands. Result of analysis of tablet formulation and its statistical evaluation are shown in Table No.3 & 4, respectively.
Method Validation
The proposed method was validated by studying several parameters such as accuracy, precision, linearity, limit of detection (LOD), limit of quantitation (LOQ) and robustness.
Accuracy:
To ascertain the accuracy of proposed method, recovery studies were carried out by standard addition method, as per ICH guidelines.
An accurately weighed quantity of pre-analyzed tablet powder equivalent to about 50 mg ASP /125 mg TIC was transferred individually in nine different 50.0 ml volumetric flasks. To each of the flask following quantities of ASP /TIC were added:
Flask No.1: 40.1 mg ASP + 100.3 mg TIC, Flask No.2: 40.0 mg ASP + 100.2 mg TIC, Flask No.3: 40.2 mg ASP + 100.0 mg TIC, Flask No.4: 50.0 mg ASP + 125.1 mg TIC, Flask No.5: 50.2 mg ASP + 125.4 mg TIC, Flask No.6: 50.4 mg ASP + 125.1 mg TIC, Flask No.7: 60.2 mg ASP + 150.0 mg TIC, Flask No.8: 60.0 mg ASP + 150.4 mg TIC, Flask No.9: 60.2 mg ASP + 150.1 mg TIC. Then, 30.0 ml methanol was added to each flask and contents of the flask were ultrasonicated for 20 min, volume was made up to the mark with methanol. The solution was individually mixed and filtered through Whatman filter paper No. 42. From the filtrate, 2.0 ml solution was diluted to 10.0 ml with methanol.
On TLC plate two bands of standard stock solution C and four bands of sample solution, 5 µl each, were applied and the plate was developed and scanned under the optimized chromatographic conditions. After scanning, the chromatograms obtained for standard and sample were integrated and peak area for standard and
sample bands was recorded. Total amount of drug estimated in sample was obtained by comparing the peak area of sample bands with that of the standard bands.
Results of recovery studies and its statistical validation are shown in Table 5 and 6, respectively.
Precision :
Intra-day and inter-day precision was determined by analyzing tablet sample solutions at different time intervals on the same day and on three different days, respectively. Tablet sample solution was prepared and analyzed in the similar manner as described under analysis of the tablet formulation.
Results of intra-day and inter-day precision are shown in Table No.7 and 8, respectively.
Limit of Detection and Limit of
Quantification:
The LOD and LOQ were separately determined which is based on the standard deviation of response of the calibration curve. The standard deviation of y- intercept and slope of the calibration curves were used to calculate the LOD and LOQ. Results are shown in Table No.9
Robustness:
To evaluate the robustness of the proposed method, small but deliberate variations in the optimized method parameters such as composition of the mobile phase, change in amount of mobile phase, duration for chamber saturation, time from spotting to development, and time from development to scanning were done. The composition of the mobile phase, amount of mobile phase and chamber saturation time were varied in the range of ± 0.1 ml, ± 1.0 ml and ± 5 min, respectively, of the used optimized conditions. In variation for time from spotting to development, after applying the sample bands the TLC plate was developed at 5 min, 20 min and 1h time interval. In variation for time from development to scanning, after developing the TLC plated in optimized chromatographic conditions the TLC plate was scanned 5 min, 20 min and 1h time interval. The effect of these changes on both the Rf value and
peak shape of the drug peak was studied.
w w w . i a j p s . c o m
Page 439
RESULTS:Fig 1: Spectrum for Aspirin and Ticlopidine HCl
w w w . i a j p s . c o m
Page 440
Fig 3: Standard Calibration Curve for Ticlopidine HClFig 4: Standard Calibration Curve for Aspirin
Table 1: Results of Analysis of Standard Laboratory Mixture
Sr. No.
Amount of pure drug taken
(mg)
Sample Peak area*
Standard Peak area*
Amount of pure drug estimated
(mg) % Estimation
ASP TIC ASP TIC ASP TIC ASP TIC ASP TIC
1. 10.1 25.1 7127.46 14395.15 7163.55 14420.16 9.95 24.96 98.51 99.43
2. 10.1 25.0 6036.2 14595.85 6077.45 14434.7 9.93 25.28 98.34 101.12
3. 10.0 25.2 5855.9 15407.85 5885.30 15250.10 9.95 25.26 99.50 100.23
4. 10.0 25.1 6650.17 13968.67 6634.15 13848.55 10.02 25.22 100.24 100.47
5. 10.0 25.1 5774.20 14341.60 5824.30 13942.90 9.91 25.71 99.14 102.45
6. 10.0 25.0 5854.50 13196.43 5753.90 13309.60 10.17 24.79 101.75 99.15 *denotes average of four determinations
Table 2: Statistical Validation for Standard Laboratory Mixture Analysis
Sr. No Drug % Estimation* S.D C.V
1. ASP 99.58 ± 0.778 0.781
2. TIC 100.16 ±0. 418 0.417
w w w . i a j p s . c o m
Page 441
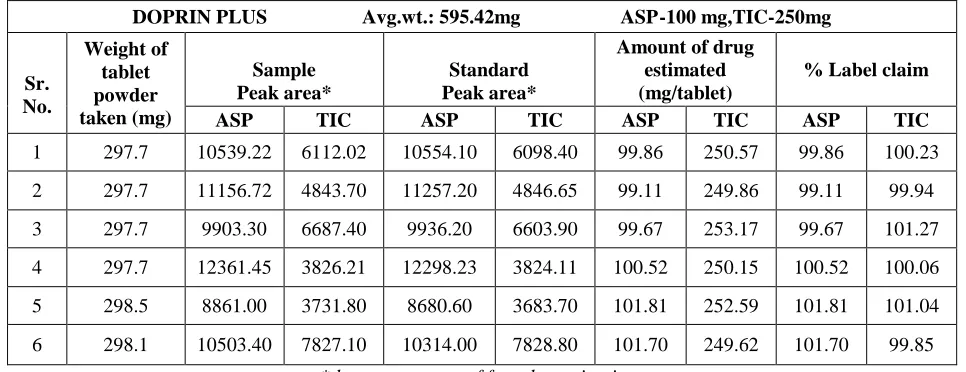
Table 3: Result of Analysis of Tablet FormulationDOPRIN PLUS Avg.wt.: 595.42mg ASP-100 mg,TIC-250mg
Sr. No.
Weight of tablet powder taken (mg)
Sample Peak area*
Standard Peak area*
Amount of drug estimated (mg/tablet)
% Label claim
ASP TIC ASP TIC ASP TIC ASP TIC
1 297.7 10539.22 6112.02 10554.10 6098.40 99.86 250.57 99.86 100.23
2 297.7 11156.72 4843.70 11257.20 4846.65 99.11 249.86 99.11 99.94
3 297.7 9903.30 6687.40 9936.20 6603.90 99.67 253.17 99.67 101.27
4 297.7 12361.45 3826.21 12298.23 3824.11 100.52 250.15 100.52 100.06
5 298.5 8861.00 3731.80 8680.60 3683.70 101.81 252.59 101.81 101.04
6 298.1 10503.40 7827.10 10314.00 7828.80 101.70 249.62 101.70 99.85
*denotes average of four determinations
Table 4: Statistical Evaluation for Analysis of Tablet Formulation
Sr. No.
Drug
Amount of drug
estimated (mg/tablet)* % Label claim* S.D C.V
1 ASP 100.45 100.45 1.110 1.105
2 TIC 250.99 100.40 0.603 0.600
*denotes average of six determinations
Table 5: Result for Recovery Studies.
Sr. No.
Level of recovery
Weight of tablet powder taken (mg)
Amount of drug added(mg)
Amount of drug
recovered(mg) % Recovery
ASP TIC ASP TIC ASP TIC
1 80 %
297.7 40.0 100.3 100.47 100.47 100.17 100.17 297.7 40.0 100.2 100.05 100.05 99.85 99.85 297.7 40.2 100.0 99.90 99.90 99.90 99.90
2 100 %
297.7 50.0 125.1 123.69 123.69 98.87 98.87 297.7 50.2 125.4 125.65 125.65 100.20 100.20 297.7 50.4 125.1 123.65 123.65 98.84 98.84
3 120 %
297.7 60.2 150.0 150.69 150.69 100.46 100.46 297.7 60.0 150.4 150.93 150.93 100.35 100.35 297.7 60.2 150.1 146.79 146.79 98.13 98.13
Table 6: Statistical Validation for Recovery Study.
Level of recovery
% Recovery * S.D C.V
ASP TIC ASP TIC ASP TIC
80 % 98.77 99.87 0.130 0.023 0.131 0.023
100 % 98.81 99.30 0.292 0.776 0.295 0.781
w w w . i a j p s . c o m
Page 442
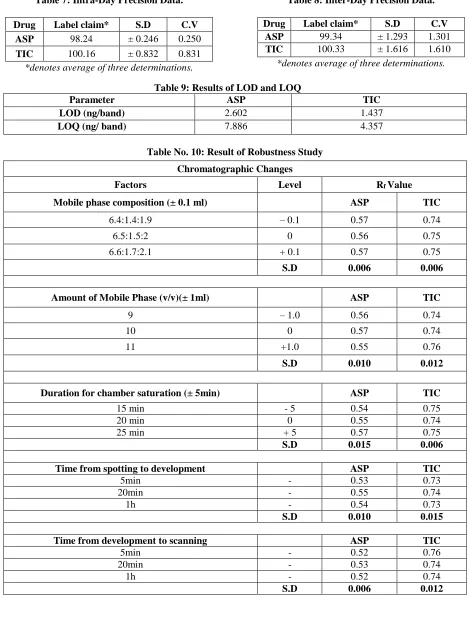
Table 7: Intra-Day Precision Data.Drug Label claim* S.D C.V ASP 98.24 ± 0.246 0.250
TIC 100.16 ± 0.832 0.831 *denotes average of three determinations.
Table 8: Inter-Day Precision Data.
Drug Label claim* S.D C.V ASP 99.34 ± 1.293 1.301 TIC 100.33 ± 1.616 1.610 *denotes average of three determinations.
Table 9: Results of LOD and LOQ
Parameter ASP TIC
LOD (ng/band) 2.602 1.437
LOQ (ng/ band) 7.886 4.357
Table No. 10: Result of Robustness Study
Chromatographic Changes
Factors Level Rf Value
Mobile phase composition (± 0.1 ml) ASP TIC
6.4:1.4:1.9 – 0.1 0.57 0.74
6.5:1.5:2 0 0.56 0.75
6.6:1.7:2.1 + 0.1 0.57 0.75
S.D 0.006 0.006
Amount of Mobile Phase (v/v)(± 1ml) ASP TIC
9 – 1.0 0.56 0.74
10 0 0.57 0.74
11 +1.0 0.55 0.76
S.D 0.010 0.012
Duration for chamber saturation (± 5min) ASP TIC
15 min - 5 0.54 0.75
20 min 0 0.55 0.74
25 min + 5 0.57 0.75
S.D 0.015 0.006
Time from spotting to development ASP TIC
5min - 0.53 0.73
20min - 0.55 0.74
1h - 0.54 0.73
S.D 0.010 0.015
Time from development to scanning ASP TIC
5min - 0.52 0.76
20min - 0.53 0.74
1h - 0.52 0.74
w w w . i a j p s . c o m
Page 443
CONCLUSION:The TLC densitometric method was developed and validated as per ICH guidelines. The standard deviation and % RSD calculated for the proposed methods are low, indicating high degree of precision of the methods. The results of the recovery studies performed show the high degree of accuracy for the proposed methods. Hence, it can be concluded that the developed HPTLC method was accurate, specific, precise and robust can be employed successfully for the estimation of ASP and TIC in tablet dosage form.
REFERENCES:
1. Christian GD. 1995. Analytical Chemistry. New Delhi, Wiley India Pvt. Ltd.
2.Skoog DA, Holler FJ, Crouch SR. 2007. Fundamental of Instrumental Analysis. India: Thomson Books/Cole Publication.
3.Gennaro AR, Remington. 2000. The Science and Practice of Pharmacy. Philadelphia: Lippincott Williams and Wilkin Publication.
4.Anjeneyulu Y, Chandrasekhar K, Manikam V. 2008. A Textbook of Analytical Chemistry. Pharmamed Press BSP Book Publiaction.
5.Somenath M. 2003. Sample Preparation Techniques in Analytical Chemistry. New York: Wiley Interscience Publisher.
6.Sharma BK. 1991. Instrumental Methods of Chemical Analysis. Meerut: Goel Publishing House. 7.Willard HH, Meritt LL, Dean JA, Settle F. 2001. Instrumental Method of Analysis. Delhi: CBS Publishers and Distributors.
8.Skoog DA, Holler FJ, Crouch SR. 2007. Principle of Instrumental Analysis. India: Thomson Books/Cole publication.
9.Izmailov NA, Shraiber MS. 1903. Introduction and History of HPTLC. Farmatisiya.
10.Tswett M. Introduction and History of HPTLC. Soc. Nat. Sci. Biol. Section, 1903:14.
11. Halpaap H. Introduction and History of HPTLC. Journal of Chromatography, 1973:77-78.
12.Gunther KJ. Introduction and History of HPTLC. Journal of Chromatography, 1988:11-30
13.ICH, (Q2R1), Harmonized Tripartite Guideline, Validation of Analytical Procedures: Text and Methodology, IFPMA. Geneva; 2005: 1-13.
14.ICH, (Q2A), Harmonized Tripartite Guideline, Text on Validation of Analytical Procedures, IFPMA. Geneva; 1994: 1-5.