Research Journal
Volume 8, No. 24, Dec. 2014, pages 111–118
DOI: 10.12913/22998624/578 Reseach Article
ROLE OF VISUALIZATION IN ENGINEERING EDUCATION
Renata Lis1
1 Faculty of Fundamentals of Technology, Lublin University of Technology, Nadbystrzycka 38, 20-618 Lublin, Poland, e-mail: [email protected]
ABSTRACT
The article includes an analysis of the results of research on the influence of visual
-ization on the effectiveness of training. It analyzes the application of visual-ization in engineering education with a particular focus on visual design principles. Examples of the use static and dynamic visualization in multimedia learning in technology and computer science are presented.
Keywords: visualization, visual design principles, multimedia education.
INTRODUCTION
The development of new information tech-nologies affected the way of providing and as-similating information, focused on a monitor and digital environment rather than a book and a piece of paper. New media require having not only the abilities of reading and writing but also the so-called new abilities – visual literacy and digital literacy [8]. This situation forces a change of manner in conveying knowledge by education establishments. More and more in-formation, provided in an inappropriate way, causes information overload. According to re-searches, information visualisation enables to convey knowledge in a condensed manner, in-creasing its assimilation, compared to traditional text transmission [15].
INFORMATION VISUALIZATION
The term ‘visualisation’ is defined in many ways [3]. However, the dominating one is that of perceiving it as a mental process occurring while thinking and as an iconic representation. The first case concerns a mentation which oc-curs during perception of visual phenomena supporting visual/spatial thinking; the second one – a presentation of information, knowledge, processes with the use of static and dynamic
pic-tures. In both cases, we can distinguish the fol-lowing types of visualization:
• infographics,
• visualization representation of numeric values, • visualization concepts, procedures, processes, • architectural visualization,
• 3D visualization [15].
The general distinction divides visualisation into a static and a dynamic one. Static visualisa-tion includes:
• illustration – a presentation of visual elements using various media and such techniques as a hand drawing, a painting made with oil paint or a computer graphic;
• photograph – a faithful reflection of the state of affairs;
• 3D model – a digital reflection of the reality; whereas the dynamic one consists of:
• animation, understood as a series of pictures simulating motion;
• video, which means a series of pictures in a video technique;
• interactions, i.e. pictures triggered by a user [3].
The sole ability of using advanced graphics software is not sufficient for correct designing education animations, drawings, diagrams and multimedia presentations. What is needed is the understanding of cognitive processes occurring while visualisation perception [5].
RULES OF VISUAL DESIGN
Rules of visual designing originated from the Mayer’s theory of multimedia learning and ge-stalt psychology [11].
The theory of multimedia learning assumes that human brain receives information via two channels: a visual and a verbal one (see Figure 1). Such visual materials as: illustrations, photo-graphs, charts and animations are processed in one channel and verbal information in the other. R.E. Mayer states that each channel has a ited capacity, therefore, it can process only lim-ited amount of verbal and visual information in a specified time. Learning process occurs while processing information in information channels and organizing it into a comprehensive verbal or visual model and creating own knowledge in the final stage. However, cognitive overload often oc-curs, which is a result of inappropriate convey-ance of knowledge by the teaching person.
According to the multimedia education theory, such rules as the following should be obeyed in the process of designing information visualisation:
• the rule of contiguousness of visual and ver-bal contents – visualisation helps the educa-tion process if the pictures and text layers of a message correspond to each other at the level of meanings [15];
• the rule of personification – didactic
trans-mission should be personalised; messages should be written and spoken in the 1st and 2nd person and knowledge should be conveyed in a form of a dialogue;
• the rule of modality – visualisation is effec-tive if supported by a narration; researches in-dicate that students who saw pictures and text and heard accompanying narration achieved
up to 50% higher scores in the subsequent knowledge tests, compared to those who only saw picture and the text which was to be read in the screen;
• the rule of logicality – the researches of Mayer reveal that better results of education are achieved if additional sounds, recordings, videos or narrations which are not a direct el-ement of educational program, are removed; seemingly, it can attract the pupil, but it was proved that they do distract and dissuade from the main transmission of the content;
• the rule of interactivity – it relies on frequent overloading the presentation screens with in-formation; if part of the elements are included in an interactive form – opened on a click – the learner controls his/her own cognitive pro-cesses, therefore increasing the effectiveness of learning;
• the rule of redundancy – the researches re-vealed that the use of visualisation containing text, picture and narration causes an effect of visual channel overload, thus the materials are less clear than those containing e.g. only a pic-ture and text;
• the rule of signalling – the structure of edu-cation materials creates a specified space; to emphasize the crucial elements and relations between them, signalling certain terms and relations between them is important; the re-searches of the author of the theory of multi-media learning reveals that the examined ones achieved better effects when the education material was divided into signalled elements than in the situation without them;
• the rule of parallelism – effectiveness of learning increases if visualisation and verbal narration occur not subsequently but simul-taneously; asynchronous and non-parallel
occurrence of picture and verbal contents does not provide the learner a possibility of combining them in operating memory and relating them appropriately to the previous knowledge [9,11].
In the process of designing visualisations rules of perceptual grouping (which are described in laws of the gestalt psychology) are used. • Law of similarity – elements with similar
appearance are perceived as one. Eyesight groups unconditionally those elements which are characterised by similar relations result-ing from the same shape, size or colour. This law is used quite often for selecting active links and buttons. Due to this issue, users have got no problem with navigation of these elements, they identify them upon the same features, e.g. colour which enables to com-bine them into groups.
• Law of proximity – the mind groups neigh-bouring elements. Approximation of appro-priate elements increases the effectiveness of information perception. Application of such a mechanism improves the clarity of the mate-rial and facilitates the identification of the el-ements. The researches of G.H. Bower, M.B. Karlin and A. Dueck confirmed the suit-ability of using descriptions below pictures. Their experiment consisted in presenting pic-tures to a group of volunteers. Some of them only watched the presented works, whereas the second group not only saw the pictures but also had a possibility of reading their descrip-tions. The following stage of that experiment was to indicate the pictures which the par-ticipants saw among various ones. Obviously, the group who saw pictures with descriptions achieved better results. Due to the description, an observer can understand the presented con-tent better [4].
• Law of continuity – it indicates that it is eas-ier to perceive objects with soft shapes than those whose edges change sharply and rapidly. Objects creating lines or curves or any iden-tifiable element, are perceived as connected with each other. A good composition is char-acterised by elements perceived as a whole de-spite the use of different colours or shapes. In this case, eyesight perception groups elements upon their location, not features. By using this law, recipient’s attention can be directed to-wards specified elements [1].
Not only do the described rules and laws de-fine how to design the visualisation. Having in mind the fact that every visualisation contains a picture, it is worth remembering the features of the picture which are related to strengthening the transmission.
EXAMPLES OF USES OF VISUALIZATION
IN ENGINEERING EDUCATION
Visualisation is very significant in engineer-ing education because this kind of education is a specific form which requires orienting towards the practical aspect of the described processes. For appropriate conveyance of knowledge a visu-alisation of a given process, e.g. friction one, is often necessary.
An example of application of visualisation in the education of future engineers in the techni-cal and informatics education field of study is a multimedia course concerning technical mechan-ics with strength of materials created by a student of the above-mentioned field of study, as a part of its degree dissertation [7]. That course realises such issues as:
• calculation of friction factor with the use of inclined plane;
• calculation of efficiency of screw-nut system; • analysis of stresses and calculation of G shear
modulus (Kirchoff’s) in a twisted pipe; • examinations of deformations and stresses in
a bent beam;
• static attempt of stretching the material; • elastic buckling of a straight rods.
The course consists of many training screens containing static and dynamic visualisation in a form of photographs, illustrations and interac-tive pictures (Figure 2). It presents photographs and illustrations of research stations enabling conducting individual lab classes on technical mechanics. A simulation of operation of the indi-vidual research stations was included.
com-Fig. 2. Training screens containing visualisations from the course of technical mechanics with strength of materials [7]
mitment from students. If they do not click on the given option appropriately, they will not be able to proceed to the next screen, thus to complete the course. The range of the course comprises of basic knowledge on 3D modelling, 3ds Max 2013 software interface and utilitarian object and room modelling [6].
The last example of application of visualisa-tion in engineering educavisualisa-tion concerns computer networks construction course [10]. It presents such issues as: computer networks topology and TCP/ IP and OSI models, terminating cables, elementary hardware for designing the network, what an IP address and subnetwork mask are and area-based classification of computer networks.
The presented examples of multimedia courses became a subject of author’s own re-searches, concerning the impact of visualisation on education effectiveness in technical and in-formatics courses.
VISUALISATION IMPACT ON EDUCATION
EFFECTIVENESS RESEARCH
Education effectiveness is understood here as a level of implementation of the presumed didac-tic aims and the following knowledge increase indicator was used for measuring it [4]:
PW =
where: PW – knowledge increase indicator,
Wmax – possible maximal score of the re-searched one’s competence measure-ment,
Wpre – score of the researched one’s com-petence measurement before the di-dactic process,
Wpost – score of the researched one’s
com-petence measurement after the di-dactic process.
In the researches conducted by the author, the measurement of competence was made in a form of filling in a test of knowledge of a given range which was a part of the multimedia course. The researched ones had to fill it in before attending the course (a pre-test) and after it (a post-test). The acquired data were the basis for calculating the knowledge increase for each participant using the presented formula. Therefore, the data was averaged for the researched group.
ing with a course containing static visualisations in a form of photographs and illustrations as well as dynamic visualisations in a form of interac-tions and animainterac-tions, and the second one – with materials containing the same issues but in a form of text. The test of initial knowledge (the pre-test) and of eventual knowledge (the post-pre-test) was carried out in both groups. The tests were the same for each group and consisted of 9 questions. Single choice questions were used. For each cor-rect answer a point could be scored. Maximal achievable amount of points were 9.
60 respondents participated in the research, 30 people per group. The first of the examined groups consisted of people who had got the task of completing the course containing visualisations in a form of pictures and interactions. The task of the second one was of completing the course including only text element. Essential content of both courses was the same.
Table 1 presents the average scores achieved by the researched in the pre-test and in the post-test as well as the percentage knowledge increase in the individual groups.
In the group participating in the course without visualisation, the result increased by 2.1 points, whereas the knowledge increase, calculated with the use of the formula present-ed earlier, was 43.6%. In the second one, which participated in the course with visualisation, the knowledge increase was very significant, because it was 82.35%. The points average in-creased by 4.7 points. Therefore, the impact of visualisation on the level of assimilated mate-rial in the range of technical mechanics is
sig-nificant. Students participating in the course with dynamic visualisation assimilated almost 40% more information than those in the one without it.
The next experiment concerned the impact of dynamic and static visualisation on the level of knowledge in the range of architectural mod-elling in Autodesk 3ds Max 2013 software [6]. Those were conducted in a computer room of The Faculty of Fundamentals of Technology at Lublin University of Technology with the par-ticipation of second-year students of the techni-cal and information technology education first-cycle studies in the Spring Semester of 2014. Two lab groups were examined, a total of 33 people. The first group, 15 students, was asked to complete a course containing static visualisa-tion in a form of illustravisualisa-tions and photographs; the second one, 18 people, attended to a course including dynamic visualisations in a form of animations and interactions. The test consisted of 7 single choice questions; maximum achiev-able amount of points was 7.
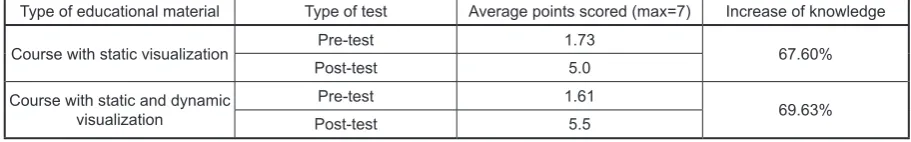
Table 2 presents the average scores achieved by the researched in the pre-test and in the post-test as well as the percentage knowledge increase in the individual groups.
The students participating in the course with static visualisation achieved 67.60% knowledge increase in the range of architectur-al modelling and the points average increased by 3.27. In the group with the course contain-ing dynamic visualisations, increase of points was similar at 3.39 and the knowledge increase indicator equalled 69.63%. Therefore, students
Table 1. Average scores from the tests in the researched groups and percentage knowledge increase indicator after the participation in the course of technical mechanics
Type of educational material Type of test Average points scored (max=9) Increase of knowledge
Course without visualization Pre-test 2.4 43.60%
Post-test 4.5
Course with dynamic visualization
Pre-test 2.3
82.35%
Post-test 7.0
Table 2. Average scores from the tests in the researched groups and percentage knowledge increase indicator after the participation in the architectural modelling in Autodesk 3ds Max 2013 course
Type of educational material Type of test Average points scored (max=7) Increase of knowledge
Course with static visualization Pre-test 1.73 67.60%
Post-test 5.0
Course with static and dynamic visualization
Pre-test 1.61
69.63%
participating in the course with static visualisa-tion achieved similar scores compared to those participating in the course with visualisations including not only illustrations but also ani-mations and interactions. It can be concluded that – in the case of 3D modelling issues – the impact of introducing dynamic visualisation on the level of assimilating knowledge is minor, because it is quite expensive and time-consum-ing in its preparation.
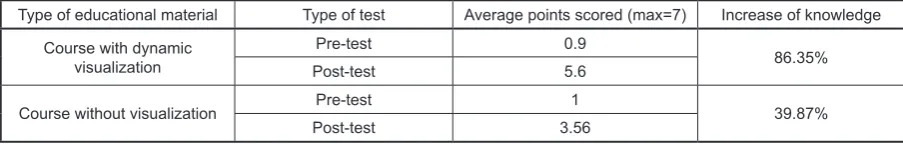
The last course of the ones presented in this article concerned the computer network con-struction [10]. The research on visualisation im-pact on the level of knowledge in this range was conducted in the Spring Semester of 2014 at The Faculty of Fundamentals of Technology at Lub-lin University of Technology among the second-year students of the technical and informatics education first-cycle studies. They were divided into two groups which were independent from each other, each one having a task of completing a course containing dynamic visualisations or one without them. The text content of the course was the same in both cases. A total of 50 people participated in the research, 25 per each group. Table 3 presents the scores achieved by the re-searched in the pre-test and in the post-test, as well as the percentage knowledge increase in the individual groups.
The examined who participated in the course without visualisation in the range of computer network construction achieved an average knowledge increase by 2.56 points. The aver-age knowledge increase was 39.87%. The sec-ond group, which was participating in the course with visualisation, raised its score by 4.7 and the knowledge increase was as high as 86.35%. Probably, numerous interactions and animations included in the course had a strong impact on that score.
The presented results of the researches have a preliminary and partial character. However, they can provide certain hints for designing visualisa-tions and multimedia didactic materials.
CONCLUSIONS
The conducted researches aimed at specify-ing how the application of visuals in engineerspecify-ing education affects the effectiveness of acquiring knowledge and if dynamic visualisation is more effective than the static one.
The presented analyses reveal that the appli-cation of visualisation in the multimedia technical and informatics courses improved the assimila-tion of knowledge in that range significantly. In the case of the two courses, in which the scores of students participating in the course with visuali-sation and those in the one containing only a text version of the materials were compared, the aver-age increase of knowledge equalled 40%. Where-as in the research carried out among the students participating in the courses including visualisa-tions but varying in dynamicity no significant differences were observed. It can be presumed that a high importance on the level of knowledge increase among the participants of the courses containing visualisations was the sole matter of the courses, convergent with their field of studies as well as completing the courses in accordance with the rules of multimedia education.
REFERENCES
1. Anderson J.: Uczenie się i pamięć, integracja zagadnień. Warszawa 1998.
2. Arnheim R.: Sztuka i percepcja wzrokowa : psy
-chologia twórczego oka. Gdańsk: Akademia Sztuk Pięknych 2004.
3. Bergström B.: Komunikacja wizualna. Wydaw. Naukowe PWN, Warszawa, 2009.
4. Bramley, Ocena efektywności szkoleń, Dom Wydawniczy ABC, Kraków 2001.
5. Dylak S.: Wizualizacja w kształceniu nauczycieli, Wydawnictwo Uniwersytetu im. Adama Mickie
-wicza, Poznań 1995.
6. Gąszczyk-Gołos K.: Analiza edukacyjnych deter
-minantów efektywności kursów e-learningowych. Niepublikowana praca magisterska, Lublin 2014. Table 3. Average scores from the tests in the researched groups and percentage knowledge increase indicator after the participation in the computer network construction course
Type of educational material Type of test Average points scored (max=7) Increase of knowledge Course with dynamic
visualization
Pre-test 0.9
86.35%
Post-test 5.6
Course without visualization Pre-test 1 39.87%
7. Kosicka E.: Projekt wizualizacji treści dydak
-tycznych z przedmiotu mechanika techniczna z wytrzymałością materiałów. Niepublikowana pra
-ca inżynierska, Lublin 2011.
8. Kress G., van Leeuwen T.: Reading images. The gram
-mar of visual design. Routledge, New York 2008. 9. Leszkowicz M.: Komunikacja wizualna w edu
-kacji. [In:] Skrzydlewski W., Dylak S. (Eds.) Media - edukacja - kultura. W stronę edukacji medialnej. Poznań – Rzeszów, Polskie Towar
-zystwo Technologii i Mediów Edukacyjnych Poznań 2012.
10. Łukanowski M.: Badanie wpływu interaktywnych form przekazywania wiedzy na efektywność
kursów e-learningowych. Niepublikowana praca magisterska, Lublin 2014.
11. Mayer A.E.: The Cambridge handbook of multi
-media learning. Cambridge University Press 2014. 12. Mączyńska-Frydryszek A.: Psychologia widzenia. Akademia Sztuk Pięknych w Poznaniu, Poznań 2002. 13. Pastuszka W.: Barwa w grafice komputerowej.
Wydawnictwo Naukowe PWN, Warszawa 2000. 14. Pulak I., Tomaszewska M.: Visual literacy and
teaching with infographics. [In:] Edukacja ju
-tra. Edukacja w społeczeństwie wiedzy. Oficyna wydawnicza „Humanitas”, Sosnowiec 2011. 15. Ware C.: Visual thinking for design. Burlington
![Fig. 1. Process of multimedia leaning R.E. Mayer [11]](https://thumb-us.123doks.com/thumbv2/123dok_us/8809738.1776628/2.595.119.478.601.756/fig-process-multimedia-leaning-r-e-mayer.webp)
![Fig. 2. Training screens containing visualisations from the course of technical mechanics with strength of materials [7]](https://thumb-us.123doks.com/thumbv2/123dok_us/8809738.1776628/4.595.108.483.420.742/training-screens-containing-visualisations-technical-mechanics-strength-materials.webp)
![Fig. 4. Training screens from computer networks construction course [10]](https://thumb-us.123doks.com/thumbv2/123dok_us/8809738.1776628/5.595.101.492.69.356/fig-training-screens-computer-networks-construction-course.webp)