STUDIESIN EXPERIMENTALHYPERTONICITY
I. Pathogenesisof the Clinical Syndrome,BiochemicalAbnormalities
and Causeof Death
Juan F. Sotos, M.D., Philip R. Dodge, M.D., Patricia Meara, and Nathan B. Talbot, M.D.
Departments of Pediatrics and Neurology, Harvard Medical School, the Children's Medical and Neurology Services and the Joseph P. Kennedy, Jr. Laboratories,
Massachusetts General Hospital, Boston
E LEVATION of the osmolar concentration of body fluids much above normal
levels may lead to the development of a serious neurologic disorder and even death. While the numerous clinical and experi mental studies reported in recent years1-'4 have added much to our knowledge of the biochemical and anatomic abnormalities observed under conditions of hypertonicity, they have not indicated clearly the mecha nisms by which the clinical syndrome and death are induced.
The purpose of this communication is to report studies performed during the devel opment and treatment of hypertonicity re sulting from infusion of solutions of sodium chloride, sodium chloride plus sodium bi carbonate, sucrose, mannitol or urea. The data obtained indicate that hypertonicity, by causing certain specific biochemical changes in brain tissue, is the important fac tor in production of the clinical syndrome and death.
MATERIALSAND PROCEDURE
Twenty-nine healthy New Zealand male rab bits, weighing between 1,900 and 3,300 grams
were used for the study. Water and food were
allowed ad libitum up to the beginning of the experiment, at which time the bladder was emptied by catheterization, the animal
weighed and a control sample of blood drawn.
After the animal had been restrained, an in dwelling catheter was placed in the bladder and continuous collection begun. To facilitate the procurement of blood for chemical meas
urements, the femoral vessels were exposed under local9 anesthesia (procaine 2%) and a
polyethylene catheter, kept patent with small
amounts of heparin, was inserted into the ar tery and/or vein. Subcutaneous electrodes (27
gauge needles) were placed in the four ex tremities for electrocardiographic tracings and four electrodes were inserted under the scalp for electroencephalographic recordings.
An intravenous infusion of hypertonic solu tion (Table I) was started in one of the ear veins, the rate being controlled by means of an electrically driven pump. The rate ranged be tween 13 and 39 mosmol/kg/hr in the NaCI and NaCl plus NaHCO, groups, 17 and 25 mosmol/kg/hr in the sucrose-mannitol group
and 40 and 57 mosmol/kg/hr in the urea
group. In 17 instances this infusion was stopped when clinical signs indicated that death was imminent. All these animals died within the next 30 minutes. By this time, those
in the NaCl, NaCl plus NaHCO3 and sucrose mannitol groups had received on the average
105 mosmol (range 60 to 172) while those in
the urea group had received a mean dose of
174 mosmol (range 134 to 247) of solute per
kilogram of body weight. In 11 other instances the hypertonic infusion was stopped after the animals had been rendered markedly hyper
tonic and infusion of an hypotonic solution was begun; 0.1 molar NaCl plus NaHCO, (3:1)
was used in 1, 2.5% dextrose in water in 9 and
distilled water in 1 rabbit. The seven which
survived as a result of this treatment were
° General anesthesia (pentobarbital sodium, 30
mg/kg) was used for preparation of the animal in only four rabbits. The anesthetic effects had largely
disappeared by the time the infusion was begun.
This work was supported by grants (H-1529 and HTS-5139), National Heart Institute, National In stitutes of Health, Public Health Service.
ADDRESS: (N.B.T.) Massachusetts General Hospital, Fruit Street, Boston 14, Massachusetts.
NaCI155.8%NaCI1.000200010001000—25.8%NaCI
DEXTROSEIN
5%
WATER1.000200010001000—
UREA312% UREA IN 5°@@
DEXTROSE WATER2.0002000 —¿ —¿ —¿
6%NaCI+2.1%NaHCO3
1.285 2570 285 035 250
NaCI+NaHCO3
4% 2.8%N0CI
+ NoHCO3
HYPERTONICITY
killed abruptly at the close of the experiment by intravenous injection of pentobarbital sodium.
Blood samples, collected from arterial sources in 21 and venous sources in 8 instances, were drawn to correspond with timed urine collections. Samples reported as “¿atdeath― were taken 7 minutes or less prior to cessation of respirations, except in three instances when
they were drawn within 2 minutes after breath
ing had stopped.
Immediately after death the animals were weighed and the brain exposed. Samples of brain and of quadriceps muscle were placed in tared containers for chemical analysis and weighed immediately; the remainder of the brain was fixed in 10% formalin. Samples of brain and muscle taken from five normal rab bits were used as controls.
DETERMINATIONS
Blood determinations were carried out on
heparinized plasma. Tonicity was determined
with a Fiske osmometer;― sodium and potas sium by internal standard flame photometry;' chloridein plasma,tissueand urineeitherby Volhand titration'7or by polarography;' ureanitrogeninbloodand urineby themicro diffusion analysis of Conway;'9 blood sugar by
the method of Fohin;20 plasma pH by the bi
color standard method of Hastings and Sen
droy;― inorganic phosphorus in plasma by the
colorimetric method of Fiske and Subbarow.22 Tissues were weighed wet, dried to constant weight to obtain tissue water, then defatted with equal parts of petroleum and ethyl ethers, dried again to constant weight to obtain dry defatted weight (D.D.Wt.) and extracted with 0.75N nitricacidfordeterminationof Na, K and Cl.23 The values obtained are expressed
per 100 grams of dry defatted weight (D.D.Wt.) in the muscle, and per 100 grams of
dry non-defatted weight (D.Wt.) in the brain. All concentration values in tissue are expressed per liter of total water; no distinction is made between intra- and extracelhular compartments.
TABLE I
HYPERTONIC SOLUTIONS INFUSED IN 29 RABBITS
MOLES PER
TYPE OF SOLUTION
LITER *
2 1.02 3 2046 $023 690 333
mOsm / LITER *
NO. OF
RABB ITS TOTALNaCIHCO@
SUCROSEMANN
ITOL
5 70.8% SUCROSE 2.070 2070
.835 835 15% MANNITOL
GROUP
* DISREGARDING DEXTROSE
927 ARTICLES
CALCULATIONS
Total body water (T.B.W.) and extracellular water (E.C.W.) were assumed to be 60% and
25% of the total body weight, respectively, at the beginning of an experiment. Intracellular
water (I.C.W.) was taken as the difference be tween T.B.W. and E.C.W. Subsequent changes from these assumed 100% starting values were calculated from external balance and plasma measurement.24 The initial value for total body solutes was found by assuming that total solute concentration was the same in T.B.W. as it was in the plasma.2526 Subsequent changes, expressed in percent of normal, were calculated by adding cumulatively the external solute bal ance to the initial value. No correction was made for endogenous solutes formed and ex creted, as urea in the blood remained essen tially constant and urea output in the urine was negligible, except when urea was infused. In the five rabbits infused with hypertonic solutions containing dextrose (three in the urea and two in the NaCI group) the milliosomoles of dextrose were disregarded in calculating solute balance, as the blood sugar determination re flected complete utilization, except terminally.
RESULTS
Twenty-two rabbits died from infusion of hypertonic solutions. Seven others with se vere hypertonicity were treated with hypo tonic solutions and survived. These two groups of animals will be considered under separate headings.
Observations on Animals Dying with Hypertonicity
All animals, irrespective of the type of hypertonic solution infused, developed the same clinical syndrome and died between 13@and 9 hours from the beginning of the infusion. Initially the animals lay quietly, but as the infusion proceeded they started to lick their lips as if thirsty. When the
concentration of solutes in the plasma rose
above 350 mosm/1° in the NaCl, NaCl plus
* Although the conventional term milliosmoles
per liter is used here and subsequently, it should
be recognized that it refers in actual fact to the number of osmotically effective solutes per kilo
gram of water in the sample.
NaHCO3, sucrose and mannitol treated rab bits and above 400 in those treated with urea, these animals developed sequentially: restlessness alternating with decreased re sponsiveness, ataxia, nystagmus, irregular twitching, violent trembling and finally death by respiratory failure.
No tonic or clonic convulsions were ob served and no seizure patterns were visible in the electroencephalographic tracings. There were, however, electroencephalogra phic abnormalities which began to be ob served coincident with the clinical signs al ready described. These consisted of a gen eralized reduction in voltage, disappear ance of fast activity and appearance of bursts of 4 to 5-per-second spindle-like activity, progressing to 1 to 3-per-second high-voltage waves. Electroencephalo graphic activity ceased at the time of respir atory arrest.
Electrocardiographic tracings remained normal up to the time of cessation of res pirations, except in a few instances in which peaked T waves were observed in the terminal stages. Once the respirations stopped electocardiograhic abnormalities consisting of high peaked T waves, A-V dis sociation, absence of P waves and bizarre QRS complexes appeared. Cardiac activity ceased 1 to 3 minutes after the breathing stopped.
I
________
ii 1 I ___________
4 5
AT DEATH
RATE OF INFUSION 247a01m1k,IHII@3aIH2OlkgIHr
TOTAL BODY WATER 00
S NORMAL 80
TOTAL BODYSOLUTES:::@@@
450,
PLASMA mOsm/L
FIG. 1. Effects of infusing hypertonic solutions upon the content and distribution of water and elec trolytes within the body as a whole. The numbers in parentheses indicate the number of animals in each
group. All other numerical values and the black points are means. Vertical bars indicate ranges. Vertical arrows shown along the abscissae indicate when metabolic balances were started or ended.
@ (No observations were made at the time of death in a third rabbit infused with urea, however, it was alive and without clinical signs 12 hours after a slow infusion (16 mosm/kg/hour) was begun, at which time the following values were obtained: T.B.H20 = 80% of normal (N); T.B.S. = 152% of N; plasma
mosm/l = 549; plasma Na = 147 meq/l; plasma Cl = 105 meq/l; E.C.W. = 70% of N;
I.C.W.= 85%of N.)
UREA GROUP (2)*
WT.= 2.131 Kg.
NoCI GROUP(II)
W. =2.632 Kg.
SUCROSE(3) AND MANNITOL(l) GROUP WT.=2.537 Kg.
2L5.0sailk@I1k [email protected]
@ J
PLASMA Na mEq/L
C'
EXTRACELLULARH20 S NORMAL
INTRACELLULARH2O S NORMAL
TIME IN HOURS I @.._
0 I 2 3 4
AT DEATH
I -.
I
0 I 2 3 0t@@LIlI 2 i
AT DEATH
the urea-treated rabbits. When the presence or absence of intracranial hemorrhage was correlated with the time taken to accomplish maximal hypertonicity, it was found that hemorrhage occurred only in those rendered markedly hypertonic in less than 3% hours.
Figure 1 sets forth certain mean values ob tained as a result of the metabolic studies on the NaCl° (left hand division), the sucrose mannitol (middle division) and urea loaded animals (right hand division). Trends are indicated by the lines connecting the solid points. As a result of osmotic diuresis, the
0 Essentially identical values were obtained with
the three additional animals given a mixture of
NaC1 plus NaHCO,.
total body water decreased in all except one rabbit of the NaCl group, which died with an essentially normal value. The mean de crease in total water was slightly greater in the sucrose-mannitol group (where it fell to 80% of normal) than in the NaCl and urea groups (where it was reduced to 90%
and 93% of normal, respectively). The intake of solutes (milliosmoles)ex
ceeded the output and consequently total body solutes increased. The degree of solute retention was least in the sucrose-mannitol (109%), intermediate in the NaCl (127%), and greatest in the urea group (150% of normal).
ARTICLES 929
concentration rose to markedly supranormal levels. Hypertonicity was of comparable degree in the NaC1 and sucrose-mannitol groups with mean values at the time of death of 446 mosm/l (range, 395 to 496) and 470 mosm/l (range, 428 to 489), respec tively, but was distinctly higher in the urea animals (536 and 547 mosm/l).
Hypernatremia and hyperchloremia de veloped in the NaC1 groups in association with an average net gain of 26 meq of so dium and 25 meq of chloride per kg of body weight. Hyponatremia and hypochloremia were observed in the other groups which lost on the average of 6 meq of sodium and 7 meq of chloride per kg of body weight..
The values for the extracellular water varied over a wide range. On the other hand, the intracellular compartment de creased consistently up to the time of death, but to a different degree in each group, being 73% in the NaC1 group, 62% in the sucrose-mannitol group and 92% of normal in urea infused animals.
Observations in Animals Surviving Hyper tonicity by Treatment with Hypotonic Solu tions
Figure 2 sets forth the data obtained on five rabbits,° the plasma solute concentra tions of which were raised to a mean of 396
mosm/l (range 375 to 425) by the infusion
of hypertonic NaCl. During this period, restlessness developed in three rabbits, whereas in two the complete clinical syn drome, including twitching and trembling, was noted. Electroencephalographic and metabolic changes similar to those already described also occurred.
With the administration of hypotonic so lution all clinical signs had disappeared by
° Since the experimental design used for the other
two surviving animals (Nos. 17 and 86, Table II)
differed somewhat from that used for those shown here, they are not included in Figure 2. One was infused with hypertonic sucrose prior to treatment
with 2.5% dextrose in water. The other was infused first with 5.8% NaCl and then was given for 18 hours amounts of hypotonic solution calculated to replace insensible water losses.
WT.=2.92OKg
RATEOF INFUSION
TOTAL BODY SOLUTES 40
S NORMAL
PLASMA
mOsm/L
PLASMANa
mEq/L
CI
EXTRACELLULAR H2O
S NORMAL
INTRACELLULAR H20
S NORMAL
TIME INHOURS
Fic. 2. Changes in body composition of five rabbits rendered hypertonic with 5.8% NaCl solution and
rehydrated with different types of hypotonic solu
tions. The interrupted line is an approximation since the amount of dextrose utilized was not cal culated. Symbols have the same meaning as in
Figure 1.
the time the plasma osmolality had de creased to 330 mosm/1. The electroenceph alograms simultaneously returned to nor mal in all but one animal, subsequently found to have intracranial hemorrhage.
Largely as a result of an increase in total
body water, the concentrations in plasma of solutes, sodium and chloride decreased to or almost to normal levels. Extracellular volume increased further while intracellular volume rose towards normal levels.
At postmortem examination the brains appeared normal in four rabbits; in one there were hemorrhages in the subdural
I 14 @@@iLJ
258mOsm/Kg/Hr58.TmIH,0/Kq/Hr
I I
TOTAL BODYWATER @
RabbitSubstancePlasmaTBSTBWECWICWPlasmaClNo.Infused(mosm/l)(% NaPlasma
N*)(% N)(% @)(% N)(meq/l)(in eq/I)
TABLE II
ALTERATIONS OBSERVED IN DIFFERENT VARIABLFS AT THE HEIGHT OF HYPERTONICITY IN SURVIVING
ANIMALS (GROUP A), AND “¿ATDEATH― IN ANIMALS DYING WITH HYPERTONICITY (Gnoue B)
(Significance of the difference between the means of the values of these groups, exclusive or inclusive of urea group.)
Group A = Compatible with life (surviving animals)
17 NaC1 370 112 87 89 84 185 164
27 NaCI 391 122 91 100 84 195 167
31 NaCI 375 120 87 104 77 186 155
34 NaC1 387 127 91 126 65 183 156
37 NaCI 425 125 87 113 70 199 167
40 NaCI 404 127 92 111 78 193 164
36 Sucrose 421 95 75 92 62 118 81
iii 396 118 87.2 105 74.2 180 150.6
SI) ± 21.4 ± 11.2 ± 5.78 ± 12.85 ± 8.8 ± 27.8 ± 30.2
SE ± 8.1 ± 4.23 ± 2.18 + 4.86 ± 3.33 + 10.5 + 11.4
Group B = At death exclusiveof urea group
13 NaC1 420 125 103 133 80 177 140
14 NaCl 423 121 92 115 75 187 147
15 NaCl 487 122 89 96 85 221 177
16 NaCl 407 122 82 109 64 186 149
21 NaCl 445 121 87 107 73 195 164
22 NaCI 496 128 86 113 67 200 163
28 NaCI 487 —¿ 89 —¿ —¿ 227 203
32 NaCI 476 139 85 106 71 230 200
38 NaCl 426 128 92 119 72 184 154
39 NaCI 395 133 99 131 76 182 151
23 NaCI & NaHCO, 476 127 87 83 88 222 162
29 NaCI&NaHCO 483 152 94 130 67 230 162
19 Sucrose 486 99 77 89 69 123 80
24 Sucrose 489 108 76 113 50 123 67
41 Sucrose 428 106 82 93 74 126 92
20 Mannitol 477 121 85 129 57 103 58
iii 456 123.5 87.8 111.1 71.7 182.3 141.8
SD ± 34.4 ± 13.0 ± 7.16 ± 15.85 ± 9.8 ± 42.1 ± 44.2
SE ± 8.6 ± 3.36 ± 1.79 ± 4.10 ± 2.5 ± 10.5 ± 11.0
p values .005 .4 .5 .5 .5 .5 .5
Group B =At death includingurea group
49 Urea 547 150 95 99 91 135 88
50 Urea 536 151 92 91 9@i 136 81
rn 465.7 126.6 88.4 109.2 73.8 177.1 135.4
SD ± 42.5 ± 15.1 ± 6.5 ± 15.82 ±11.3 ± 42.4 ± 45.5
SE ± 10.0 ± 3.61 ± 1.53 ± 3.84 ± 2.74 ± 10.0 ± 10.7
p values .005 .5 .5 .5 .5 .5 .5
ARTICL1@S
other substances. Indeed, the urea-infused rabbit that attained the highest plasma osmolar concentration encountered in these studies (Figs. 1 and 3) remained symptom free.
It is known that urea diffuses readily into muscle cells and slowly into brain3133 whereas the other substances infused diffuse little, if at all, into brain34 or muscle cells. Therefore, it appeared important to explore the possibility that difference in the be havior of the urea-treated group could be explained by a difference in the effects of this solute upon the volume and composi tion of brain and muscle. Figure 4 shows that in the animals dying with hyertonicity, the water content of the muscle was de creased in all except the urea group.
By contrast, the water content of the brain decreased to a comparable and significant degree in all groups. As a result of an in crease in Na, the Na + K content in the brain was increased in all the groups and to a higher degree than in the muscles, where it was found to be normal or increased. There was no change in potassium content of the brain. The change in sodium in the brain was statistically significant and oc curred in association with a parallel in crease in chloride in the brain (Table III). This occurred not only in the NaCl and the NaG! + NaHCO3 groups where the total body content and extracellular concentra tions of sodium and chloride were elevated, but also in the sucrose and urea groups where the body content and concentrations of these substances were subnormal. As a result of these changes in water and Na + K content, the concentration values for Na
+ K in the muscle were increased in all ex cept the urea group, whereas in the brain they were increased to a comparable and significant degree in all the groups (Table IV). All these abnormalities were essentially absent in animals which were rehydrated prior to being killed and analyzed.
DISCUSSION
The data presented suggest that the neu rologic and biochemical abnormalities and space overlying the cerebral hemisphere and
in the subarachnoid space over the dorsum of the brain stem.
Comparison of the Two Groups of Animals
Means of the values obtained at the height of hypertonicity in the surviving animals (Figure 2 and accompanying text) were
compared with those obtained “¿atdeath―
in the animals of Figure 1. Table II shows that there were no statistically significant differences between the means for total body water, solutes, extracellular volume and intracellular volume and for sodium and chloride concentration in the plasma. Hence one cannot attribute death to dis turbances in any of these variables. On the other hand, the concentration of solutes in the plasma of those that died was signifi cantly higher than it was in those that sur vived. This was equally true whether or not the urea group was included with the other animals of Figure 1. This finding sug gested that hypertonicity of body fluids could be the disturbance responsible for death.
With the breakdown of cellular function after death and with impairment of cell function during life, it is known that cellular
constituents, such as phosphate, potassium
APPROXIMATE ONSET OF CLINICAL SIGNS
CUMULATIVE DEATHS S TOTAL NUMBER
OF ANIMALS
PLASMA P
mg %
PLASMA K mEq/L
50L
Trembling _________________
Twitching ______________________ Nyslogmus _________________ Alas in ______________________
Responsiveness I
L Restlessness
PLASMA mOsm/L
4
12
10 8 6
4
2
C'
—¿â€”¿â€”¿â€”¿â€”—¿â€”¿a
0
@•¿i@
6@_______a@
PLASMA pH
L@L@
300 350 400
I I I
450 500 550
PLASMA SOLUTES mOsm/L
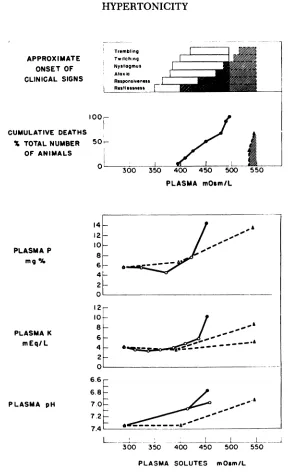
FIG. 3. Relation between certain clinical and biochemical changes and plasma tonicity. The correlations for clinical signs and death are based
on observations made on 29 and 19 rabbits, respectively. Grey shading
and solid lines are used to represent the NaC1, NaC1 plus NaHCO3 and sucrose-mannitol groups, diagonal shading and interrupted lines the three rabbitsof the urea group. The solidlinesfor potassium and phosphorus in plasma are constructedwith the means of the values obtained in 23 and 17 rabbits,respectively.The solidstraightlinefor plasma pH isthe regression line of values during life, obtained in 16 rabbits infused with 5.8% NaCl or 70% sucrose solutions; r = —¿.88,p < .001. White symbols
RABBIT
GROUPH20 gmNo mEqK mEqCI mEqNORMAL325
(301-347)7.46(6.0-I0.3)48.2(44.2-51.2)5.84 (4.5-6.9)NoCI275
(232-335)16.8(laO- 20.3)45.6(42.4- 49.8)14.75 (11.5-18.3)NoCI
+
NoHCO3256.5(256- 257)15.0(I2.9 17.1)47.2(47.I47.4)9.55 (8.8-10.2)SUCROSE252.3
(250- 256)7.72(6.2 -9.0)48.3(47.3-48.8)5.39 (4.5-6.2)UREA344.5
(304-385)7.9 (6.0 -9.7)49.3(49.3-49.4)7.4 (5.0-9.7)NoCI
SURVIVED335(302-376)14.5(8.7-I8.8)47.1(45-49.7)11.7 (7.5-I5.2)SUCROSE
SURVIVED3418.845.75.6
H20
gmNo mEqK
CI mEq
mEq37017.930
17(351-405)(15.8-21.6)(27.8-33.4) (14.8-18.8)31225.532.4
26.5(291-
342)(22.4-
26.9)(28-36.3)@(23.5-29.6)30626.832.326.6(290-322)(26.1-27.6)(31.6- 33.1)(252-28)33126.336.523.8L@327
-336)(24.4-
28)(32.4-40.8)(2I.8-25.8)30722.931.820.8(292-322)(20.8-25)(31.8)(18.7-22.9)37319.732.721.1(356-395(I5.I-25)(27.4-40.5)(15.7-26.8)363143014.2 ARTICLES
TABLE III
MEANS AND (RANGES) OF WATER, SODIUM, POTASSIUM AND CHLoRIDE CONTENT OF TISSUES OBTAINED IN
ANIMALS DYING WITH HYPERTONICITY (NaC1, NaCl PLUS NaHCO3, SUCROSE-MANNITOL, AND UREA Gnoups) AND IN ANIMALS SURVIVING HYPERTONICITY (NaCI, AND SUCROSE SURVIVING GHouls)
MUSCLE BRAIN
PER 00 gm DRYDEFATTED WEIGHT PER 100 gm DRY WEIGHT
NUMBEROF RABBITS
5
4
2
3
2
5
death occurring under conditions of hyper tonicity are not due to changes in total body water or solute content, total extracellular or intracellular volume, or concentration of sodium or chloride in the plasma. Though
gross or microscopic evidence of intracranial
hemorrhage was observed occasionally, this too seemed of minor importance to the de velopment of the clinical syndrome and was compatible with recovery. On the other hand, the correlation between plasma os molality and the clinical, electroencephalo graphic, biochemical changes and death in the NaCl, NaCl plus NaHCO3 and sucrose mannitol infused animals suggests that hy
pertonicity is an important factor. However,
the fact that one of the animals infused with urea failed to develop any clinical signs when the plasma osmolar concentration in creased to very high levels indicates that hy pertonicity is not necessarily the immediate cause of these signs.
Tissue analyses revealed that death can occur without changes in the composition
of muscle. But the fact that all the animals
dying with hypertonicity, including the urea group, had alterations of comparable de gree in the brain (Fig. 4) strongly suggests that hypertonicity of the body fluids pro duces its deletereous effects by changes in the composition of the brain, namely dehy dration and increased concentration of ions.
PER LITER 820Na@'
mEqK' mEqCl4 mEqNa@+
K'
mEq48.2
(44.2- 53.4)81.2(122.4-1413)81.7(76.4- 89)45.9(41.6-49.8)129.4
(76.9-92.1)103.5(173—198)88.1(96.1-106)85.3(78.5-102)185.2
(80.9-953)106(183.9-2042)79.6((03 - 09)86.85(86.8-86.9)194
(74.6-83.6)110.7(173.8-205)74.3(99.2-122)71.9(66.8-76.7)190.3
(71.1-77.6)103.9([email protected])52.6(98.8-109)67.6(64.1- 71.1)178.2
(42 -66.7)87.6(116.6-167.4)38.68339.2121.6(74.6-104)56.9(42.2- 73)140.2
RABBIT
GROUPNa' mEqK' mEqCl4 mEqN&'+
K'
mEqNORMAL22.9
(17.3- 30.0)148.4(127 -158)18.0(13.1-21.5)171.3 (144.3-180.1)NaCI59.0
(519—¿65.3)168.0(148-I 94)53.5(49.7- 57.3)227 (208.6-245.9)NoCI
+
NoHCO358.4(50.3-66.5)184.5(184-185)37.2(347-39.8)242.9 (234.3-251.5)SUCROSE30.6
(24.4- 36.3)191.3(189 -194)21.4(17.8-24.9)221.9 (215.4-225.3)UREA22.6
(20-25.2)145.5(128 -163)20.9((6.6-25.3)168.1 (153.2-183)NaCI
SURVIVED43.8(28.1623)142.0(124-165)34.9(24.1-45.4)185.8
(155.4-227.3)SUCROSE
SURVIVED26.1134.016.5160.1
TABLE IV
MEANS AND (RANGE.S) OF SODIUM, POTASSIUM, CHLORIDE AND SODIUM PLUS POTASSIUM PER LITER OF WATER OBTAINED IN ANIMALS DYING WITH HYPERTONICITY (NaCl, NaC1 PLUS NaHCO3, SUCROSE-MANNITOL AND
UREA GRoUps), AND IN ANIMALS SURVIVING HYPERTONICITY (NaCl AND SUCROSE SURVIVING GRouPs)
MUSCLE BRAIN
PER LITER 820
NUMBEROF
RABBITS
5
4
2
3
2
5
4) with equal degrees of hypertonicity in animals infused with NaC1, NaCl plus NaHCO3, sucrose and mannitol is in keep ing with these principles.
It has been shown that substances such as sucrose, thiocyanate, radioactive iodide and p-aminohyppurate penetrate brain tissue at barely measurable rates, indicating the pres ence of a barrier to diffusion from the vas cular system.@4 Although comparable studies for mannitol, sodium chloride and sodium bicarbonate are not available, the similarity of response to these substances suggests that, like sucrose, their entry into tissue of the central nervous system is minimal. In the case of the urea-treated rabbits, how ever, account must be taken of the fact that urea penetrates slowly into brain with complete equilibration being reached in about 12 hours.33 Consequently, to create an osmotic gradient between extracellular fluid and brain,0 the concentration of urea in the extracellular fluid must increase faster
than it increases within the brain. Thus clinical abnormalities and death occurred in the rabbits to which urea was adminis tered rapidly, but not in the rabbit given urea rather slowly (Figs. 1 and 4). More over, as a consequence of the penetration of urea into the brain, the osmolality of the extracellular fluid in the urea group had to be higher than that of the other groups to accomplish the same degree of dehydra tion of the brain (Figs. 3 and 4).
The observations also suggest that the de crease in water and increase in ion con centration of the brain result in functional impairment of the brain cell and possibly also of the “¿blood-brainbarrier.― This is manifest not only by severe neurologic and
0 Present knowledge concerning the anatomic
and physiologic features of the ‘¿blood-brainbarrier―
and extent of the extracellular space of the brain
does not permit a conclusion as to whether the
osmotic gradient is across brain cell membrane,
ARTICLES
TISSUE ANALYSIS IN 22 RABBITS
MUSCLE
NORMAL AT DEATH REHYDRATEDNORMAL
I
BRAIN
AT DEATH REHYDRATED
I
r ml/I@gm
L
No+K 3020@-—¿
mEq/IOOgm oL.
::L
electroencephalographic abnormalities, but also by the apparent entrance of sodium and chloride into brain tissue. Finberg et al.,°in kittens rendered hypernatremic by the intraperitoneal injection of 1.5 molar NaCl plus NaHCO3 solution, found chemi cal changes in brain and muscle similar to those reported here for hypernatremic rab bits. They calculated the distribution of water and electrolytes between the “¿extra cellular― and “¿intracellular―phases of brain tissue, assuming that chloride remains ex tracellulary. The results were interpreted as showing essentially no entrance of sodium into brain cells. This interpretation is open to question, since there are doubts as to the existence of an extracellular space in the brain36 and indication that chloride may normally be present in brain cells.30'@7
Na + K
mEq/L
L
MEAN OFVALUES OF
5 Rabbits in NORMALgroup x 2 Rabbits in UREA group a 4 Rabbits in NoCI group •¿ 5 Rabbits in NoCI ondH2O gp. o
2 Rabbits inNaCi + NaHCO3 gp + I Rabbit in SUCROSE and
3 Rabbits in SUCROSEgroup U H2O group 0
Fic. 4. Water content, Na + K content and concentration of the muscle and brain
obtained with normal control animals (left hand points), at death in the animals of
Figure 1 (central points), and following rehydration in the animals of Figure 2 (right hand points).All values are expressed in percent change from the normal values of the control group (x), i.e. muscle H20 325 ml, Na + K, 55.6 meq/100 gm dry de fatted weight; brain H20 370 ml, Na + K 47.9 meq/100 gm dry weight. The sums
of Na + K are taken as an index of the total ions or solutes.
Moreover, while calculations based on the same assumptions gave comparable values for the control animals of the present series, when applied to those which died with hy pertonicity, they yielded values for extra cellular water, which in two of the animals infused with sucrose, were greater than the total water of the brain. Furthermore, there was no relation between the values for ex tracellular compartment of the brain and those obtained for the extracellular com partment of the body as a whole. Thus, the results could be explained by assuming that
chloride is normally present in brain cells0
and that the increase in sodium and chloride
0 In reference to brain cells it must be recalled
936 HYPERTONICITY
reflects a breakdown in the mechanism nor mally responsible for the maintenance of a lower content of these ions in the brain.36
The occurrence of marked nystagmus, ataxia and death by respiratory failure points to the brain stem as a site of severe neuronal disturbance. The trembling and irregular twitching are less easily referable to dysfunction of a precise region of the nervous system. The electroencephalo graphic findings indicate that there is a dis turbance of cortical function, but that the irregular twitching and trembling are not the result of cortical seizure discharges. Fur ther studies will be necessary to clarify this point. Acidosis, hyperkalemia and hyper phosphatemia are other manifestations of cellular impairment,273° but whether they are related to the damage of neurones or cells elsewhere in the body can not be set tled at this time. It is noteworthy that, in accordance with the findings of other au thors,9 no change was observed in the po tassium content of the brain. However, potassium accumulated in the plasma ter minally in animals dying of hypertonicity. Calculations indicate that it would take a quantity of potassium triple or quadruple that normally contained in the brain to produce the observed increase in extracellu lar concentration of potassium. Since there was no change in potassium in the brain, the interesting possibility arises that severe functional impairment of the nervous sys tem also may result either in a general breakdown in the function of other body
cells or release of these normally intracellu
lar constituents into the extracellular com partment, specifically as a result of the vio lent muscular contraction induced by dis organized neuronal discharge.38'39
Luttrell et al.14 have presented evidence which indicates that the intracranial hemor rhages are mechanical in origin. The ab sence of intracranial hemorrhages in some of their animals treated in a similar fashion to those with hemorrhages, led them to sug gest that the rate of induction of hypertonic ity may be important. Our observations sup port this opinion, which could explain the
infrequency of intracranial hemorrhage in patients who, as a result of disease, become hypernatremic slowly.
SUMMARY AND CONCLUSIONS
Hypertonicity of the body fluids was in
duced in rabbits by the intravenous infusion of different hypertonic solutions (NaC1. NaC1 plus NaHCO3, sucrose, mannitol and urea). The results obtained in this study indicate the following.
There is no significant correlation be tween the clinical syndrome or death and values for total body water, total body sol utes, total extracellular or intracellular vol ume, or concentration of sodium or chloride in the plasma. The clinical manifestations and death can occur in the absence of in tracranial hemorrhage.
Hypertonicity, by creating an osmotic gradient between extracellular fluid and
brain, is the important factor in producing the characteristic clinical syndrome and death, but is not the immediate cause of these abnormalities. The osmolality neces sary to produce these alterations was greater in animals infused with urea.
Hypertonicity produces these altera tions by decreasing water and increasing ion
concentration in the brain. The resulting functional impairment of neurones accounts for the clinical and electroencephalographic abnormalities. The increased values of sodium and chloride in the brain reflect an impairment of function of either brain cells, “¿blood-brainbarrier,― or both. Acidosis, hy perkalemia and hyerphosphatemia ensue as a result of hypertonicity.
Unless death is imminent, all of the ab normalities described are reversible.
Acknowledgment
We wish to express our appreciation to Mrs. Helen Jones for the analysis of the tissues and to Miss Mary L. Terry and Dr. John D. Craw ford for their advice.
REFERENCES
1. Zierler, K. L.: Hyperosmolarity in adults: a critical review. J. Chronic Dis., 7:1,
1958.
937
ARTICLES
and electrolytes. Hypematremia. Metab olism, 5:508, 1956.
3. Rapoport, S.: Hyperosmolarity and hyper
electrolytemia in pathologic conditions of childhood. Am. J. Dis. Child., 74:682,
1947.
4. Finberg, L., and Harrison, H. E.: Hyper
natremiain infants:an evaluationof the clinicaland biochemical findingsac
companying this state. PEDIATRICS,16:1,
1955.
5. Skinner, A. L., and Moll, F. C.: Hy
pernatremia accompanying infant diar
rhea. Am. J. Dis. Child., 92:562, 1956.
6. Weil, W. B., and Wallace, W. M.: Hy pertonic dehydration in infancy. PEDI ATRICS, 17:171, 1956.
7. Darrow, D. C., and Welsh, J. S.: Recent
experiencein the treatmentof diarrhea in infants.J. Pediat.,56:204, 1960.
8. Winkler, A. W., Elkinton, J. R., Hopper, J., Jr., and Hoff, H. E.: Experimental hy
pertonicity: alterations in the distribu
tion of body water and the cause of
death. J. Clin. Invest., 23:103, 1944.
9. Finberg, L., Luttrell, C., and Redd, H.:
Pathogenesisof lesionsin hypernatremic states.II.Experimentalstudiesof gross anatomic changes and alterationsof
chemical composition of the tissues. PEDIATRICS, 23:46, 1959.
10. Finberg, L., and Fleishman, E.: Experi mental studies of the mechanisms pro
ducing hypocalcemia in hypernatremia
states. J. Clin. Invest., 36:434, 1957. 11. Harrison, H. E., and Finberg, L.: Hy
pernatremic dehydration. Pediat. Clin. North America, 6:193, 1959.
12. Elkinton, J. R., and Taffel, M.: Prolonged
water deprivationin the dog. J. Clin. Invest.,21:787, 1942.
13. Crawford, J. D., and Dodge, P. R.: Com plications of fluid therapy in patients with neurological disease: with special
emphasis on water intoxicationand hy
pertonic dehydration. Pediat. Clin. North America, 6:1, 1959.
14. Luttrell, C. N., Finberg, L., and Drawdy,
L. P.: Hemorrhagic encephalopathy in
duced by hypematremia. II. Experi mental observations on hyperosmolarity
in cats. Arch. Neurol., 1:153, 1959. 15. Crawford, J. D., and Nicosia, A. P.: A
method for the determination of freez ing point of small quantities of biologi cal fluids. J. Lab. & Clin. Med., 40:907, 1952.
16. Wallace, W. M., Holliday, M., Cushman,
M., and Elkinton, J. R.: The applica
tion of the internal standard flame
photometer to the analysis of biologic material. J. Lab. & Clin. Med., 37:621, 1951.
17. Wilson, D. W., and Ball, E. C.: A study
of the estimation of chloride in blood and serum. J. Biol. Chem., 79:221, 1928.
18. Zimmerman, W. J.,and Layton, W. M.,
Jr.: A polarograph micromethod for the
determinationof blood chloride.J.Biol. Chem., 181:141,1949.
19. Conway, E. J.: MicrodiffusionAnalysis
and Volumetric Error, Revised Ed. New York, Van Nostrand, 1947, p. 133. 20. Folin, 0.: The micromethod for the de
termination of blood sugar. New Eng land J. Med., 206:727, 1932.
21. Hastings, A. B., and Sendroy, J., Jr.: Studies of acidosis. XX. The colorimetric determination of blood pH at body
temperature without buffer standards.
J. Biol.Chem.,61:695,1924.
22. Fiske, C. H., and Subbarow, Y.: The colon
metric determination of phosphorus. J. Biol. Chem., 66:375, 1925.
23. Lowry, 0. H., and Hastings, A. B.: Histo chemical changes associated with age ing. I. Methods and calculations. J. Biol. Chem., 143:257, 1942.
24. Elkinton, J. R., and Danowski, T. S.: The Body Fluids. Basic Physiology and Practical Therapeutics. Baltimore, Wil liams and Wilkins, 1955, p. 83.
25. Brodsky,W. A., et a!.:The freezingpoint
depression of mammalian tissues in rela tion to the question of osmotic activity of the cell fluid. J. Gen. Physiol., 40:183, 1956.
26. Robinson, J. R.: Metabolism of intracellu lar water. Physiol. Rev., 40:112, 1960.
27. Dixon, K. C.: Anaerobic leakage of potas
sium from brain. Biochem. J., 44:187, 1949.
28. Danowski, T. S.: Transfer of potassium across human blood cell membrane. J.
Biol. Chem., 139:693, 1941.
29. Conway, E. J.: Nature and significance of concentration relations of potassium and sodium ions in skeletal muscle. Physiol. Rev., 37:84, 1957.
30. Sotos, J. F., Dodge, P. R., Meara, P., and Talbot, N. B.: Studies in experimental hypertonicity. II. Biochemical changes
as manifestationof cellularimpairment. In preparation.
31. Steffensen,K. A.: Some determinationsof
total body water in man by means of intravenous injections of urea. Acta physiol. scandinav., 13:282, 1947. 32. Wolf, A. V., and McDowell, M. E.: Ap
tion of sodium, chloride, sulfate and urea. Am. J. Physiol., 176:207, 1954. 33. Schoolar, J. C., Barlow, C. F., and Roth,
L. J.: The penetration of carbon-14 urea into cerebrospinal fluid and various areas of the cat brain. J. Neuropath. &
Exper. Neurol., 19:216, 1960.
34. Davson, H., and Spaziani, E.: The blood brain barrier and the extracellularspace of brain. J. Physiol., 149:135, 1959. 35. Darrow, D. C., and Yannet, H.: The
changes in the distribution of body
water accompanying increase and de
crease in extracellular electrolytes. J. Clin. Invest., 14:266, 1935.
36. Demsey, E. W., Luse,S.,and Discussants:
In Biology of Neuroglia, edited by Win
dle, W. F., Springfield, Thomas, 1958,
pp. 99-129.
37. Allen, J. N.: Extracellular space in the cen
tral nervous system. Arch. Neurol. & Psychiat., 73:241, 1955.
38. Van Den Dniessche, J., and Trebaul, L.: Comparaison de la pression osmotique
du serum et des concentrations seniques
en sodium et en potassium apres crises electnique et pentetrazolique chez le lapin. Therapie, 13:476, 1958.
39. Delay, J., and Soulairac, A.: Le syndrome humoral du post-electrochoc. Bull. et mém. Soc. Med. hop. Paris, 23-24:152,
1943.
MODERN PROBLEMS IN PEDIATRICS, Volume
VI: Renal Function and Kidney Disorders in Childhood,editedby A. Hottingerand H. Bergen. New York, S. Karger, 1960, 560 pp. (tn-lingual edition), $27.00.
Although one doubts that this volume “¿will further advance. . . our insight into ‘¿Kid ney Problems during Infancy,― it does pre
sent a trilingual collection of reasonably up-to
date and informative papers on some physio
logic and pathologic aspects of pediatric neph
rology. The essays are written, with one ex
ception, in the native language of various au thorities drawn from English, French and Ger
man-speaking countries. Summaries, whenever
present, are not offered in each of the three languages. Also dispensed with is the index,
based on the debatable concept that a “¿de
tailed― table of contents will suffice the in terested reader.
The omission of certain topics such as hor monal disturbances and the technique of mi crodissection seems to have been beyond the editors'control,but the role of renal enzymes in homeostasis receives little attention.
While the collection deserves space in any complete library on the kidney, the aforemen
tioned shortcomings and high cost of this
poorly bound volume probably will limit its dis tribution in the United States.
1960;26;925
Pediatrics
Juan F. Sotos, Philip R. Dodge, Patricia Meara and Nathan B. Talbot
Syndrome, Biochemical Abnormalities and Cause of Death
STUDIES IN EXPERIMENTAL HYPERTONICITY: I. Pathogenesis of the Clinical
Services
Updated Information &
http://pediatrics.aappublications.org/content/26/6/925
including high resolution figures, can be found at:
Permissions & Licensing
http://www.aappublications.org/site/misc/Permissions.xhtml
entirety can be found online at:
Information about reproducing this article in parts (figures, tables) or in its
Reprints
http://www.aappublications.org/site/misc/reprints.xhtml
1960;26;925
Pediatrics
Juan F. Sotos, Philip R. Dodge, Patricia Meara and Nathan B. Talbot
Syndrome, Biochemical Abnormalities and Cause of Death
STUDIES IN EXPERIMENTAL HYPERTONICITY: I. Pathogenesis of the Clinical
http://pediatrics.aappublications.org/content/26/6/925
the World Wide Web at:
The online version of this article, along with updated information and services, is located on
American Academy of Pediatrics. All rights reserved. Print ISSN: 1073-0397.