Quality Estimation of Speech Recognition Features for Dynamic Time
Warping Classifier
Rasa Lileikyt
ė
, Laimutis Telksnys
Recognition Process Department, Vilnius University, Institute of Mathematics and Informatics Goštauto str. 12, LT-01108 Vilnius, Lithuania
e-mail: [email protected], [email protected]
http://dx.doi.org/10.5755/j01.itc.41.2.914
Abstract. The choice of the quality features set remains the main issue for the successful speech recognition system. In the literature, quality of features is estimated by calculating the classification error. So that, it is needed to run classification process with each explored feature system in order to choose the highest quality one. Therefore, a major issue of this paper is to propose a methodology for quality establishment of speech features without running the classification process. The proposed methodology is based on metrics that do not need parameters setting, thus the results can be uniformly interpreted across the different problems. The methodology consists of the following parts: 1) establishment of the best metric in combination with used classifier, 2) making a decision regarding the highest quality feature system. In the experiment, we use Dynamic Time Warping (DTW) classifier. The metric of intra/inter class nearest neighbor distances (Q3) is identified as the best one. Employing our proposed methodology, we established Perceptual Linear Prediction analyses to be the highest quality feature system within the explored feature systems. The correctness of the results is confirmed by DTW classification error.
Keywords: speech recognition; classification; quality metric; separability; data complexity.
1. Introduction
A plenty of speech feature systems exist. The selection of the quality feature set remains the main issue for the successful speech recognition system. Therefore, the inquiry can be stated - how to choose the highest quality feature system. The concept of quality can be defined by comparing a set of inherent characteristics with a set of requirements. If these subjects are met, then high quality is achieved [13]. Accordingly, in the literature, quality of features is estimated by calculating the classification error. However, this method is limited in several aspects. First, suppose that ten kinds of feature systems are given. In order to choose the most proper feature system, the classification process has to be performed ten times. Next, usually classifiers need parameter setting. Consequently, the results can not be uniformly interpreted across the problems even for the same type of classifier in case different parameters are set.
Speech recognition technology is widely employed in various areas and a number of various speech recognition tasks are under the investigation in the literature [12, 25, 29]. A major issue of the current research is to propose a methodology for quality estimation of speech recognition feature system with the approach that doesn‘t require running the classifier. Moreover, the methodology is based on
metrics that do not need parameters setting. We will employ geometrical complexity metrics for feature quality estimation. Contrarily, recent studies of data complexity metrics have been focused on several aspects, such as identifying classifier domain of competence [2, 3], classifier performance [4, 26], classifier combination [10], prototype selection [21] and synthetic data generation [19]. The only study [21] included experiment with phonemes among other data, but phonemes results were not accented. Also, in order to validate the adequateness of the proposed method, DTW classification error was calculated.
The paper is structured as follows. Firstly, quality metrics of speech recognition features are reviewed. Next, a description of the DTW classifier is given. Then, analysis procedure is provided including data set description and formulation of quality estimation methodology. Afterwards, experimental results and discussion are given. Finally, conclusions are made.
2. Quality metrics of speech recognition features
overlapping region. The metric is calculated as the ratio of these non overlapping samples to all samples. Then, the maximum value regarding the features dimensions is considered.
Let Vdi, Vdj be not overlapping regions in the d-th
dimension of the i-th and j-th classes. Feature efficiency is defined:
N Q Q d d 1 max
1 , d 1,2,,D, (1)
where
C j i j i j d i dd V V
Q
, 1 , 1
1 , (2)
where N is the number of all samples, D is the dimension of features, C is the number of classes,
C
i1,2,, , j1,2,,C.
Length of class boundary (Q2). The metric is based on Minimum Spanning Tree (MST), [1, 6, 15, 28]. Let L
l1,l2,...,lK
be the set ofvertexes (samples) that are connected by edges (Euclidean distances) in MST and belong to different classes. The number of these samples is normalized by the number of all samples [11]:
N K
Q2 . (3)
Ratio of intra/inter class nearest neighbour distances (Q3). Firstly, Euclidean distance is calculated for each sample both to the nearest sample of the same class and to the opposite classes [2, 3, 11, 27]. Consequently, the ratio of these distances is calculated: C j i j i i N m j m i n m C i i N n i k i n k x x d x x d Q , 1 , 1 1 1 1 ) , ( min ) , ( min
3 , (4)
where min ( ni, ki)
k d x x is minimal Euclidean distance
between the xni n-th sample from the i-th class and the i
k
x k-th sample from the i-th class, min ( ni, mj)
m d x x is
minimal Euclidean distance between the xin n-th
sample of the i-th class and the xmj m-th sample of the j-th class, Ni is the number of samples in the i-th
class.
Overstep boundary (Q4). Let us suppose that every class is represented by the sphere. The radius of the sphere is defined as the distance from its center to the farthest sample of the class, where the center is the mean of the class [30]. The radius of the sphere of the
i-th class is defined:
) , (
max i ni
n
i d x
r , (5)
where d(i,xin) is Euclidean distance between i the center of the i-th class and the xin n-th sample of the
i-th class. Overstep boundary error occurs if there exists a sample of the j-th class that falls into the sphere of the i-th class:
i j n
i x r
d( , ) . (6)
Overstep boundary error rate is defined:
N C r x d Q
Q i nj i 1
1 1 ] ) , ( [ 4
, (7)
where Q[d(i,xnj)ri] is the number of samples satisfying the overstep boundary error condition (6).
Thickness of manifolds (Q5). The „balls“ are found that involve the samples of the same class with a distance smaller than threshold value ε [11, 16]:
) , ( min , j k i n k
n d x x
, (8)
where min ( , )
, j k i n k
n d x x is minimal Euclidean distance
between the xni n-th sample of the i-th class and the
j k
x k-th sample of the j-th class. The number of the „balls“ is normalized by the number of all samples:
N B
Q5 , (9)
where B is the number of the „balls“.
3. Dynamic Time Warping classifier
The Dynamic Time Warping (DTW) algorithm is based on dynamic programming and finds an optimal match between two sequences of feature vectors by expanding or contracting time axis [5].
Let assume that we are given reference pattern }
,..., ,
{a1 a2 aR
A , and test pattern T{t1,t2,...,tZ}. We useR-by-Z grid where the (i,j) point of the grid corresponds to the Euclidean distance d(ai,tj)
between samples ai and tj. The warping path Wis a
collection of grid points that aligns A and T . The
l-th point of W is defined as wl (il,jl) so we have }
,..., ,
{w1 w2 wL
W , max(R,Z)LRZ1. The time normalized distance between speech patterns A and T is defined [14]:
L l l w L T A d 1 1 min ) ,( , (10)
where L is normalization factor and is described as the size of the path. The optimal path can be found using dynamic programming algorithm by recursion formula with Itakura slope constraint:
) 1 , ( ) , 1 ( ) 1 , 1 ( min ) , ( ) , ( j i D j i D j i D j i d j i
where D(i,j) is cumulative distance of the optimal path that begins at point (1,1) and ends at (i,j). The warping path is typically subjected to the constraints: monotonicity, continuity, warping window, slope constraint, boundary conditions - for details see [20, 22].
4. Analysis procedure
We selected five metrics (described in Section 2) for the experiment. Classification difficulties are cuased by such factors as classes overlapping, boundaries complexity. Moreover, the selected set of metrics indicates the degree of classes overlapping and boundaries complexity. The experiment was made on a set of 182 two-class problems. The problems were composed from 14 sets of different phonemes representing different classes, each set consisting of 100 instances. Data were used from VDU University, VDU-TRI4 repository [24]. The most frequent Lithuanian phonemes were selected as the target for this experimental study [23]: [a], [e], [i], [j], [k], [m], [n’], [o:], [r], [r’], [s], [s’], [t], [t’] (n’, t’, s’ are soft consonants and o: is long vowel). The phonemes were extracted from the speech recordings of four speakers, including two males and two females. The sampling rate of speech corpus was 11025 Hz, 16-bits/sample, mono-channel. We centered our study on the DTW classifier as this classifier is widely used for isolated speech items recognition [17]. We employed three feature systems for the experiment: 12th order Linear Frequency Cepstral Coefficients (LFCC) [7], Perceptual Linear Prediction (PLP) [9] and Mel Frequency Cepstral Coefficients (MFCC) [8]. Our goal was to establish the highest quality feature system using the metric rather than classification error.
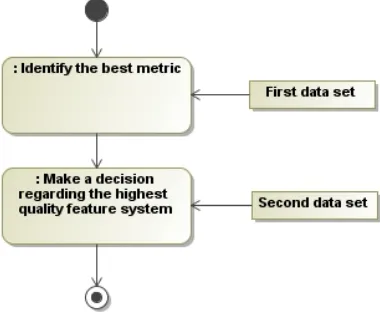
We proposed a methodology for quality estimation of speech recognition features that is based on metrics. The methodology consists of two parts: 1) establishment of the best metric in combination with the used classifier, 2) making a decision regarding the highest quality feature system (using the best metric). The general scheme of feature quality estimation is presented in Figure 1.
Figure 1. Scheme of the feature quality estimation
For each experimental part we used data sets consisting of different phonemes realizations: 1) 91 two-class combinations for the best metric identification 2) 91 two-class combinations for making a decision regarding the highest quality feature system.
The best metric identification (usingthe first data set) includes the following activities (Figure 2):
1) Calculation of metrics for classes. The metrics are calculated for classes combinations:
) , ( ) ,
( k in mj
k
nm i j x x
V , (12)
where k(xin,xmj) is the k-th metric calculated for the
i n
x n-th instance from the i-th class, and the xmj m-th
instance from the j-th class, 1nM , 1mM ,
K k
1 , 1iC , 1 jC , M100, C14, 5
K . In case of two-class combination, we got 000
10
H calculations for each metric. So having 91 two-class problems, we got 910000calculations for each metric.
2) Estimation of classes similarity using classifier. DTW distance (DTD) for instances of classes is calculated:
) , ( )
,
( in mj
nm i j DTD x x
DTD . (13)
3) Calculation of correlation between metric and
similarity result. Pearson correlation is estimated between the k-th metric and the DTW distance:
)) , ( ), , ( ( )
,
(i j PKORV i j DTD i j
KOR k nm
nm
k
. (14)
4) Choice of the best metric. The metric is chosen that gives the highest correlation with DTD of the i-th and the j-th classes:
) , ( max ) ,
(i j KOR i j
V k
k
e
. (15)
Then, percentage of the highest correlated metric is calculated. Finally, the best metric is chosen with the highest percentage.
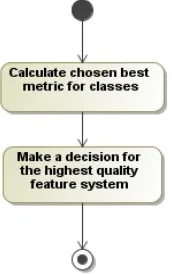
Further, making a decision regarding the highest
quality feature system involves these steps (using the second data set) (Figure 3):
1) Calculation of chosen metric for classes. We calculate the average of the chosen metric obtained for the pairs of classes:
H j i V j
i MV
M
n M
m b nm
1 1
) , ( )
,
( , (16)
where Vnmb is the best metric calculated for n-th
instance from the i-th class and the m-th instance from the j-th class, H is the number of instances combination.
2) Making a decision for the highest quality
feature system. The quality feature system of the i-th and the j-th classes with the lowest MV value is chosen, as the low measure indicates good separability of classes. Finally, the highest quality feature system with the highest percentage is determined.
Furthermore, to validate the correctness of the proposed methodology, DTW classification error is estimated for LFCC, MFCC, PLP analyses using defined pairs of classes. Then the average of classification error (taking into account the number of class pairs) is calculated. The highest quality feature system with the lowest average classification error is established. Further we will call average error as classification error.
Figure 3. Scheme of decision making regarding the highest quality feature system
5. Experimental results and discussion
First of all we examine the results of the best
metric establishment performed for the first data set. In Table 1, distributions of correlation between metric and DTW distance are displayed. In 95,60 % of all PLP cases, Q3 gave the best result out of 5 investigated metrics. In the same way, Q3 took 94,51 % for LFCC cases and 93,40 % for MFCC, respectively. Consequently, Q3 was established as the best metric. In fact, this result confirmed the result of our previous study [18] where experiment was performed with the smaller data set and Q3 was established as the best metric.
Table 1. Identifier of the best metric calculated by correlation between metric and DTW distance
Feature
system Q1 Q2 Q3 Q4 Q5
PLP 0 % 4,40% 95,60 % 0 % 0 % LFCC 0% 0 % 94,51 % 5,49 % 0 % MFCC 0% 0 % 93,40 % 6,60 % 0 %
Further, we investigate the results of making a
decision regarding the highest quality feature system
for the second data set. In Table 2, we observe that Q3 achieves the highest quality identifier of 63,74 % for PLP feature system. Then, 36,26 % is estimated for LFCC, and 0 % for MFCC feature system. As a result, using the proposed methodology, PLP is established as the highest quality feature system.
Table 2. Quality identifier of feature system calculated by metric Q3
No. Feature system Quality identifier of feature system
1. PLP 63,74 %
2. LFCC 36,26 %
3. MFCC 0 %
In Table 3, we provide DTW classification error of each explored feature system. Consequently, PLP is established as the highest quality feature system because of the lowest 3,53% classification error. LFCC is identified as the second quality system with 5,70%classification error, and MFCC as the last one with 9,01%.
Table 3. DTW classification error
No. Feature system DTW error
1. PLP 3,53 %
2. LFCC 5,70 %
3. MFCC 9,01 %
A remarkable conformity here is that the results of Q3 agreed with the results of DTW classification error. In both cases PLP is established as the highest quality feature system, LFCC is the second and MFCC is the last one.
6. Conclusions and future work
The paper attributes to the issue of methodology for quality estimation of speech recognition features. We provide a methodology that doesn’t require classification process running and enables to estimate the quality of speech recognition features. Moreover, a methodology is based on metrics that do not need parameter setting, so that results can be uniformly interpreted across the different problems.
with used classifier, 2) making a decision regarding the highest quality feature system using the best metric.
We examined a set of five metrics. During the experiment we analyzed PLP, LFCC and MFCC feature systems. The experiment was made using 14 sets of different phonemes, within 182 two-class combinations. The study was centered on DTW classifier. Our goal was to discover which feature system has the highest quality by employing the proposed methodology.
With the result of experiment, metric Q3 was identified as the best one. The metric identifies ratio of intra-class to inter-class nearest neighbour distances. Particularly, we employed Q3 to determine the highest quality feature system. Accordingly, using our proposed methodology, PLP was established as the highest quality feature system. Moreover, to confirm the correctness of the methodology, DTW classification error was estimated for explored feature systems. The lowest DTW error was established for PLP feature system. Thus, the results of Q3 agreed with the results of DTW classification error, as in both cases PLP was identified as the highest quality feature system. Consequently, the experiment confirmed the correctness of the proposed methodology.
References
[1] N. Ai-Bing, M. Liang, X. Xiao-Hua. Solving degree -constrained minimum spannig tree with a new algorithm. Proceedings of 2007 International
Conference on Management Science and Engineering (14th), 2007, 381-386.
[2] E. Bernad´o Mansilla, T. K. Ho. On Classifier Domains of Competence. Proceedings of the 17th
International Conference on Pattern Recognition,
2004, Vol. 1,136-139. http://dx.doi.org/10.1109/ICPR. 2004.1334026.
[3] E. Bernadó-Mansilla, T. K. Ho. Domain of competence of XCS classifier system in complexity measurement space. IEEE Transactions on Evolutionary Computation, 2005, Vol. 9(1), 82-104. http://dx.doi.org/10.1109/TEVC.2004.840153. [4] E. Bernad´o-Mansilla, T. K. Ho, A. Orriols. Data
Complexity and Evolutionary Learning. Data
Complexity in Pattern Recognition, Springer, 2006, 115-134. http://dx.doi.org/10.1007/978-1-84628-172-3_6.
[5] D. J. Berndt, J. Clifford. D. J. Berndt, J. Clifford. Using dynamic time warping to find patterns in time series. AAAI-94 Workshop on Knowledge Discovery in
Databases (KDD-94), 1994, 359-370.
[6] R. Campos, M. Ricardo. A fast algorithm for computing minimum routing cost spanning trees.
Computer Networks: The International Journal of Computer and Telecommunications Networking, 2008, Vol. 52(17), 3229-3247.
[7] S. Furui. Digital Speech Processing, Synthesis, and Recognition. Second edition, Revised and Expanded.
Signal Processing and Communications, 2001, 452 p. [8] W. Han, C. F. Chan, C. S. Choy, K. P. Pun. An
Efficient MFCC Extraction Method in Speech
Recognition. IEEE International Symposium on Circuits and Systems. ISCAS 2006. Proceedings, 2006, 145–148.
[9] H. Hermansky. Perceptual linear predictive (PLP) analysis of speech. Journal of Acoustical Society of
America, 1990, 87(4), 1738–1752. http://dx.doi.org/1 0.1121/1.399423.
[10] T. K. Ho. Data complexity analysis for classifier combination. Springer-Verlag, Berlin, Multiple
classifier systems, 2001,Vol.2096(2001), 53-67. [11] T. K. Ho, M. Basu. Complexity measures of
supervised classification problems. IEEE Transactions
on Pattern Analysis and Machine Intelligence, 2002, Vol. 24(3), 289-300. http://dx.doi.org/10.1109/34.99 0132.
[12] M. Itani, Š. Paulikas. Influence of languages on CELP codecs performance. Information Technology
and Control, 2008,Vol. 37(2), 141-144.
[13] ISO 9000, 9001, and 9004 Quality Management Definitions. Available at: http://www.praxiom.com/ iso-definition.htm.
[14] E. J. Keogh, M. J. Pazzani. Scaling up dynamic time warping for datamining applications. KDD ‘00
Proceedings of the sixth ACM SIGKDD international conference on Knowledge discovery and data mining, 2000, 285-289.
[15] J. B. Kruskal. On the shortest spanning subtree of a graph and the traveling salesman problem.
Proceedings of the American Mathematical Society, 1956, Vol. 7, 48-50. http://dx.doi.org/10.1090/S0002-9939-1956-0078686-7.
[16] F. Lebourgeois, H. Emptoz. Pretopological approach for supervised learning. Proceedings of the Thirteenth
International Conference on Pattern Recognition,
1996, 256-260.
[17] S. Li. An isolated word recognition system based on DSP and improved dynamic time warping algorithm.
IEEE International Conference on Progress in Informatics and Computing, 2010, Vol. 1, 136-139. [18] R. Lileikytė, L. Telksnys. Quality Estimation
Methodology of Speech Recognition Features.
Electronics and Electrical Engineering, Kaunas: Technologija, 2011, No. 4(110), 113-116.
[19] N. Macia, E. Bernado-Mansilla, A. Orriols-Puig. Preliminary approach on synthetic data sets generation based on class separability measure. IEEE International Conference on Pattern Recognition,
2008, 1-4. http://dx.doi.org/10.1109/ICPR.2008.4761 770.
[20] C. Myers, L. Rabiner, A. Rosenberg. Performance tradeoffs in dynamic time warping algorithms for isolated word recognition. IEEE Transactions on
Acoustics, Speech and Signal Processing, 1980, Vol. 28(6), 623-625. http://dx.doi.org/10.1109/TASS P.1980.1163491.
[21] R. A. Mollineda, J. S Sánchez, J. M. Sotoca. Data Characterization for Effective Prototype Selection.
First edition of the Iberian Conference on Pattern Recognition and Image Analysis (IbPRIA 2005). Lecture Notes in Computer Science 3523, Springer-Verlag, 2005, Vol 3523(2005), 27-34.
26(6), 575-582. http://dx.doi.org/10.1109/TASSP.197 8.1163164.
[23] G. Raškinis, A. Kazlauskienė. Phone frequency in standard Lithuanian. Respectus philologicus, 2009, Nr. 16 (21), 169-182.
[24] A. Raškinis, G. Raškinis, A. Kazlauskienė. Universal Annotated VDU Lithuanian Speech Corpus.
Proceedings of the conference “Information Technologies2003”, KTU, Kaunas, 2003, IX 28-34. [25] M. Sigmund, P. Zelinka. Analysis of voiced speech
excitation due to alcohol intoxication. Information
Technology and Control, 2011, Vol. 40(2), 145-150. http://dx.doi.org/10.5755/j01.itc.40.2.429.
[26] S. Singh. Multiresolution Estimates of Classification Complexity. IEEE Transactions on Pattern Analysis
and Machine Intelligence, 2003, Vol. 25(12), 1534-1539. http://dx.doi.org/10.1109/TPAMI.2003.1251146. [27] J. M. Sotoca, J. S. Sanchez, R. A. Mollineda. A
review of data complexity measures and their applicability to pattern classification problems. Actas
del III Taller Nacional de Mineria de Datos y Aprendizaje. TAMIDA, 2005, 77-83.
[28] X. Xiao-Hua, N. Ai-Bing, M. Liang. A new Verification Algorithm for Minimum Spanning Tree based on Reduction and Merge Technology.
Proceedings of 2009 4th International Conference on
Computer Science & Education, 2009, 469-473. [29] P. Zelinka, M. Sigmund. Hierarchical classification
tree modeling of nonstationary noise for robust speech recognition. Information Technology and Control, 2010, Vol. 39(3), 202-210.
[30] L. Zhou, D. Fang. The research on speech feature representation method and distance measure method.
Pattern recognition, 9th International Conference , 1998, Vol. 1, 631-633.