V
OLUMEN
O.
9
(2019),
I
SSUEN
O.
05
(M
AY)
ISSN
2231-5756
A Monthly Double-Blind Peer Reviewed (Refereed/Juried) Open Access International e-Journal - Included in the International Serial Directories
Indexed & Listed at:
Ulrich's Periodicals Directory ©, ProQuest, U.S.A., EBSCO Publishing, U.S.A., Cabell’s Directories of Publishing Opportunities, U.S.A., Google Scholar, Indian Citation Index (ICI), J-Gage, India [link of the same is duly available at Inflibnet of University Grants Commission (U.G.C.)],
Index Copernicus Publishers Panel, Poland with IC Value of 5.09 (2012) & number of libraries all around the world.
V
OLUMEN
O.
9
(2019),
I
SSUEN
O.
05
(M
AY)
ISSN
2231-5756
CONTENTS
Sr.
No.
TITLE & NAME OF THE AUTHOR (S)
Page
No.
1
.
JOB SATISFACTION, JOB STRESS & PROFESSIONAL DEVELOPMENT
AMONG COLLEGE TEACHERS: A STUDY WITH REFERENCE TO
GOVERNMENT COLLEGES IN SHIMOGGA REGION
KARIBASAPPA T & Dr. LAXMANA P
1
2
.
AN ANALYTICAL STUDY OF CUSTOMER’S BUYING BEHAVIOUR
TOWARDS LIFE INSURANCE PRODUCTS
Dr. ANIL CHANDHOK & Dr. BHAVET
5
3
.
A STUDY ON THE VARIOUS PRODUCTS, SERVICES AND PERCEPTION
OF POLICY HOLDERS OFFERED BY LIC FOCUSING ON NILAMBUR
BRANCH OF MALAPPURAM DISTRICT
FEBINA. K (KALLIDUMBAN)
9
4
.
DEMONETIZATION AND ITS IMPACT ON MSME SECTOR IN INDIA
ARAVINDA M.N. & Dr. HIRIYAPPA B.
12
5
.
EFFECTIVENESS OF EMPLOYEE WELFARE FACILITIES AT PRIVATE
CHEMICALS ORGANIZATION
KINJAL GOVINDBHAI PARMAR & NIMISHA JARIWALA
19
V
OLUMEN
O.
9
(2019),
I
SSUEN
O.
05
(M
AY)
ISSN
2231-5756
FOUNDER PATRON
Late Sh. RAM BHAJAN AGGARWAL
Former State Minister for Home & Tourism, Government of Haryana
Former Vice-President, Dadri Education Society, Charkhi Dadri
Former President, Chinar Syntex Ltd. (Textile Mills), Bhiwani
CO-ORDINATOR
Dr. BHAVET
Former Faculty, Shree Ram Institute of Engineering & Technology, Urjani
ADVISOR
Prof. S. L. MAHANDRU
Principal (Retd.), Maharaja Agrasen College, Jagadhri
EDITOR
Dr. PARVEEN KUMAR
Professor, Department of Computer Science, NIMS University, Jaipur
CO-EDITOR
Dr. A. SASI KUMAR
Professor, Vels Institute of Science, Technology & Advanced Studies (Deemed to be University), Pallavaram
EDITORIAL ADVISORY BOARD
Dr. S. P. TIWARI
Head, Department of Economics & Rural Development, Dr. Ram Manohar Lohia Avadh University, Faizabad
Dr. CHRISTIAN EHIOBUCHE
Professor of Global Business/Management, Larry L Luing School of Business, Berkeley College, USA
Dr. SIKANDER KUMAR
Vice Chancellor, Himachal Pradesh University, Shimla, Himachal Pradesh
Dr. JOSÉ G. VARGAS-HERNÁNDEZ
Research Professor, University Center for Economic & Managerial Sciences, University of Guadalajara,
Guadala-jara, Mexico
Dr. TEGUH WIDODO
Dean, Faculty of Applied Science, Telkom University, Bandung Technoplex, Jl. Telekomunikasi, Indonesia
Dr. M. S. SENAM RAJU
Professor, School of Management Studies, I.G.N.O.U., New Delhi
Dr. A SAJEEVAN RAO
Professor & Director, Accurate Institute of Advanced Management, Greater Noida
Dr. D. S. CHAUBEY
Professor & Dean (Research & Studies), Uttaranchal University, Dehradun
Dr. CLIFFORD OBIYO OFURUM
Professor of Accounting & Finance, Faculty of Management Sciences, University of Port Harcourt, Nigeria
Dr. KAUP MOHAMED
Dean & Managing Director, London American City College/ICBEST, United Arab Emirates
Dr. VIRENDRA KUMAR SHRIVASTAVA
Director, Asia Pacific Institute of Information Technology, Panipat
Dr. MIKE AMUHAYA IRAVO
Principal, Jomo Kenyatta University of Agriculture & Tech., Westlands Campus, Nairobi-Kenya
Dr. SYED TABASSUM SULTANA
Principal, Matrusri Institute of Post Graduate Studies, Hyderabad
Dr. BOYINA RUPINI
Director, School of ITS, Indira Gandhi National Open University, New Delhi
Dr. NEPOMUCENO TIU
V
OLUMEN
O.
9
(2019),
I
SSUEN
O.
05
(M
AY)
ISSN
2231-5756
Dr. SANJIV MITTAL
Professor & Dean, University School of Management Studies, GGS Indraprastha University, Delhi
Dr. RAJENDER GUPTA
Convener, Board of Studies in Economics, University of Jammu, Jammu
Dr. SHIB SHANKAR ROY
Professor, Department of Marketing, University of Rajshahi, Rajshahi, Bangladesh
Dr. SRINIVAS MADISHETTI
Professor, School of Business, Mzumbe University, Tanzania
Dr. NAWAB ALI KHAN
Professor & Dean, Faculty of Commerce, Aligarh Muslim University, Aligarh, U.P.
MUDENDA COLLINS
Head, Operations & Supply Chain, School of Business, The Copperbelt University, Zambia
Dr. EGWAKHE A. JOHNSON
Professor & Director, Babcock Centre for Executive Development, Babcock University, Nigeria
Dr. A. SURYANARAYANA
Professor, Department of Business Management, Osmania University, Hyderabad
P. SARVAHARANA
Asst. Registrar, Indian Institute of Technology (IIT), Madras
Dr. MURAT DARÇIN
Associate Dean, Gendarmerie and Coast Guard Academy, Ankara, Turkey
Dr. ABHAY BANSAL
Head, Department of Information Technology, Amity School of Engg. & Tech., Amity University, Noida
Dr. YOUNOS VAKIL ALROAIA
Head of International Center, DOS in Management, Semnan Branch, Islamic Azad University, Semnan, Iran
WILLIAM NKOMO
Asst. Head of the Department, Faculty of Computing, Botho University, Francistown, Botswana
Dr. JAYASHREE SHANTARAM PATIL (DAKE)
Faculty in Economics, KPB Hinduja College of Commerce, Mumbai
SHASHI KHURANA
Associate Professor, S. M. S. Khalsa Lubana Girls College, Barara, Ambala
Dr. SEOW TA WEEA
Associate Professor, Universiti Tun Hussein Onn Malaysia, Parit Raja, Malaysia
Dr. OKAN VELI ŞAFAKLI
Professor & Dean, European University of Lefke, Lefke, Cyprus
Dr. MOHENDER KUMAR GUPTA
Associate Professor, Government College, Hodal
Dr. BORIS MILOVIC
Associate Professor, Faculty of Sport, Union Nikola Tesla University, Belgrade, Serbia
Dr. LALIT KUMAR
Course Director, Faculty of Financial Management, Haryana Institute of Public Administration, Gurugram
Dr. MOHAMMAD TALHA
Associate Professor, Department of Accounting & MIS, College of Industrial Management, King Fahd University
of Petroleum & Minerals, Dhahran, Saudi Arabia
Dr. V. SELVAM
Associate Professor, SSL, VIT University, Vellore
Dr. IQBAL THONSE HAWALDAR
Associate Professor, College of Business Administration, Kingdom University, Bahrain
Dr. PARDEEP AHLAWAT
Associate Professor, Institute of Management Studies & Research, Maharshi Dayanand University, Rohtak
Dr. ALEXANDER MOSESOV
V
OLUMEN
O.
9
(2019),
I
SSUEN
O.
05
(M
AY)
ISSN
2231-5756
Dr. ASHOK KUMAR CHAUHAN
Reader, Department of Economics, Kurukshetra University, Kurukshetra
Dr. BHAVET
Former Faculty, Shree Ram Institute of Engineering & Technology, Urjani
YU-BING WANG
Faculty, department of Marketing, Feng Chia University, Taichung, Taiwan
SURJEET SINGH
Faculty, Department of Computer Science, G. M. N. (P.G.) College, Ambala Cantt.
Dr. TITUS AMODU UMORU
Professor, Kwara State University, Kwara State, Nigeria
Dr. RAJESH MODI
Faculty, Yanbu Industrial College, Kingdom of Saudi Arabia
Dr. SAMBHAVNA
Faculty, I.I.T.M., Delhi
Dr. THAMPOE MANAGALESWARAN
Faculty, Vavuniya Campus, University of Jaffna, Sri Lanka
Dr. SHIVAKUMAR DEENE
Faculty, Dept. of Commerce, School of Business Studies, Central University of Karnataka, Gulbarga
SURAJ GAUDEL
BBA Program Coordinator, LA GRANDEE International College, Simalchaur - 8, Pokhara, Nepal
FORMER TECHNICAL ADVISOR
AMITA
FINANCIAL ADVISORS
DICKEN GOYAL
Advocate & Tax Adviser, Panchkula
NEENA
Investment Consultant, Chambaghat, Solan, Himachal Pradesh
LEGAL ADVISORS
JITENDER S. CHAHAL
Advocate, Punjab & Haryana High Court, Chandigarh U.T.
CHANDER BHUSHAN SHARMA
Advocate & Consultant, District Courts, Yamunanagar at Jagadhri
SUPERINTENDENT
V
OLUMEN
O.
9
(2019),
I
SSUEN
O.
05
(M
AY)
ISSN
2231-5756
CALL FOR MANUSCRIPTS
We invite unpublished novel, original, empirical and high quality research work pertaining to the recent developments & practices in the areas of Com-puter Science & Applications; Commerce; Business; Finance; Marketing; Human Resource Management; General Management; Banking; Economics; Tourism Administration & Management; Education; Law; Library & Information Science; Defence & Strategic Studies; Electronic Science; Corporate Gov-ernance; Industrial Relations; and emerging paradigms in allied subjects like Accounting; Accounting Information Systems; Accounting Theory & Practice; Auditing; Behavioral Accounting; Behavioral Economics; Corporate Finance; Cost Accounting; Econometrics; Economic Development; Economic History; Financial Institutions & Markets; Financial Services; Fiscal Policy; Government & Non Profit Accounting; Industrial Organization; International Economics & Trade; International Finance; Macro Economics; Micro Economics; Rural Economics; Co-operation; Demography: Development Planning; Development Studies; Applied Economics; Development Economics; Business Economics; Monetary Policy; Public Policy Economics; Real Estate; Regional Economics; Political Science; Continuing Education; Labour Welfare; Philosophy; Psychology; Sociology; Tax Accounting; Advertising & Promotion Management; Management Information Systems (MIS); Business Law; Public Responsibility & Ethics; Communication; Direct Marketing; E-Commerce; Global Business; Health Care Administration; Labour Relations & Human Resource Management; Marketing Research; Marketing Theory & Applications; Non-Profit Or-ganizations; Office Administration/Management; Operations Research/Statistics; Organizational Behavior & Theory; Organizational Development; Pro-duction/Operations; International Relations; Human Rights & Duties; Public Administration; Population Studies; Purchasing/Materials Management; Re-tailing; Sales/Selling; Services; Small Business Entrepreneurship; Strategic Management Policy; Technology/Innovation; Tourism & Hospitality; Transpor-tation Distribution; Algorithms; Artificial Intelligence; Compilers & Translation; Computer Aided Design (CAD); Computer Aided Manufacturing; Computer Graphics; Computer Organization & Architecture; Database Structures & Systems; Discrete Structures; Internet; Management Information Systems; Mod-eling & Simulation; Neural Systems/Neural Networks; Numerical Analysis/Scientific Computing; Object Oriented Programming; Operating Systems; Pro-gramming Languages; Robotics; Symbolic & Formal Logic; Web Design and emerging paradigms in allied subjects.
Anybody can submit the soft copy of unpublished novel; original; empirical and high quality research work/manuscriptanytime in M.S. Word format
after preparing the same as per our GUIDELINES FOR SUBMISSION; at our email address i.e. [email protected] or online by clicking the link online
submission as given on our website (FOR ONLINE SUBMISSION, CLICK HERE).
GUIDELINES FOR SUBMISSION OF MANUSCRIPT
1. COVERING LETTER FOR SUBMISSION:
DATED: _____________
THE EDITOR
IJRCM
Subject: SUBMISSION OF MANUSCRIPT IN THE AREA OF______________________________________________________________.
(e.g. Finance/Mkt./HRM/General Mgt./Engineering/Economics/Computer/IT/ Education/Psychology/Law/Math/other, please specify)
DEAR SIR/MADAM
Please find my submission of manuscript titled ‘___________________________________________’ for likely publication in one of your journals.
I hereby affirm that the contents of this manuscript are original. Furthermore, it has neither been published anywhere in any language fully or partly, nor it is under review for publication elsewhere.
I affirm that all the co-authors of this manuscript have seen the submitted version of the manuscript and have agreed to inclusion of their names as co-authors.
Also, if my/our manuscript is accepted, I agree to comply with the formalities as given on the website of the journal. The Journal has discretion to publish our contribution in any of its journals.
NAME OF CORRESPONDING AUTHOR :
Designation/Post* :
Institution/College/University with full address & Pin Code :
Residential address with Pin Code :
Mobile Number (s) with country ISD code :
Is WhatsApp or Viber active on your above noted Mobile Number (Yes/No) :
Landline Number (s) with country ISD code :
E-mail Address :
Alternate E-mail Address :
Nationality :
* i.e. Alumnus (Male Alumni), Alumna (Female Alumni), Student, Research Scholar (M. Phil), Research Scholar (Ph. D.), JRF, Research Assistant, Assistant
Lecturer, Lecturer, Senior Lecturer, Junior Assistant Professor, Assistant Professor, Senior Assistant Professor, Co-ordinator, Reader, Associate
Profes-sor, ProfesProfes-sor, Head, Vice-Principal, Dy. Director, Principal, Director, Dean, President, Vice Chancellor, Industry Designation etc. The qualification of
V
OLUMEN
O.
9
(2019),
I
SSUEN
O.
05
(M
AY)
ISSN
2231-5756
NOTES:a) The whole manuscript has to be in ONE MS WORD FILE only, which will start from the covering letter, inside the manuscript. pdf. version is liable to be rejected without any consideration.
b) The sender is required to mention the following in the SUBJECT COLUMNof the mail:
New Manuscript for Review in the area of (e.g. Finance/Marketing/HRM/General Mgt./Engineering/Economics/Computer/IT/ Education/Psychology/Law/Math/other, please specify)
c) There is no need to give any text in the body of the mail, except the cases where the author wishes to give any specific message w.r.t. to the manuscript.
d) The total size of the file containing the manuscript is expected to be below 1000 KB.
e) Only the Abstract will not be considered for review and the author is required to submit the complete manuscript in the first instance.
f) The journal gives acknowledgement w.r.t. the receipt of every email within twenty-four hours and in case of non-receipt of acknowledgment from the journal, w.r.t. the submission of the manuscript, within two days of its submission, the corresponding author is required to demand for the same by sending a separate mail to the journal.
g) The author (s) name or details should not appear anywhere on the body of the manuscript, except on the covering letter and the cover page of the manuscript, in the manner as mentioned in the guidelines.
2. MANUSCRIPT TITLE: The title of the paper should be typed in bold letters, centeredand fully capitalised.
3. AUTHOR NAME (S) & AFFILIATIONS: Author (s) name, designation, affiliation (s), address, mobile/landline number (s), and email/al-ternate email address should be given underneath the title.
4. ACKNOWLEDGMENTS: Acknowledgements can be given to reviewers, guides, funding institutions, etc., if any.
5. ABSTRACT: Abstract should be in fully Italic printing, ranging between 150 to 300 words. The abstract must be informative and eluci-dating the background, aims, methods, results & conclusion in a SINGLE PARA. Abbreviations must be mentioned in full.
6. KEYWORDS: Abstract must be followed by a list of keywords, subject to the maximum of five. These should be arranged in alphabetic order separated by commas and full stop at the end. All words of the keywords, including the first one should be in small letters, except special words e.g. name of the Countries, abbreviations etc.
7. JEL CODE: Provide the appropriate Journal of Economic Literature Classification System code (s). JEL codes are available at www.aea-web.org/econlit/jelCodes.php. However, mentioning of JEL Code is not mandatory.
8. MANUSCRIPT: Manuscript must be in BRITISH ENGLISH prepared on a standard A4 size PORTRAIT SETTING PAPER. It should be free from any errors i.e. grammatical, spelling or punctuation. It must be thoroughly edited at your end.
9. HEADINGS: All the headings must be bold-faced, aligned left and fully capitalised. Leave a blank line before each heading. 10. SUB-HEADINGS: All the sub-headings must be bold-faced, aligned left and fully capitalised.
11. MAIN TEXT:
THE MAIN TEXT SHOULD FOLLOW THE FOLLOWING SEQUENCE: INTRODUCTION
REVIEW OF LITERATURE
NEED/IMPORTANCE OF THE STUDY STATEMENT OF THE PROBLEM OBJECTIVES
HYPOTHESIS (ES)
RESEARCH METHODOLOGY RESULTS & DISCUSSION FINDINGS
RECOMMENDATIONS/SUGGESTIONS CONCLUSIONS
LIMITATIONS
SCOPE FOR FURTHER RESEARCH REFERENCES
APPENDIX/ANNEXURE
V
OLUMEN
O.
9
(2019),
I
SSUEN
O.
05
(M
AY)
ISSN
2231-5756
12. FIGURES & TABLES: These should be simple, crystal CLEAR, centered, separately numbered & self-explained, and the titles must be above the table/figure. Sources of data should be mentioned below the table/figure. It should be ensured that the tables/figures are referred to from the main text.
13. EQUATIONS/FORMULAE: These should be consecutively numbered in parenthesis, left aligned with equation/formulae number placed at the right. The equation editor provided with standard versions of Microsoft Word may be utilised. If any other equation editor is utilised, author must confirm that these equations may be viewed and edited in versions of Microsoft Office that does not have the editor.
14. ACRONYMS: These should not be used in the abstract. The use of acronyms is elsewhere is acceptable. Acronyms should be defined on its first use in each section e.g. Reserve Bank of India (RBI). Acronyms should be redefined on first use in subsequent sections.
15. REFERENCES: The list of all references should be alphabetically arranged. The author (s) should mention only the actually utilised references in the preparation of manuscript and they may follow Harvard Style of Referencing. Also check to ensure that everything that you are including in the reference section is duly cited in the paper. The author (s) are supposed to follow the references as per the following:
All works cited in the text (including sources for tables and figures) should be listed alphabetically.
Use (ed.) for one editor, and (ed.s) for multiple editors.
When listing two or more works by one author, use --- (20xx), such as after Kohl (1997), use --- (2001), etc., in chronologically ascending order.
Indicate (opening and closing) page numbers for articles in journals and for chapters in books.
The title of books and journals should be in italic printing. Double quotation marks are used for titles of journal articles, book chapters, dissertations, reports, working papers, unpublished material, etc.
For titles in a language other than English, provide an English translation in parenthesis.
Headers, footers, endnotes and footnotes should not be used in the document. However, you can mention short notes to elucidate some specific point, which may be placed in number orders before the references.
PLEASE USE THE FOLLOWING FOR STYLE AND PUNCTUATION IN REFERENCES:
BOOKS
Bowersox, Donald J., Closs, David J., (1996), "Logistical Management." Tata McGraw, Hill, New Delhi.
Hunker, H.L. and A.J. Wright (1963), "Factors of Industrial Location in Ohio" Ohio State University, Nigeria. CONTRIBUTIONS TO BOOKS
Sharma T., Kwatra, G. (2008) Effectiveness of Social Advertising: A Study of Selected Campaigns, Corporate Social Responsibility, Edited by David Crowther & Nicholas Capaldi, Ashgate Research Companion to Corporate Social Responsibility, Chapter 15, pp 287-303. JOURNAL AND OTHER ARTICLES
Schemenner, R.W., Huber, J.C. and Cook, R.L. (1987), "Geographic Differences and the Location of New Manufacturing Facilities," Jour-nal of Urban Economics, Vol. 21, No. 1, pp. 83-104.
CONFERENCE PAPERS
Garg, Sambhav (2011): "Business Ethics" Paper presented at the Annual International Conference for the All India Management Asso-ciation, New Delhi, India, 19–23
UNPUBLISHED DISSERTATIONS
Kumar S. (2011): "Customer Value: A Comparative Study of Rural and Urban Customers," Thesis, Kurukshetra University, Kurukshetra.
ONLINE RESOURCES
Always indicate the date that the source was accessed, as online resources are frequently updated or removed.
WEBSITES
V
OLUMEN
O.
9
(2019),
I
SSUEN
O.
05
(M
AY)
ISSN
2231-5756
JOB SATISFACTION, JOB STRESS & PROFESSIONAL DEVELOPMENT AMONG COLLEGE TEACHERS: A STUDY
WITH REFERENCE TO GOVERNMENT COLLEGES IN SHIMOGGA REGION
KARIBASAPPA T
ASST. PROFESSOR & RESEARCH SCHOLAR
DEPARTMENT OF STUDIES & RESEARCH IN COMMERCE
DAVANGERE UNIVERSITY
DAVANGERE
Dr. LAXMANA P
CHAIRMAN, DEAN & RESEARCH SUPERVISOR
DEPARTMENT OF STUDIES & RESEARCH IN COMMERCE
DAVANGERE UNIVERSITY
DAVANGERE
ABSTRACT
In the present scenario Job stress is becoming the harmful physically, mentally and emotionally. Stress happening due to mismatch between the capabilities, re-sources or needs of the worker. Job stress spoils health and work. It reduces concentration and efficiency of the employee. Job stress reduces satisfaction towards job and the development will be reduced. Present research related to the college teachers in Government colleges in Shimogga Region, Karnataka. This paper tries to identify the factors related to stress and the professional development.
KEYWORDS
Shimogga region, job satisfaction, job stress, professional development, government colleges.
JEL CODES
J28, J29.
1.
INTRODUCTION
owadays in Colleges stress is increasing due to a lot of factors i.e Internal, external and family problems. Internal factors may be coordination between employees, subordinates and superiors as one side and the students. External may be changing rules and regulations, standards of the education system. New UGC rules may not be digestible by the traditional teachers. Teacher may be bored due to teaching of the same topics from years together, they might have lost interest after taking job, promotion policies or for not spending time with family.
2.
LITERATURE REVIEW
Chaudhry (2012) explored the level of occupational stress among university teachers based on age, gender and type of organization. Analysis reported no signifi-cant differences in the level of male and female faculty as well as public and private sectors universities. The results indicated signifisignifi-cant difference in the faculty members having different age groups regarding their perceived level of stress. Further results showed the decreasing trend of stress with the increasing of age among the faculty members.
Bano and Jha (2012) explored the differences in job-related stress between public and private sector employees, based on ten role stressors. The role of demo-graphic variables on the stress levels of both public and private sector groups was also examined. Responses of 182 public and 120 private sector employees in Uttar Pradesh (India) were obtained on occupational role stress scale. It is found that both public and private sector employees face moderate levels of stress. The results also indicated no significant difference between public and private sector employees in terms of total stress levels.
Surapuramath (2012) examined the organizational climate of colleges of education under Karnataka University. Significant difference in organizational climate of government colleges and private colleges of education was observed. Study results indicated that the government colleges of education are perceived as having better organizational climate as compared to private colleges of education. The findings further revealed that colleges of education older than 20 years have good organizational climate as compared to colleges less than 20 years old.
Zahoor (2012) studied difference between teachers of private and government schools on organizational climate and found that teachers of private and govern-ment schools differ significantly with each other on organizational climate.
Tufail and Farooq (2012) compared the level of affective, continuance and normative commitment among the faculty members of the private and public sector universities in Khyber Pakhtunkhwa. The findings revealed that faculty members working in public sector universities were higher on affective, continuance and normative commitment as compared to faculty members working in private universities.
3.
OBJECTIVES OF THE STUDY
1. To analyze the Job Satisfaction and Job Stress experienced by the GFGC teachers.
2. To examine the relationships between the job satisfaction and professional development of the GFGC teachers.
3. To suggest appropriate measures to improve the job satisfaction levels of the GFGC teachers in Shimogga region.
4.
SCOPE OF THE STUDY
The study covers the period of one academic year 2017-18 for the purposes of gathering the primary data required.
V
OLUMEN
O.
9
(2019),
I
SSUEN
O.
05
(M
AY)
ISSN
2231-5756
The different kinds of secondary data that have provided the overall premise for the study have been gathered from various sources without any specific time limit. However, different phases of time when these concepts evolved significantly and provided the relevant foundational constructs for the study spread from early industrialization, post-World War II period of technological innovations, Globalization have provided the backdrop for the present study. The study is limited to selected area of Shimogga Region only.5.
RESEARCH METHODOLOGY
Questionnaire Method
Sample size: 100
Source: Primary Data
6.
DATA ANALYSIS
Table No Showing Job Satisfaction and Job Stress experienced by the GFGC teachers.
TABLE 1
Sl. # Nature of Statement SDA DA N A SA Total
1. My job is usually interesting enough to keep me from getting bored 45% 16% 5% 19% 15% 100%
2. I am disappointed that I took this job. 64% 25% 5% 3% 3% 100%
3. I feel my job is more responsible than others 3% 4% 3% 54% 36% 100%
4. I definitely dislike my work. 48% 31% 4% 12% 5% 100%
5. I am satisfied with my job for the time being. 13% 21% 18% 33% 15% 100%
6. I am often bored with my job. 35% 36% 6% 18% 5% 100%
7. I am adequately paid for the job 6% 5% 11% 63% 15% 100%
8. My job has a fair (impartial) promotion policy. 13% 6% 30% 41% 10% 100%
9. Most of the time I have to force myself to go to work. 16% 42% 7% 25% 10% 100%
10. I do not spend more time with my family 26% 51% 11% 7% 5% 100%
CHART 1: JOB SATISFACTION AND JOB STRESS EXPERIENCED BY THE GFGC TEACHERS
ANALYSIS & INTERPRETATION
From the table among 100 respondents it is clear that 15% are strongly agree, 19% are agreed, 5% are neutral, 16% are disagree and 45% respondents are strongly disagreed about interesting enough to keep them from getting bored.
From the table it is clear that 3% are strongly agree, 3% are agreed, 05 % are neutral, 25% are disagree and 64% respondents are strongly disagreed about their opinion of why they took this job.
The above table clears that 36% are strongly agree, 54% are agreed, 3 % are neutral, 4% are disagree and 3% respondents are strongly disagreed about the job is more responsible than others.
From the table it is clear that 5% are strongly agree, 12% are agreed, 4 % are neutral, 31% are disagree and 48% respondents are strongly disagreed about their like towards the job.
From the table among 100 respondents it is clear that 15% are strongly agree, 33% are agreed, 18% are neutral, 21% are disagree and 13% respondents are strongly disagreed about their satisfaction towards job is time being.
The above table clears that 5% are strongly agree, 18% are agreed, 6 % are neutral, 36% are disagree and 35% respondents are strongly disagreed about bore with their job.
The above table clears that 15% are strongly agree, 63% are agreed, 11 % are neutral, 5% are disagree and 6% respondents are strongly disagreed about adequate payment for the job.
The above table clears that 10% are strongly agree, 41% are agreed, 30 % are neutral, 6% are disagree and 13% respondents are strongly disagreed about the promotion policy of the job.
From the table among 100 respondents it is clear that 10% are strongly agree, 25% are agreed, 18% are neutral, 42% are disagree and 16% respondents are strongly disagreed about motivation to go their job.
From the table it is clear that 5% are strongly agree, 7% are agreed, 11 % are neutral, 51% are disagree and 26% respondents are strongly disagreed that they do not have more time with their family.
45% 64% 3% 48% 13% 35% 6% 13% 16% 26% 16% 25% 4% 31% 21% 36% 5% 6% 42% 51% 5% 5% 3% 4% 18% 6% 11% 30% 7% 11% 19% 3% 54% 12% 33% 18% 63% 41% 25% 7% 15% 3% 36% 5% 15% 5% 15% 10% 10% 5%
0% 10% 20% 30% 40% 50% 60% 70% 80% 90% 100%
My job is usually interesting enough to keep me from getting bored I am disappointed that I took this job. I feel my job is more responsible than others I definitely dislike my work. I am satisfied with my job for the time being. I am often bored with my job. I am adequately paid for the job My job has a fair (impartial) promotion policy. Most of the time I have to force myself to go to work. I do not spend more time with my family
SDA
DA
N
A
V
OLUMEN
O.
9
(2019),
I
SSUEN
O.
05
(M
AY)
ISSN
2231-5756
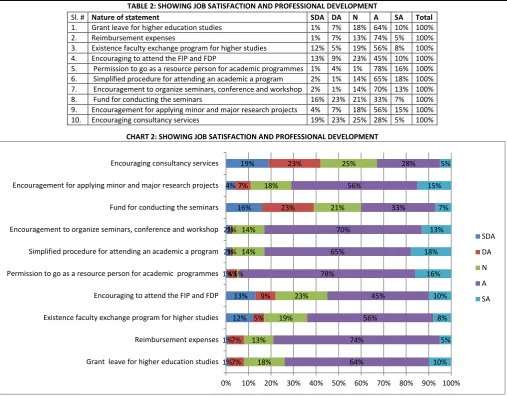
TABLE 2: SHOWING JOB SATISFACTION AND PROFESSIONAL DEVELOPMENTCHART 2: SHOWING JOB SATISFACTION AND PROFESSIONAL DEVELOPMENT
ANALYSIS & INTERPRETATION
From the table among 100 respondents it is clear that 10% are strongly agree, 64% are agreed, 18% are neutral, 7% are disagree and 1% respondents are strongly disagreed about Grant leave for higher education studies.
From the table it is clear that 5% are strongly agree, 74% are agreed, 13 % are neutral, 7% are disagree and 1% respondents are strongly disagreed about Reim-bursement expenses.
The above table clears that 8% are strongly agree, 56% are agreed, 19% are neutral, 5% are disagree and 12% respondents are strongly disagreed about the Existence faculty exchange program for higher studies.
From the table it is clear that 10% are strongly agree, 45% are agreed, 23% are neutral, 9% are disagree and 13% respondents are strongly disagreed about the encouragement to attend the FIP and FDP.
From the table among 100 respondents it is clear that 16% are strongly agree, 78% are agreed, 1% are neutral, 4% are disagree and 1% respondents are strongly disagreed about the Permission to go as a resource person for academic programmes.
The above table clears that 18% are strongly agree, 65% are agreed, 14% are neutral, 1% are disagree and 2% respondents are strongly disagreed that procedure are Simplified for attending an academic program.
The above table clears that 13% are strongly agree, 70% are agreed, 14% are neutral, 1% are disagree and 2% respondents are strongly disagreed about encour-agement to organize seminars, conference and workshop.
The above table clears that 7% are strongly agree, 33% are agreed, 21% are neutral, 23% are disagree and 16% respondents are strongly disagreed about the providing fund for conducting the seminars.
From the table among 100 respondents it is clear that 15% are strongly agree, 56% are agreed, 18% are neutral, 7% are disagree and 4% respondents are strongly disagreed about encouragement for applying minor and major research projects.
From the table it is clear that 5% are strongly agree, 28% are agreed, 25% are neutral, 23% are disagree and 19% respondents are strongly disagreed about Encouragement for consultancy services.
7.
FINDINGS
1. Majority of the respondents are strongly disagreed about their job is interesting enough to keep them from getting bored.
2. Majority of the respondents are strongly disagreed about their opinion of why they opted this job.
3. Majority of the respondents are strongly agreed that their job is more responsible than others.
4. Majority of the respondents are strongly disagreed about their dislike about the job.
5. There is a mixed opinion about the satisfaction of the job for time being.
6. Most of the respondents are strongly disagreed about bore with their job.
7. Majority of the respondents are strongly agreed that their job is adequately paid.
8. Most of the respondents are agreed about the promotion policy in their job is fair.
9. Most of the respondents strongly disagreed about force themselves to go to the work.
10. Majority of the respondents agreed that they spent good time with their family.
11. Majority of the respondents are strongly agreed about Granting leave for higher education studies.
12. Majority of the respondents are strongly agreed about Reimbursement expenses is good in their job.
1% 1% 12% 13% 1% 2% 2% 16% 4% 19% 7% 7% 5% 9% 4% 1% 1% 23% 7% 23% 18% 13% 19% 23% 1% 14% 14% 21% 18% 25% 64% 74% 56% 45% 78% 65% 70% 33% 56% 28% 10% 5% 8% 10% 16% 18% 13% 7% 15% 5%
0% 10% 20% 30% 40% 50% 60% 70% 80% 90% 100%
Grant leave for higher education studies Reimbursement expenses Existence faculty exchange program for higher studies Encouraging to attend the FIP and FDP Permission to go as a resource person for academic programmes Simplified procedure for attending an academic a program Encouragement to organize seminars, conference and workshop Fund for conducting the seminars Encouragement for applying minor and major research projects Encouraging consultancy services
SDA
DA
N
A
SA
Sl. # Nature of statement SDA DA N A SA Total
1. Grant leave for higher education studies 1% 7% 18% 64% 10% 100%
2. Reimbursement expenses 1% 7% 13% 74% 5% 100%
3. Existence faculty exchange program for higher studies 12% 5% 19% 56% 8% 100%
4. Encouraging to attend the FIP and FDP 13% 9% 23% 45% 10% 100%
5. Permission to go as a resource person for academic programmes 1% 4% 1% 78% 16% 100%
6. Simplified procedure for attending an academic a program 2% 1% 14% 65% 18% 100%
7. Encouragement to organize seminars, conference and workshop 2% 1% 14% 70% 13% 100%
8. Fund for conducting the seminars 16% 23% 21% 33% 7% 100%
9. Encouragement for applying minor and major research projects 4% 7% 18% 56% 15% 100%
V
OLUMEN
O.
9
(2019),
I
SSUEN
O.
05
(M
AY)
ISSN
2231-5756
13. Majority of the respondents are strongly agreed about Existence faculty exchange program for higher studies are satisfactory.
14. Most of the respondents are strongly agreed about the encouragement to attend the FIP and FDP.
15. Most of the respondents are strongly agreed about the Permission to go as a resource person for academic programmes is good in their job.
16. Majority of the respondents are strongly agreed about the Simplified procedure for attending an academic program.
17. Most of the respondents are strongly agreed about the encouragement to organize seminars, conference and workshop.
18. There is mixed response from the respondents about the providing fund for conducting the seminars.
19. Most of the respondents are strongly agreed about the encouragement for applying minor and major research projects is satisfactory.
20. Majority of the respondents are strongly disagreed about Encouragement for consultancy services in their job.
8.
SUGGESTIONS
1. As majority of the feel their job is more responsible than others, steps need to be taken to manage the responsibilities.
2. Most of the respondents are happy about their job only for time being, hence action need to take to make them comfortable about their job.
3. Most of the customers feel that there is no encouragement for organizing seminars; hence funds could be sanctioned to organize the same.
4. There are no consultancy services for the respondents, hence there is need of encouragement for the same to improve the performance.
5. Other than academic works there is a need of lot other career development activities, government have to concentrate & encourage those activities to
improve the quality of the education.
9.
CONCLUSION
From the study it can be concluded that, government is providing all the necessary facilities & amenities for the employees to improve their performance as well as the quality of the students. Selected respondents are satisfied about their job and they feel less stress compare to other employments.
Government has to take some steps to increase the performance and satisfaction level of the employees compare to other private employees only in terms of non academic programs. Grants and encouragement should be provided to conduct the seminars, workshops, symposia & conference.
REFERENCES
1. Bretz, R. D., and Thomas, S. L. (1992), Perceived Equity, Motivation, and final offer Arbitration in major league baseball. Journal of Applied Psychology, 77,
280-287.
2. David, B. Balkin, Luis R. Gomez-Mejia (1987), Towards a Contengency Theory of Compensation Strategy. Strategic Management Journal, Vol. 8, 169-187.
3. Gosnell, S (2000), Determinant of Career Satisfaction Among Federal Employees. Paper presented in Seminar on Public Policy. Georgia Institute of
Technol-ogy. Atlanta, Georgia, U.S.A.
4. Lacy, F. J & Sheehan, B. A (1997), Job Satisfaction among Academic Staff: An International Perspective. Higher education 34: 305-322 Kluwer Academic Publishers.
5. Ma, X. and MacMillan, R.B. (1999), Influence of Workplace Conditions on Teachers’ Job Satisfaction. The Journal of Educational Research, 93 (1), 39-47.
V
OLUMEN
O.
9
(2019),
I
SSUEN
O.
05
(M
AY)
ISSN
2231-5756
AN ANALYTICAL STUDY OF CUSTOMER’S BUYING BEHAVIOUR TOWARDS LIFE INSURANCE PRODUCTS
Dr. ANIL CHANDHOK
PROFESSOR
UNIVERSITY BUSINESS SCHOOL
CHANDIGARH UNIVERSITY
GHARUAN
Dr. BHAVET
JAGADHRI
Email: [email protected]
ABSTRACT
The Life Insurance industry in India is growing with number of national and global players in the form of Joint ventures are excelling with the tremendous growth in business. With Government of India framing several rules and regulations, Life Insurance industry has been experiencing exponential growth in terms of increasing number of policy holders with considerable number of new entry of companies into the insurance sector. At present, there are 24 numbers of domestic and foreign players operating in the life insurance sector. In India, insurance still has been considered as a tax saving tool instead of an investment option for future. The present study analyzes the factors that are influential in choosing a particular life insurance company when he needs an insurance policy. The study was conducted among the respondents of the city of Ambala.
KEYWORDS
insurance, investment, customer, benefits, behavior, influences.
JEL CODE
M31
INTRODUCTION
s a human being every individual has the risk from one or the other source. At the same time, being individual, one has the responsibilities to discharge. Indian consumers are easily influenced by emotional factors. But at the same time, their buying behavior is influenced by rational factors. A typical Indian believes in the future and tries to have better and secured life for his family in future. A rupee earned by the person will be spent towards leading the family in present and for the better life for coming period ahead. Life insurance covers both the components i.e., risk coverage and savings. As the Indian economy comprises of people in which majority of them are either lower or middle class and are salaried households, Insurance is emerging as the best option for saving and risk coverage.
But in India, life insurance is always thought-out to be a tax saving tool instead of its additional implied long term financial benefits. Indian people are more traditional minded and prefer to invest in property and gold followed by bank deposits. They selectively invest in shares also but the percentage is extremely small.
NEED OF THE STUDY
The study was undertaken by a survey undertaken at Ambala City and Ambala Cantt. of various life insurance Policy holders with an aim to analyze what the customers have in their mind for taking the particular insurance product. This study aims in identifying the influencing factors to take insurance policies, awareness of various promotional packages, policies offered by the insurance companies. Since, many people will consider insurance as a savings option, given this appre-hension in minds of customers about the insurance policies and different insurance companies, the present study was undertaken. A Large number of new players have entered the market and are vying to expand market share in this swiftly improving marketplace.
OBJECTIVES OF THE STUDY
The present research was undertaken with the following objectives:
1. To study the Indian insurance industry in general and
2. To identify and analyze the factors affecting the choice of investors in choosing a life insurance policy.
3. To offer suggestions based on the study, to improve the marketing strategies to design policies in accordance with customer behavior.
METHODOLOGY
For undertaking this study, a structured questionnaire was designed and canvassed among the respondents of Ambala City and Ambala Cantt. A simple random sampling method was used in collecting the required data from the respondents. A sample of 150 was considered for the study from a huge population of various policy holders of life Insurance. The collected data was analyzed and interpreted through tables and graphs and findings are reported and suggestions were made accordingly.
DATA COLLECTION AND INTERPRETATION
A total of 150 respondents were contacted on simple random basis to collect information through structured questionnaire used for the study.
V
OLUMEN
O.
9
(2019),
I
SSUEN
O.
05
(M
AY)
ISSN
2231-5756
TABLE 1: COMPOSITION OF THE RESPONDENTS INCLUDED IN THE STUDY FROM AMBALADetails Frequency Percentage
Gender
Male 117 78
Female 33 22
Total 150 100
Age
Below30 48 32
31-40 45 30
41-50 36 4
51-60 21 14
Above 60 0 0
Total 150 100
Education level
Under graduate 21 14
Graduate 45 30
Post graduate 69 46
Doctorate 15 10
Others 0 0
Total 150 100
Occupation
Student 21 14
Employee 96 64
Self-employment 33 22
Total 150 100
From the above table, it was analyzed that 78 of the respondents are male in the present study. Majority of the respondents are in the age group of below 30 with a percentage of 32 followed by another age group 31-40 with a percentage 30. In the study, majority of the respondents are graduates or post graduates with a percentage of 46 followed by graduates with a percentage of 30. In this study majority of the respondents are employees whose percentage is 64.
MONTHLY INVESTMENT FROM INCOME
TABLE 2: COMPOSITION OF INVESTMENT FROM MONTHLY INCOME
Details Frequency Percentage
Percentage of monthly Investment
Below10% 60 40
11%- 20% 78 52
21%-31% 6 4
31%-40% 6 4
Total 150 100
Kind of Investment
Short term 33 22
Long-term 117 78
Total 100 100
The above analysis shows that most number of respondents i.e. 52% of the respondents have been investing 11-20% of their salary and 40% of the respondents have been investing below10% of their salary. Very few people are investing beyond 20% of their salary. Among the customers who have invested, 78% are interested to invest for long term period and minor part i.e. 22% are interested to invest for short term period. This means majority of the respondents are aware of the benefits of long term investments.
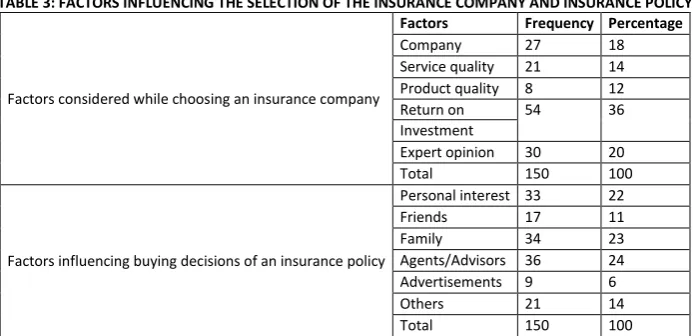
FACTORS BEING CONSIDERED WHILE CHOOSING AN INSURANCE COMPANY AND POLICY
TABLE 3: FACTORS INFLUENCING THE SELECTION OF THE INSURANCE COMPANY AND INSURANCE POLICY
Factors considered while choosing an insurance company
Factors Frequency Percentage
Company 27 18
Service quality 21 14
Product quality 8 12
Return on 54 36
Investment
Expert opinion 30 20
Total 150 100
Factors influencing buying decisions of an insurance policy
Personal interest 33 22
Friends 17 11
Family 34 23
Agents/Advisors 36 24
Advertisements 9 6
Others 21 14
Total 150 100
V
OLUMEN
O.
9
(2019),
I
SSUEN
O.
05
(M
AY)
ISSN
2231-5756
RATIONALE BEHIND BUYING THE LIFE INSURANCE PLANTABLE 4: FACTORS GOVERNING THE RATIONALE OF BUYING LIFE INSURANCE PLAN
Rationale behind investment in Insurance policies
Factors Frequency Percentage
Individual risk coverage 9 6
Tax benefit 45 30
Growth and ROI 54 36
Risk coverage of family 36 24
Child welfare 6 4
Total 150 100
If we analyze the rationale behind investing in insurance policies, 36% of the respondents have felt the rationale behind investment in Insurance policies is growth and return while 30% of the respondents feel tax benefits are the reasons behind investment in insurance policy. Risk coverage of family is the reason behind investment for 24% of the respondents.
TABLE 5: AWARENESS LEVEL OF INSURANCE COMPANY
Awareness of Insurance companies
No. of Companies Frequency Percentage
1 to 3 71 47
4 to7 39 26
8 to10 24 16
More than 10 16 11
Total 150 100
Awareness of details of policy before buy
Yes 117 78
No 33 22
Total 150 100
The above table shows the number of insurance companies known by the respondents and awareness details of the policy before they buy the insurance policies. Majority of the respondents’ i.e. 47% have known only one to three companies. One of the most common known life insurance company was Life Insurance Corporation of India which was popular.
Only 11% of the respondents knew more than 10 insurance companies. The results show that majority of the people are unaware of different insurance companies. If we understand the policy awareness levels, 78% are aware of details about the policy before they buy. The education and awareness towards the fraudulent activities is also a factor which influences the policy holders to know the policy details before they buy.
TABLE 6: TENURE OF THE POLICY PLAN AND THE BENEFICIARY ON WHOM POLICY TAKEN
Periodicity of the Policy
Periodicity Frequency Percentage
Above 5 Years 24 16
5 -15 Years 51 34
15 -25 Years 54 36
Above 25 Years 21 14
Total 150 100
For whom the policy is purchased
Target Frequency Percentage
Self 64 43
Spouse 31 21
Children 33 22
Other family members 22 15
Total 150 100
The above table shows 16% of the respondents have purchased a policy plan for a period of more than 5 years, 34% of the respondents have taken policies for a period of 5 to 15 years, 36% of the respondents have taken insurance for a period of 15 to 25 years, 14% of the respondents have policy plans for a period of more than 25 years. This analysis shows the large number of customers prefer to buy life policy plans for periods of 5-15 years and 15-25 years only. At the same time, it was observed that majority of the respondents buy the policy for their own self and next preference was given for children followed by spouse. The table shows 43% of the respondents has bought insurance policies for self, 22% for children and 21% for spouse where as 15% of the respondents have insurance policies for other family members such as father or mother.
TABLE 7: PREFERABLE SOURCE OF BUYING INSURANCE POLICY AND PREMIUM PAYMENT METHODS
Preferable source for buying insurance policy Source Frequency Percentage
Advisors of company 65 43
Insurance companies 19 13
Bank 37 25
Other sources 29 19
Total 150 100
Premium Payment Methods Monthly 14 9
Quarterly 26 17
Half yearly 57 38
Annually 53 35
Total 150 100
V
OLUMEN
O.
9
(2019),
I
SSUEN
O.
05
(M
AY)
ISSN
2231-5756
TABLE 8: NATURE OF LIFE INSURANCE POLICY AND PREFERENCE OF INSURANCE COMPANYNature Of Insurance Policy
Options Frequency Percentage
Low Risk And Secured 98 65
Moderate Risk With 34 23
Minimum Return
High Risk With High 18 12
Return
Total 150 100
Preferable Insurance Company
LIC 21 81
Private Insurance Companies 29 19
Total 150 100
This analysis shows majority of the respondents i.e. 65% of the respondents prefers to invest in low risk and secured policies such as saving plans where as 23% of the respondents prefer to invest in the plans which carries moderate risk with assured minimum return investments such as payback policies. Only 12% of the respondents only like to invest in the policies with high risk and high investment. Among the respondents, majority of the respondents prefers to invest in LIC since it’s a public sector organization. The study shows 81% of the respondents will invest in LIC and only 19% of the respondents prefer to buy insurance from private insurance companies other than LIC.
FINDINGS
The study on consumer buying behavior towards life insurance has depicted several facts. It was found that majority of the customers towards life insurance are male in number when compared with females. The age group which prefers to invest more in Insurance is below30years of age group and 31-40 years’ age group. These two groups have income potential to invest in Insurance companies. Post graduates and graduates are showing more interest in taking insurance policies as they have more awareness levels. As salaried employees are more towards saving, majority of the people prefers to save 11% to 20% of their salary towards savings. It was also deduced that majority of the people prefer to buy policy plans for long term plans. It was revealed from the data that family, advisors and self-interest are major drivers in buying the life policy insurance. The study shows that tax benefits, risk coverage and growth are the major influencing variables for buying the insurance plans. Majority of the customers tries to seek insurance policies from insurance advisors and they prefer to take life insurance plans for himself/ herself and for their children.
The periodicity of investment lies from 5years to 20years based on the feature and nature of the policy. It was found that a customer of life insurance likes to pay premium half yearly and annually than monthly and quarterly.
CONCLUSION
Indian consumers have different consuming habits which can be changed very quickly due to the passage of time. The Indian consumers have different perception towards investments. This research has focused on understanding the behavior of customers towards life insurance plans. This study was focused to identify the underlying reasons, facts that drive customers to buy life insurance. Majority of the customers feels life insurance as a tax saving option than the risk protection and saving options. If their investment patterns are analyzed, majority of the customers prefers long term investments and low risk-moderate return options. The major influencing variables in choosing an insurance company are customer relationships, company image.
The overall attitude of customers towards life insurance is positive. If the private insurance companies try to provide and serve the customers with service quality coupled with empathy and assurance, India could become a biggest market for any insurance company.
REFERENCES
1. Antony Beckett, Paul Hewer, Barry Howcroft. An exposition of consumer behaviour in the financial services industry, International Journal of Bank Marketing.
2008; page: 15-26.
2. Dr. Dipin Mathur, Mr. Ashish Tripathi, Factors Influencing Customer’s Choice for Insurance companies - A Study of Ajmer City”, IOSR Journal of Business and
Management. 2017.
3. Fukukawa, K. Developing A Framework for Ethically Questionable Behavior in Consumption, Journal of Business Ethics, 2014.
4. Narender S, Sampath L. Consumer Awareness towards life insurance sector in India, Abhinav’s International Referred Journal of research in Management
and technology. 2018.
5. Sandeep Chaudhary. Consumer Perception Regarding Life Insurance Policies: A Factor Analytical Approach. Pacific Business Review International. 2017; page
22-28
6. Vijaya Ragunathan M. A Study on Consumer Behavior Towards Life Insurance Products with Reference to IDBI Fortis Company Limited, Dindigul District,
V
OLUMEN
O.
9
(2019),
I
SSUEN
O.
05
(M
AY)
ISSN
2231-5756
A STUDY ON THE VARIOUS PRODUCTS, SERVICES AND PERCEPTION OF POLICY HOLDERS OFFERED BY LIC
FOCUSING ON NILAMBUR BRANCH OF MALAPPURAM DISTRICT
FEBINA. K (KALLIDUMBAN)
ASST. PROFESSOR
DEPARTMENT OF COMMERCE
MES KEVEEYAM COLLEGE
VALANCHERY
ABSTRACT
In today’s competitive environment, different kinds of investment avenues are available to the investors. All investment modes have advantages and disadvantages. An investor tries to balance these benefits and shortcoming of different investment modes before investing them. Among various investment modes LIC is the most suitable investment mode for the common man, as it offers various kinds of policies to the policy holders. Life insurance Corporation of India is the largest insurance group and Investment Company in India. It is a state owned company. LIC provides insurance plans, pension plans, unit plans, special plans, health plans, children plan etc. Insurance agent approaching the people but they don’t ready to take policy. So some factors affect the policy holders to take such policy. Lot of people opted different policies, but marketers need to know the level of satisfaction and it will meet the expectation or not. In this research an attempt is made to study investor’s perception of LIC focusing on Nilambur Branch.
KEYWORDS
investment, insurance, policy.
JEL CODES
M31, G22.
INTRODUCTION
here are a lot of investment choices and one must select the most appropriate one. The person dealing with the planning needs to know all the various investment choices and how these can be chosen for the purpose of attaining the overall objectives. The details of making the investment have to be maintained and managed. The developing countries like India face the enormous task of finding sufficient capital in their developing efforts. In order to have production as per target, investment is considered the crucial determinant and capital formation is to be supported by appropriate volume of saving. Life insurance business has its origin in England. Insurance companies in India have a deep rooted history. It all began in 1818 when Oriental Life Insurance Company in Calcutta was established. From then on insurance was scattered across the country. It was an unorganized sector. Then in 1950, the entire insurance segment was nationalized. On 19thJanuary 1956 an ordinance was promulgated by the President of India to take over the management and control of life insurance. The Insurance companies in India are vital for one's saving purpose. In the beginning Insurance was looked at as a 'tax-benefit' investment. Slowly, however the mindset of the common man is changing. Life Insurance is now looked on as investment vehicle.
LIC of India has monopoly over the Indian life insurance sector. But after the entry of private insurance players having alliance with foreign insurance experts, Indian insurance markets have turned into a highly competitive market. From its very inception, the Corporation has made impressive growth always striving for further improvement. However, Government made a paradigm shift in the economic policy by adopting the process of liberalization, privatization and globalization at the end of previous decade.
STATEMENT OF THE PROBLEM
Life insurance Corporation of India is the largest insurance group and Investment Company in India. It is a state owned company. LIC provides insurance plans, pension plans, unit plans, special plans, health plans, children plan etc. Insurance agent approaching the people but they don’t ready to take policy. So some factors affect the policy holders to take such policy. Lot of people opted different policies, but marketers need to know the level of satisfaction and it will meet the expectation or not. The study analyses the perception of policy holders offered by LIC focusing on Nilambur branch.
OBJECTIVES OF THE STUDY
1. To study various policies provided by LIC.
2. To evaluate the various factors influencing the selection of LIC policies.
3. To identify investors perception towards LIC.
HYPOTHESIS
There is no significant difference between occupation and satisfaction level of policy holders.
RESEARCH METHODOLOGY
The study is designed on descriptive study conducted in Nilambur Branch based on both secondary and primary data. Secondary data collected from published books, magazine, website, journals and report periodicals. Primary data collected from 160 peoples in Nilambur area. All samples are collected on convenience sampling basis, because the total numbers of unknown. The method of sampling used is convenient sampling. The required data for the study has been collected through questionnaire. ANOVA, Weighted rank, Weighted average and percentage analysis is having been used to analyze and interpret the data by using MICROSOFT EXCEL and MEGASTAT.
LIMITATIONS OF THE STUDY
1. The study is based on sampling method, so the sampling errors bound to occur.
2. Collection of data was tedious process as respondents were not corporative.
3. The time was limited.
V
OLUMEN
O.
9
(2019),
I
SSUEN
O.
05
(M
AY)
ISSN
2231-5756
DATA ANALYSIS AND INTERPRETATION
TABLE 1: TYPES OF INSURANCE POLICY
SL NO Policies No. of Respondents Percentage of total Cumulative percentage
1 Whole life 33 20.62 20.62
2 Endowment 40 25 45.62
3 Money back 35 21.88 67.5
4 Pension fund 15 9.38 76.88
5 Jeevan Anand 26 16.24 93.12
6 Others 11 6.88 100
Total 160 100
Source: primary data
From the above table revealed that majority of the investors was selected endowment policy. 20.62% were selected whole life policy. 21.88% were selected money back policy and 6.88% were selected other policies.
TABLE 2: FACTORS CONSIDERED WHILE TAKING LIC POLICY (For the purpose of this analysis, used Weighted Average)
Factors
5 4 3 2 1
Total Weight Weighted Rank
Highly important Important Neutral Least important Not important
Risk coverage and saving 78 80 0 2 0 714 142.8 I
Tax benefit 72 66 8 10 4 672 134.4 III
Rider benefit 52 40 36 20 12 580 116 IX
Company image 60 60 32 8 0 652 130.4 VI
Premium 60 64 12 12 12 628 125.6 VII
Money back guarantee 74 60 18 8 0 680 136 II
Bonus and interest 50 48 52 8 2 616 123.2 VIII
After sale service 72 56 16 12 4 660 132 IV
security with high return 58 66 28 8 0 654 130.8 V
From the above table reveals that the majority of policy holders are given more priority to risk coverage and savings rather than money back guarantee and the third priority to tax benefit. The policy holders are given least important to rider benefit.
TABLE 3: PREFERENCE OF VARIOUS LIC POLICIES (For the purpose of this analysis, used Weighted Rank)
Sl No Insurance Policy Ranks Total Weight Rank
11 10 9 8 7 6 5 4 3 2 1
1 Single premium endowment 64 50 6 4 6 4 6 6 4 4 6 1436 1
2 Jeevan anand 46 58 14 6 4 6 6 4 4 6 6 1400 2
3 Jeevan rakshak 6 6 6 6 4 70 14 34 6 4 4 912 7
4 Plans for handicapped 16 6 20 6 68 18 6 6 6 4 4 1094 5
5 Term plan 0 6 10 80 20 6 14 4 6 10 4 1132 4
6 Children policy 4 6 6 8 10 16 20 64 14 6 6 804 8
7 Pension plan 6 6 10 14 10 20 72 10 4 4 4 942 6
8 Health insurance plan 4 4 4 6 2 4 6 12 50 56 10 572 9
9 ULIP 4 4 4 6 12 4 4 10 20 46 46 534 10
10 Money back policy 6 10 74 20 16 4 10 6 6 4 4 1232 3
11 Jeevan lakshya 4 4 6 4 6 6 4 4 40 16 66 942 11
Source: Primary Data
From the above table indicated that the most of the policy holders are prefer ‘Endowment plus’ policy rather than ‘Jeevan Anand’ policy. i.e. the first preference for endowment plus and second priority is gives to the Jeevan Anand, the third priority is given to the ‘money back policy’. Policy holders are given less important to ‘ Jeevan lakshya’ policy(11th rank).
TABLE 4: OVERALL SATISFACTION OF POLICIES
Factors
Occupation
Govt Employee Professional Self-Employee Private Employee Businessmen Others Total
Quality of product 4 3.67 3.5 3.95 3.65 3.38 22.15
Innovativeness of policy 3.75 3.54 3.31 3.65 4.68 4 22.93
surrender value 3.44 3.84 3.63 3.7 3.68 3.38 21.67
Tax relief 3.81 4.25 3.88 3.85 3.85 4.13 23.77
Security system 3.88 3.88 3.75 3.65 3.33 3.13 21.62
Agent's service 3.75 3.92 3.69 3.6 3.68 3.5 22.14
Loan facility 4.06 4.08 4 3.28 3.45 3.88 22.75
Behaviour of Employees 3.67 3.54 3.19 3.23 3.35 2.63 19.61
Grievance redressel cell 4.03 3.75 3.44 3.23 3.25 2.75 20.45
Mode of payment 4.25 4.04 3.69 3.83 3.83 3.88 23.52
Advertisement policy 3.72 4.17 3.25 3.5 3.43 3.63 21.7
Total 42.36 42.68 39.33 42.7 40.18 38.29 242.31
Source: primary data
ANOVA TABLE
Source of variation Sum of squares Degree of freedom Means square F- Ratio P – Value
Between columns SSC : 1.4135 5 .28271 3.67 .0066
Between rows 2.5603 10 .25603 3.33 .0022
Residual 3.8493 50 .07699
Total 7.8232 65