Quantifying the effects of acute hypoxic exposure on exercise performance and capacity: a systematic review and meta-regression
Running head: Acute hypoxia and exercise performance: meta-regression
Sanjoy. K. Deb1, Daniel. R. Brown1, Lewis. A. Gough1, Christopher P. McLellan3, Paul A. Swinton2, S. Andy Sparks1, Lars. R. McNaughton14
1 Sports Nutrition Research Group, Department of Sport and Physical Activity, Edge Hill University, Ormskirk, Lancashire, L39 4QP, UK.
2 School of Health Sciences, Robert Gordon University, Aberdeen, UK.
3Bond University, QLD, Australia
4 Department of Sport and Movement Studies, Faculty of Health Science, University of Johannesburg
Corresponding author:
Sanjoy K. Deb
Department of Sport and Physical Activity Edge Hill University
St Helens Road Ormskirk Lancashire L39 4QP
United Kingdom
01695 657214
Abstract
Objective: To quantify the effects of acute hypoxic exposure on exercise capacity and performance, which includes continuous and intermittent forms of exercise.
Design: A systematic review was conducted with a three-level mixed effects meta-regression. The ratio of means method was used to evaluate main effects and moderators providing practical interpretations with percentage change.
Data Sources: A systemic search was performed using 3 databases (Google scholar, PubMed and SPORTDiscus).
Eligibility criteria for selecting studies: Inclusion was restricted to investigations that assessed exercise performance (time trials, sprint, and intermittent exercise tests) and capacity (time to exhaustion test (TTE)) with acute hypoxic (< 24 hrs) exposure and a normoxic comparator.
Results: Eighty-two outcomes from 53 studies (N = 798) were included in this review. The results show an overall reduction in exercise performance/capacity -17.8 ± 3.9% (95% CI -22.8% to -11.0%), which was significantly moderated by 6.5 ± 0.9% per 1000 m altitude elevation (95% CI 8.2% to -4.8%) and oxygen saturation (-2.0 ± 0.4% 95% CI -2.9% to -1.2%). Time trial (-16.2 ± 4.3%; 95% CI -22.9% to -9%) and TTE (-44.5 ± 6.9%; 95% CI -51.3% to -36.7%) elicited a negative effect, whilst indicating a quadratic relationship between hypoxic magnitude and both TTE and TT performance. Furthermore, exercise < 2-min exhibited no ergolytic effect from acute hypoxia.
Summary/ Conclusion: This review highlights the ergolytic effect of acute hypoxic exposure; which is curvilinear for TTE and TT performance with increasing hypoxic levels, but short-duration
intermittent and sprint exercise seem to be unaffected.
Introduction
1
Sojourns to terrestrial high altitudes have grown in popularity in recent years, with the World Health
2
Organisation reporting that approximately 35 million people visit terrains greater than 3000 m every
3
year. Furthermore, there is a greater prevalence of altitude and hypoxic training camps amongst elite
4
athletes in preparation for major competition. This has necessitated a greater understanding on the effect
5
of altitude on exercise performance. A predominant environmental stressor for human physiology at
6
altitude is the lower partial pressure of oxygen with progressive elevations. As such, the recent
7
commercialisation of hypoxic simulation chambers and portable devices has increased the accessibility
8
to acute hypoxic training strategies for recreational athletes and individuals predisposed to health issues.
9
Intermittent hypoxic training (IHT) is one ergogenic training strategy commonly used; whereby isolated
10
acute hypoxic training bouts are interspersed within a training programme. These acute training bouts,
11
however, present a substantially negative impact on exercise capacity (Wehrlin & Hallén, 2006) and
12
performance (Clark et al., 2007; Goods, Dawson, Landers, Gore, & Peeling, 2014). Therefore,
13
quantifying the negative effect of hypoxia is important to inform exercise prescription and performance
14
management during IHT training and other forms of acute hypoxic exercise.
15
The magnitude of acute hypoxia’s ergolytic effect is dependent on the type of exercise and the duration
16
(Wyatt, 2014). Indeed, mean power output during 5 min time trial (TT) reduces by 7% every 1000 m
17
(Clark et al., 2007) and exercise capacity is reported to decline by 9.4% in the first 500 m with a greater
18
14.3% per 1,000 m thereafter (Wehrlin & Hallén, 2006). However, mean power output and work
19
completed during repeated sprint exercise (RSE) is only impaired from hypoxic conditions equivalent
20
to 4000 m (Bowtell, Cooke, Turner, Mileva, & Sumners, 2014; Goods et al., 2014). This difference in
21
effect may be attributed to the shorter duration of activity during RSE tests; given the suggestion that
22
high intensity exercise lasting less than 2 min is largely unaffected by hypoxia (Wyatt, 2014).
23
Furthermore, acute hypoxia is shown to enhance the relative anaerobic energy contribution and
24
concurrently lower the relative and absolute aerobic contribution (Horscroft & Murray, 2014; Scott,
25
Goods, & Slattery, 2016). Therefore, the magnitude of decline is likely to be dependent on the
26
Despite current evidence from experimental investigations, a pooled effect from all available evidence
28
will offer a more generalisable understanding of the effect of acute hypoxia on exercise performance.
29
The influence of acute hypoxia during exercise is subject to large inter-individual variability, with
30
training status (Macinnis, Nugent, Macleod, & Lohse, 2015) and an individual’s ability to maintain
31
oxyhaemoglobin saturation (SaO2) during exercise (Chapman, Stager, Tanner, Stray-Gundersen, &
32
Levine, 2011) cited as primary reasons for this variability. Indeed, a meta-analysis identified that the
33
reduction of maximal rate of oxygen consumption (VO2max) under acute hypoxia was greater in those
34
that possessed a superior VO2max (Macinnis et al., 2015). Thereby, suggesting that athletes of a higher
35
training status may be subject to a greater decrement in performance compared to their untrained
36
counterparts. While, susceptibility to SaO2 reductions is reported to be a more robust predictor of
37
exercise performance under hypoxia, given the preservation of SaO2 during exercise is linked to the
38
improved maintenance of 3000 m running performance under acute moderate hypoxic conditions
39
(Chapman et al., 2011). Therefore, reducing peripheral oxygen delivery to active musculature, as
40
inferred through a lower SaO2, is a hypothesised to be a primary moderator of exercise performance
41
within acute hypoxic conditions.
42
The purpose of this study was to perform a systematic review and meta-regression to quantify the effect
43
of varying magnitudes of hypoxia on exercise capacity and performance. Performance was further
44
subdivided into continuous (TT), intermittent and sprint (Wingate test) exercise sub-groups; and each
45
group assessed against the moderators of elevation equivalent to the hypoxic magnitude tested, SaO2
46
reduction during exercise and training status. Furthermore, the ergolytic effect of hypoxia was assessed
47
against exercise of different durations.
48
Method
49
This meta-analysis followed the principles outlined in the Preferred Reporting Items for Systematic
50
Reviews and Meta-analyses (PRISMA) guidelines.
51
The research question was formulated using PICO method (Population, Intervention, Comparison and
53
Outcomes) and used to inform the eligibility criteria of selected studies. The population of the review
54
were healthy male and females (≥ 18 yrs old), including healthy to highly trained individuals. Samples
55
that included acclimatised or altitude natives were excluded from the review. The intervention involved
56
the assessment of exercise outcomes equivalent to sea level and an exposure to an acute hypoxic stress
57
for less than 24 hrs prior to the assessment of performance. This timeframe was selected as a large
58
degree of acclimatisation in exercise performance has been observed following 24 hrs of exposure
59
(Wyatt, 2014). Investigations that utilised normobaric and hypobaric hypoxic exposures were included
60
in this review. However, only laboratory simulations were included as equivalent power outputs elicit
61
faster velocities at high terrestrial altitudes compared to sea level due to the lower air density, therefore
62
mitigating performance decrements associated with the diminished O2 availability (Garvican-Lewis et
63
al., 2015). The comparisons for this review were randomised controlled trials that involved a sea level
64
exercise trial. Where a sea level trial was not performed (i.e. at 0 m elevation or a fractional inspired
65
oxygen (FiO2) equal to 21%) the difference between the lowest hypoxic exposure and experimental
66
hypoxic exposure was used for analysis. The FiO2 used during experimental trials were converted to the
67
equivalent altitude elevation for analysis, however all outcomes are interpreted as the effect of acute
68
hypoxia only. If room air was used as the sea level trial, the elevation of the testing laboratory was
69
checked to ensure the correct elevation was tested. The outcomes included in this review involved
70
exercise performance and exercise capacity. Exercise performance was defined as activities that were
71
self-paced continuous (e.g. TT) or intermittent tasks, while exercise capacity referred to tests that
72
required individuals to work to a point of volitional exhaustion at an established controlled intensity.
73
Search strategy and study selection
74
A literature search was conducted to identify all relevant original investigations that assessed the
75
influence of acute hypoxic exposure on exercise performance, capacity and physiological thresholds of
76
intensity. This involved two investigators (S.K.D and L.A.G) independently inputting key search terms
77
into three scientific data bases (Google Scholar, PubMed and SPORTDiscus). The search terms were
78
‘fractional inspired oxygen’) with exercise performance (‘time trial (TT)’ repeated sprint exercise
80
(RSE)’, ‘anaerobic exercise’, ‘Wingate’ and ‘sprint performance’) or exercise capacity (‘time to
81
exhaustion (TTE)’, ‘exercise capacity’); with all searches restricted to the article titles. The articles were
82
then all reviewed for relevance, which was assessed by the title, with all remaining articles downloaded
83
for further screening and assessment against the eligibility criteria of this review. The reference lists of
84
all retrieved articles and of relevant review articles were also screened for additional eligible articles.
85
The abstracts of all studies were subsequently reviewed to narrow the pool the studies reviewed in full.
86
This list of eligible studies obtained independently were then compared and amalgamated for data
87
extraction. The last search was undertaken in April 2017.
88
Data collection process
89
The data from all eligible studies were extracted into a standardised excel template (S.K.D) and checked
90
for accuracy (L.A.G). The extracted data included author name, year, sample characteristics, VO2max,
91
type of hypoxic exposure, arterial oxyhaemoglobin saturation (including SaO2 obtained from blood
92
samples, and SpO2 obtained via pulse oximetry), exercise test description. Furthermore, the mean data
93
and standard deviation (SD) of control and experimental conditions were extracted, in addition to an
94
exact p value or a value that indicated the variance in the intervention effect (e.g. 95% confidence
95
intervals or SD of mean difference). Instances where mean ± SD were displayed in figures only, a graph
96
digitiser software was used to extract the data (Digitize, Germany). This extraction was performed
97
independently by two researchers (S.K.D and L.A.G) and compared for consensus, where this was not
98
apparent a third researcher (D.R.B) performed the extraction for agreement.
99
Data were primarily extracted as mean power output (or velocity) or total work done from the TT and
100
intermittent exercise protocols, while exercise duration was extracted for all exercise capacity tests.
101
Authors of studies where required data were missing or outcomes were not reported appropriately for
102
this review were contacted for further information. Where performance data was not reported in mean
103
power output or work done, but rather test completion time, the available datum was converted into
104
varying magnitudes of hypoxia and experimental data from independent groups were extracted as
106
separate outcomes.
107
Data were categorised into sub-groups based on exercise type and duration of exercise bout. The
108
exercise subgroups reflected the outcomes outlined in the eligibility criteria: TT performance,
109
intermittent exercise, TTE and sprint tests. Exercise was also categorised into three time based
sub-110
groups (< 2 mins, 2 – 10 min and > 10 mins) as the ergolytic effect of hypoxia is proposed to be
111
dependent on duration (Wyatt, 2014). The first category was chosen as exercise below 2 min is
112
suggested to be unaffected by acute hypoxia (Wyatt, 2014); whereas the category between 2-10 min
113
was chosen to include the range of exercises that are likely to require an anaerobic energy contribution
114
(Duffield, Dawson, & Goodman, 2005). Exercise beyond 10 min is included in this review to represent
115
exercise intensities that predominantly require an aerobic energy contribution. Intermittent exercise,
116
which involved controlled repetitions of work and recovery, were categorised on the total duration of
117
high intensity activity periods. Furthermore, outcomes were categorised by training status with a sea
118
level VO2max ≥ 55 ml·kg-1·min-1 classified as trained and < 55 ml·kg-1·min-1 as healthy untrained (De
119
Pauw et al., 2013). Where VO2max was not reported, articles were not included in analysis to maintain
120
objectivity.
121
Quality and bias assessment
122
The overall quality of evidence for each outcome was determined by S.K.D and L.A.G independently,
123
using the Grades of Recommendation, Assessment, Development and Evaluation Working Group
124
(GRADE) approach. The GRADE protocol offers a systematic method to evaluate the quality of
125
research whilst considering methodological limitation, consistency of outcomes, reporting or
126
publication bias and indirectness of evidence. Furthermore, to increase specificity to the current
127
research question three discipline specific factors were considered under the category methodological
128
limitation: 1) the control of prior altitude/hypoxic exposure to reduce any confounding effects of
129
acclimatisation; 2) standardisation of dietary intake prior to experimental trials; and 3) familiarisation
130
to exercise trials. In addition to the traditional quality control criteria to limit bias: 1) blinding of
131
However, the indirectness of evidence was not considered in this review, due to inclusion criteria
133
requiring the assessment of exercise performance directly; while a traditional funnel plot was not used
134
to assess publication bias due to the natural negative skew expected in the data, given the strong
135
physiological basis that exercise performance will not be enhanced under acute hypoxia.
136
Data analysis
137
The ratio of means (ROM) method was used to establish pooled effects and variances of hypoxic
138
interventions. This method allows outcomes of different units to be pooled and compared, whilst also
139
allowing for easy interpretation for practitioners, athletes, and coaches because outcomes can be
140
expressed as a percentage change. The natural logarithm of each ROM (equation 1) and its variance
141
(equation 2) were calculated using the mean values of sea level (𝑥̅𝑐) and hypoxia (𝑥̅𝑇), their respective
142
standard deviations (SD), number of participants (N) and a correction (r) between sea level and hypoxic
143
trial performance:
144
log(𝑅𝑜𝑀) = [log𝑥̅𝑇̇
𝑥̅𝑐] [Equation 1]
145
𝑉𝑎𝑟[𝑙𝑜𝑔(𝑅𝑜𝑀)]=(SDC)2
Ncx̅2c +
(SDT)2
NTx̅2T +
2rSDCSDT
x
̅cx̅T√NcNT [Equation 2]
146
The calculation of the variance of ROM requires knowledge of the correlation (r) between sea level and
147
hypoxic trial outcomes, which is not commonly reported. Estimates from individual studies were
148
obtained using reported t statistics as follows (equation 3):
149
𝑟 = (𝑆𝐷𝑐)2+(𝑆𝐷𝑇)2−𝑡−2𝑁(𝑥̅𝑇−𝑥̅𝑐)2
2SDCSDT [Equation 3]
150
Appropriate information was only available for 23 studies; therefore, a pooled single estimate of the
151
correlation r was calculated from the available data using the Meta package in r (R Foundation for
152
Statistical Computing, Vienna Austria). The pooled correlation value (r = 0.78, 95% confidence
153
interval: 0.62 to 0.87) was then applied to all studies. Sensitivity analyses using correlation values of r
154
A three-level mixed effects meta-regression was used to analyse ROMs and variances whilst accounting
156
for dependencies in the data set. The three levels can be described by regression equations at the sample
157
(level 1), outcome (level 2) and study (level 3) level (Van den Noortgate, López-López,
Marín-158
Martínez, & Sánchez-Meca, 2013). The fixed effects categorical moderators included exercise type
159
(TT, intermittent, TTE and Sprint), exercise duration (< 2 min, 2-10 min and > 10 min) and training
160
status (trained vs. healthy). The overall and interaction effects with altitude elevation in km equivalent
161
to the FiO2 exposure and end exercise mean difference in SaO2 between normoxic and hypoxic
162
conditions were also evaluated as continuous moderators. Furthermore, given the reported non-linear
163
relationship between acute hypoxia and VO2max (Macinnis et al., 2015) and critical power (Townsend,
164
Nichols, Skiba, Racinais, & Périard, 2017), the review also assessed curvilinear effects of altitude
165
elevation using quadratic models. Regression analyses were constrained to a zero intercept to enhance
166
external validity. Pooled effects on the logarithmic scale were subsequently back transformed and
167
multiplied by 100 to provide percentage change of effects. A normal distribution was assumed for
log-168
transformed effects and therefore 95% confidence intervals were obtained from ± 1.96 × standard error
169
and back transformed. All outcomes are reported as percentage effect estimate ± standard error and the
170
corresponding 95% confidence intervals, unless otherwise stated. All analysis was performed using the
171
metaphor package in R (R Foundation for Statistical Computing, Vienna Austria). Statistical significant
172
was assessed through 95% confidence intervals, with estimates that cross the zero-boundary interpreted
173
as non-significant.
174
Results
175
Study characteristics
176
Fifty-three studies met the inclusion criteria set for this review (Table 1), which provided effect statistics
177
for 82 outcomes within 798 participants and ranged from 500-5700 m altitude (mean ± SD: 3000 ±
178
1300 m). These studies were categorised into an exercise modality and an exercise duration category
179
for analysis. Training status was explicitly reported in 47 outcomes, with 33 cohorts classified as trained
180
(13.2% ± 7.2%). Only five studies were performed utilising hypobaric hypoxia and therefore the type
182
of hypoxic exposure was not considered as a moderator in this study.
183
Quality assessment
184
Under the GRADE research quality assessment, the overall quality is rated high due to the inclusion of
185
only randomised control trials in this review and the limited evidence to warrant the downgrading of
186
quality. Methodological limitations and bias in the included articles, were assessed against
pre-187
determined criteria, with the percentage of studies demonstrating each criterion as follows: (1) the
188
control of prior altitude/hypoxic exposure: 47%; (2) standardisation of dietary intake: 62%; (3)
189
familiarisation to exercise trials: 87%; (4) blinding of participants: 43%; (5) blinding of researcher:
190
23%; (6) blinding outcome assessment: 0%; and (7) complete outcome data: 42%.
191
Overall effect
192
The intercept only three-level mixed effects model identified a negative 17.1 ± 3.7% (95% CI -22.8%
193
to -11%) effect on all categories of exercise capacity and performance with 20.8%, 62.5% and 16.7%
194
of the variance explained by the sample, between study and between outcome variance, respectively.
195
The outcomes from the sensitivity analysis found no substantive difference in effect or variance between
196
models using r = 0.67, r = 0.87 and r = 0.77 correlation values. Acute hypoxic exposure was calculated
197
to have a significant moderating effect that equates to a 6.5% reduction for every 1000 m elevated (-6.5
198
± 0.9%; 95% CI -8.2% to -4.8%). No evidence was obtained for a non-linear effect of altitude on the
199
overall dataset. Similarly, for a 1% reduction in SaO2 a significant negative 2.0 ± 0.4% (95% CI -2.9%
200
to -1.2%) effect was reported.
201
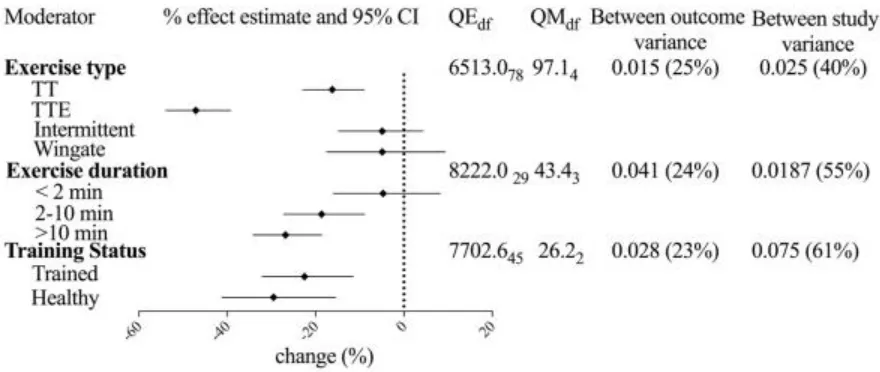
Moderating effects of exercise types
202
Exercise type was found to have a moderating effect on exercise performance under acute hypoxic
203
conditions (Figure 1), with TT performance and TTE tests experiencing a significant -16.2 ± 4.3% (95%
204
CI -22.9% to -9.0%) and -44.5 ± 6.9% (95% CI -51.3% to -36.7%) change. However, the overall effect
205
on intermittent exercise (-5.6 ± 4.8% ;95% CI -13.9% to 3.5%) and sprint performance (-2.9 ± 8.0; 95%
206
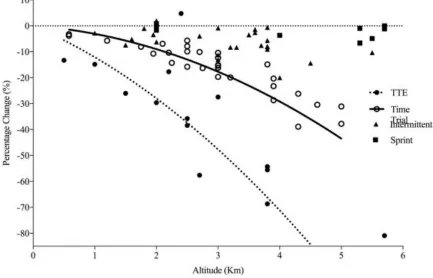
exercise type and magnitude of altitude elevation. Additionally, altitude2 moderator improved model fit
208
compared to the linear model when exercise type was included (χ(10) = 8.0; p = 0.005), indicating a
209
curvilinear effect of acute hypoxia. The exercise type category was subsequently reduced to TT and
210
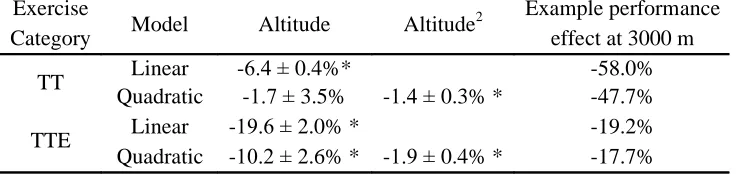
TTE sub-groups to determine the interaction effects with linear and quadratic effects of altitude
211
elevation (Table 2), which are depicted in Figure 2. The magnitude of SaO2 decline was also determined
212
to have the largest moderating effect on TTE exercise compared to the three other exercise types, with
213
a -4.5 ± 0.5% (95% CI -5.4% to -3.6%) for every 1% reduction in SaO2. A lower -1.3 ± 0.4% (95% CI
214
-2.1% to -0.5%) moderating effect for every 1% reduction in SaO2 was also evident on TT performance.
215
Moderating effects of exercise duration
216
Acute hypoxia had no effect on exercise of < 2 min duration (-6.3 ± 5.6%; 95% CI -16.1% to -3.8%),
217
however exercise between 210 min and > 10 min had a significant 18.0 ± 6.0% (95% CI 25.8% to
-218
8.2%) and -26.8 ± 5.5% (95% CI -33.2% to -18.2%) effect, respectively. A similar interaction effect
219
with altitude was also found for exercise between 2 to 10 min and > 10 min, with a negative -13.6 ±
220
2.4% (95% CI -17.8% to 9.7%) and -18.2 ± 2.1% (95% CI -21.5% to -14.8%) per 1000 m, respectively.
221
A similar moderating effect of SaO2 was noted for the 2-10 min category at -2.4 ± 0.7% (95% CI -3.8%
222
to -1.0%) and over 10 min category at -2.8 ± 0.6% (95% CI -3.9% to -1.6%) for every 1% reduction in
223
SaO2.
224
Moderating effect of training status
225
Trained and healthy individuals were found to have a pooled 21.8 ± 6.8% effect (95% CI 31.2% to
-226
11.1%) and -29.5 ± 9.6% (95% CI -41.1% to -15.5%) decline in performance with acute hypoxia,
227
respectively. Given the variance in the range of altitude elevations and greater mean elevation in the
228
healthy cohort, further analysis that controlled for altitude found a non-significant effect between
sub-229
groups. There was however, a difference in the moderating effect of SaO2 between the sub-groups, with
230
a significant moderating effect for every 1% reduction in SaO2 apparent in trained (-2.8 ± 0.5%; 95%
231
CI -3.8% to -1.7%) but not in untrained healthy participants (-2.0 ± 1.6%; 95% CI -5.1% to 1.1%).
232
Owing to the large proportion of outcomes in the intermittent exercise group also classified as < 2 min
234
(17 of the 23), the main effect in the intermittent sub-group may have been skewed. Therefore, further
235
analysis to determine the pooled effect on intermittent exercise bouts > 2 min were performed. An
236
overall pooled estimate of -4.7 ± 1.3% (95% CI -7.2% to -2.2%) was observed, however acute hypoxia
237
elevation was not found to be a significant moderator of intermittent exercise over 2 min (95% CI
-238
7.7% to 3.1%).
239
Discussion
240
This is the first meta-analysis to study the effects of acute hypoxic exposure on exercise capacity and
241
performance; and assess the effect against moderators of altitude elevation based on FiO2 tested, SaO2,
242
training status, exercise duration and type of exercise. This review is the first to show the curvilinear
243
relationship between exercise and acute hypoxic exposure during TT and TTE exercise tests, and
244
exercise activity > 2 min. In contrast, no ergolytic effect was found during intermittent exercise and
245
sprint tests; and exercise < 2 min. When exercise < 2 min were removed from the analysis of intermittent
246
exercise, a significant negative effect was seen, suggesting prolonged intermittent exercise is impaired
247
under acute hypoxic conditions. Training status was demonstrated to be a significant moderator, with
248
trained and healthy individuals exhibiting a similar negative effect. While reductions in SaO2 displayed
249
a negative moderating effect in the overall model, however these effects were more pronounced within
250
trained participants. Together, these results highlight the magnitude dependent moderating effects of
251
acute hypoxia, while also showing potential factors that are likely to influence exercise performance at
252
acute hypoxia.
253
The curvilinear relationship between exercise and hypoxic exposure is described by a quadratic model.
254
This is equivalent to the meta-analytic model previously used to describe the relationship with VO2max
255
(Macinnis et al., 2015). Furthermore, critical power (CP), a suggested marker of maximal sustainable
256
aerobic power, has been fitted to a higher order cubic model to show the negative relationship within
257
nine trained cyclists (Townsend et al., 2017). Nonetheless, this is the first study to describe a curvilinear
258
relationship during TT performance and TTE tests, given previous experimental studies have reported
259
14.5% per 1000 m up to a moderate 3000 m elevation (Wehrlin & Hallén, 2006). When comparing the
261
quadratic models of the current dataset at a hypoxic exposure equivalent to 3000 m. TTE and TT
262
performance can be predicted fall by 47.7% and 17.7%, respectively, whereas previous research would
263
suggest a 43.5% reduction in TTE and 21.0% reduction in TT performance. The small but important
264
difference in the magnitude of decline and the curvilinear model is likely to be explained by the greater
265
range of acute hypoxic magnitudes, equivalent 500 m to 5700 m elevation, in the present model, which
266
includes severe hypoxic exposures, whereas previous experimental work only assessed low and
267
moderate altitudes (< 3000 m) (Clark et al., 2007; Wehrlin & Hallén, 2006). Indeed, earlier articles that
268
also reported a curvilinear relationship, also included severe hypoxic exposures (Macinnis et al., 2015;
269
Townsend et al., 2017), which suggests alternative fatiguing mechanisms may be operating. Current
270
evidence alludes to an exacerbated central fatigue action through diminished group III/IV afferent
271
feedback with exposure to severe hypoxic conditions, whereas the central motor output is unchanged
272
from sea level at moderate hypoxic exposures (Amann, Romer, Subudhi, Pegelow, & Dempsey, 2007).
273
This diminished central motor output may, in part, explain the exponential decline in performance
274
observed with greater elevation.
275
The magnitude of the impairment with acute hypoxia is dependent on the type and duration of exercise,
276
with TT performance and TTE tests found to elicit ergolytic effects, while sprint and intermittent tests
277
found to be largely unchanged from sea level. This effect may be explained by the duration of exercise
278
within these sub-groups, given sprint exercise and the repeated sprint exercise (RSE) within the
279
intermittent group formed the < 2 min sub-group. Indeed, experimental studies assessing the various
280
magnitudes of hypoxia on RSE have only reported performance decrements above 4000 m (Bowtell et
281
al., 2014; Goods et al., 2014). However, the current model did not show this due to the assessment of
282
performance against a continuous hypoxic moderator rather than at 1000 m categorical intervals used
283
in experimental studies. Nonetheless, sprint and RSE performance, which is equivalent for the < 2 min
284
duration category, are sustained with acute hypoxia; an effect that can be explained through greater
285
reliance on anaerobic energy sources, which provides the greatest contribution to RSE and sprint
286
sub-group did however, suggest prolonged intermittent exercise is impaired under acute hypoxia, which
288
may explain the decrement in physical output during team sports competition at altitude (Aldous et al.,
289
2016). However, the moderating effect of acute hypoxia were not evident, which may be attributed to
290
the lack of available outcomes; therefore, further research should aim to assess effects of several
291
incremental magnitudes of acute hypoxia on prolonged intermittent performance.
292
The lack of effect during short duration (< 2 min) exercise bouts is also reflected in previous research
293
assessing the impact of altitude on track athletes (Hamlin, Hopkins and Hoolings, 2015) and may also
294
be mechanistically explained when viewed through the two parameter CP concept (Simpson et al. 2015;
295
Sherman et al., 2016; Townsend et al., 2017). When analysing track performances of major international
296
competitions at varying degrees of altitude, Hamlin et al., (2015) reported track sprint events (100-400
297
m) did not exhibit a negative effect associated with hypoxia, but rather, a performance improvement
298
due to the reduced aerodynamic resistance caused by the lower barometric pressure present at terrestrial
299
altitudes. Whereas, longer track events (800 -10000 m) that require a larger relative aerobic energetic
300
contribution exhibit a performance decrement at elevations ≤ 150 m. As such, demonstrating the
301
outcomes of this meta-analysis are also reflected during athletic competition. Further to this, with
302
hypoxic exposures, critical power exhibits a substantial decline in performance corresponding to the
303
performance impairment noted during longer TT and TTE exercise that requires a greater aerobic
304
contribution. Whereas, W’, the ability to perform work above CP is unchanged under moderate hypoxic
305
conditions (Simpson et al. 2015; Sherman et al., 2016; Townsend et al., 2017). Traditionally, W’ is
306
purported to represent the anaerobic work capacity and as such, the lack of change reported during
307
exercise < 2 min in the current study may be explained through the two parameter CP model.
308
There is evidence to suggest an individual variability in exercise response to acute hypoxic exposure,
309
which is predominantly accounted by superiorly trained individuals exhibiting the largest decrement
310
in VO2max (Macinnis et al., 2015) under acute hypoxic conditions, given their inability to maintain SaO2
311
during exercise compared to untrained individuals (Chapman et al., 2011). Chapman et al., (2011)
312
further identified that individuals that exhibited the greatest reductions in SaO2 during a 3000 m running
313
performance decrements between healthy and trained cohorts could not be differentiated when
315
controlling for differing hypoxic exposures. However, the moderating effects of SaO2 were more
316
evident within trained individuals with a significant 2.8 ± 0.5% fall in performance for every 1%
317
reduction in SaO2, while no significant moderating effect was noted in healthy individuals. This is
318
however, presented with a caveat as fewer outcomes were included in the healthy cohort sub-group,
319
which may have contributed to the null findings. Nonetheless, SaO2 was demonstrated to have an
320
overall moderating effect, which was most evident during TTE tests and TT performance.
321
In this review, the effects of the type of hypoxic exposure (i.e. normobaric vs hypobaric) could not be
322
evaluated due to the lack of available data. Research has suggested the different physiological response
323
to exercise between normobaria and hypobaria (Coppel, Hennis, Gilbert-Kawai, & Grocott, 2015);
324
while it is important to highlight the reduced air density at terrestrial altitude, result in fast velocities at
325
equivalent power outputs (Garvican-Lewis et al., 2015), therefore the results of this study are not
326
directly applicable to field based performance. Nonetheless, this review quantifies the non-linear
327
relationship between acute hypoxia and both TTE and TT performance, whilst also highlighting the
328
lack of effect during Sprint and RSE. Additional, noteworthy limitations to this study are apparent in
329
the interpretation of the effect of SaO2 and training status moderators. End exercise SaO2 was used in
330
the current study as opposed to mean SaO2 due the much greater frequency in measurement of the
331
former. The use of mean SaO2 would take in to account the different rates of change in oxygen saturation
332
during exercise and within exercise SaO2 may have implications for pacing, therefore further
333
experimental research should consider this effect. In the present study, training status was defined with
334
a cut off in mean VO2max to maintain objectivity of physiological fitness, however, this categorical
335
approach is limited, in that, participant cohorts may not be homogenous with VO2max of individuals
336
ranging above and below the cut off. The moderating effects of VO2max should therefore be interpreted
337
with this caveat. Nonetheless, this review offers a useful practical interpretation for practitioners,
338
coaches and athletes when planning training during a range of acute hypoxic levels. Furthermore, this
339
under acute hypoxia, particularly within trained cohorts who are suggested to experience a larger
341
Figure 1. Results from categorical moderator analysis.
QEdf: residual heterogeneity test statistic; QMdf: omnibus moderator test statistic.
Between outcome and study variance are accompanied by a percentage showing the proportion of total variance in the model that they account for.
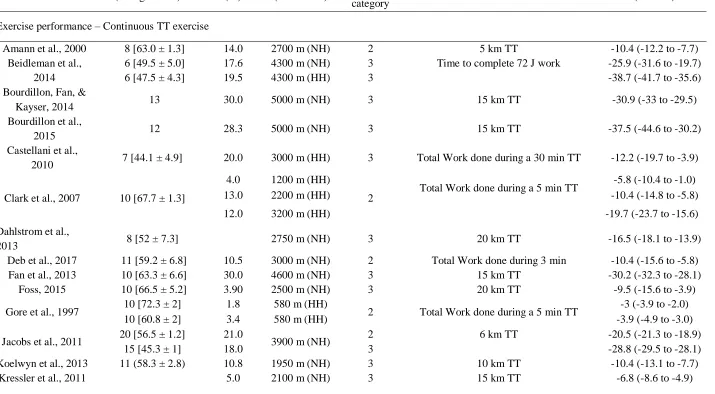
Table 1. Summary table of all outcomes by exercise type included in this review with effect and standard error of outcomes in this meta-analytic model.
Author Participants [VO2peak] (ml·kg-1·min-1)
SaO2 (%)
Altitude elevation (NH or HH)
Exercise duration category
Exercise protocol Effect (%)
(95% CI)
Exercise performance – Continuous TT exercise
Amann et al., 2000 8 [63.0 ± 1.3] 14.0 2700 m (NH) 2 5 km TT -10.4 (-12.2 to -7.7)
Beidleman et al., 2014
6 [49.5 ± 5.0] 17.6 4300 m (NH) 3 Time to complete 72 J work -25.9 (-31.6 to -19.7)
6 [47.5 ± 4.3] 19.5 4300 m (HH) 3 -38.7 (-41.7 to -35.6)
Bourdillon, Fan, &
Kayser, 2014 13 30.0 5000 m (NH) 3 15 km TT -30.9 (-33 to -29.5)
Bourdillon et al.,
2015 12 28.3 5000 m (NH) 3 15 km TT -37.5 (-44.6 to -30.2)
Castellani et al.,
2010 7 [44.1 ± 4.9] 20.0 3000 m (HH) 3 Total Work done during a 30 min TT -12.2 (-19.7 to -3.9)
Clark et al., 2007 10 [67.7 ± 1.3]
4.0 1200 m (HH)
2 Total Work done during a 5 min TT
-5.8 (-10.4 to -1.0)
13.0 2200 m (HH) -10.4 (-14.8 to -5.8)
12.0 3200 m (HH) -19.7 (-23.7 to -15.6)
Dahlstrom et al.,
2013 8 [52 ± 7.3] 2750 m (NH) 3 20 km TT -16.5 (-18.1 to -13.9)
Deb et al., 2017 11 [59.2 ± 6.8] 10.5 3000 m (NH) 2 Total Work done during 3 min -10.4 (-15.6 to -5.8)
Fan et al., 2013 10 [63.3 ± 6.6] 30.0 4600 m (NH) 3 15 km TT -30.2 (-32.3 to -28.1)
Foss, 2015 10 [66.5 ± 5.2] 3.90 2500 m (NH) 3 20 km TT -9.5 (-15.6 to -3.9)
Gore et al., 1997 10 [72.3 ± 2] 1.8 580 m (HH) 2 Total Work done during a 5 min TT -3 (-3.9 to -2.0)
10 [60.8 ± 2] 3.4 580 m (HH) -3.9 (-4.9 to -3.0)
Jacobs et al., 2011 20 [56.5 ± 1.2] 21.0 3900 m (NH) 2 6 km TT -20.5 (-21.3 to -18.9)
15 [45.3 ± 1] 18.0 3 -28.8 (-29.5 to -28.1)
Koelwyn et al., 2013 11 (58.3 ± 2.8) 10.8 1950 m (NH) 3 10 km TT -10.4 (-13.1 to -7.7)
21 [11 males: 55 ± 1.3]
10 females: [42.8 ± 0.6] 17.0 3900 m (NH) -22.9 (-25.2 to -21.3)
MacLeod et al.,
2015 11 [67.5 ± 5.8] 9.0 2500 m (NH) 3 10 km TT -15.6 (-18.9 to -13.1)
Salazar-Martínez et al.,
2017 16 [46.4 ± 8.7] 2500 m (NH) 2 Total Work done during a 10 min TT -5.8 (-11.3 to 1.0) Simpson et al.,
2015 12 [41.6 ± 6.3] 3800 m (NH) 2 Total Work done during 3 min -14.8 (-18.9 to -10.4) Périard & Racinais,
2016 12 [59.5 ± 3.8] 13 3000 m (NH) 3 Time to complete 75 J work -19.7 (-23.0 to -16.5) Peltonen et al.,
1995 6 2250 m (NH) 2 2.5 km rowing TT -13.9 (-17.3 to -11.3)
Puype et al., 2013
10 [55.1 ± 2.5] 3000 m (NH)
2 Total Work done during a 10 min TT
-14.8 (-17.3 to -13.1)
9 [53.3 ± 3.5] 3000 m (NH) -15.6 (-16.5 to -14.8)
10 [55.1 ± 1.7] 3000 m (NH) -16.5 (-18.9 to -13.9)
Shearman et al.,
2015 11 [61.5 ± 5.7] 11.4 2500 m (NH) 2 Total Work done during 3 min -7.7 (-12.2 to -3.9) Weavil et al.,
2015 7 [61.5 ± 1.4] 9 1750 m (NH) 2 5 km TT -7.7 (-11.3 to -4.9)
Exercise performance – Intermittent exercise
Aldous et al.,
2016 12 [57.0 ± 2.0] 1000 m (NH) 3 90 min intermittent soccer performance test -2.9 (-3.9 to -1.0) Billaut &
Buchheit, 2013 14 3800 m (NH) 1 10 x 10 sec sprints with 30 s rest -7.6 (-13 to -2.9)
Billaut et al., 2013 10 3300 m (NH) 1 3 sets 5 x 5 s sprints with 25 s passive
recovery -8.6 (-18.1 to 2.0)
Bowtell et al.,
2014 9
20.7 2700 m (NH)
1 10 X 6 sec sprints with 30 a rest
-3.9 (-8.6 to 1.0)
26.2 3200 m (NH) -8.6 (-12.2 to -3.9)
18.1 4500 m (NH) -14.8 (-18.1 to -10.4)
Brosnan et al.,
2000 8 [61.0 ± 4.0] 1500 m (NH)
3 3 x max work in 10 min with 5 min active
recovery (< 100w) -7.7 (-13.1 to -3.9)
2 3 sets 6 x 15 s sprints with 45 s recovery (<
100 w). 3 min recovery between sets -7.7 (-10.4 to -2.0)
Girard et al., 2015 13 8.1 1800 m (NH)) 1 8 x 5 s sprint with 25 s passive recovery -1 (-2.9 to 1.0)
15 3600 m (NH) -1 (-5.8 to 3.0)
Girard et al., 2016 6 3600 m (NH) 1 5 x 5 s sprint with 25 s passive recovery -3 (-4.9 to -1.0)
Goods et al., 2014 10
5.4 2000 m (NH)
1
3 sets 9 x 4 sec max sprints non-motorised treadmill
-5.8 (-9.5 to -3.0)
10.9 3000 m (NH) -11.3 (13.9 to -7.7)
20.2 4000 m (NH) -19.7 (-22.9 to -17.3)
Goods et al., 2016 9 -10.4 (-16.5 to -3.9)
Kon et al., 2015 7 2000 m (NH) 2 4 x 30 s all out sprint with 4 min passive
recovery
1.0 (0 to 2.0)
3500 m (NH) -3.9 (-4.9 to -2)
Morrison, McLellan, & Minahan, 2015
10 3800 m (NH) 1 4 sets of 4 x 4 sec sprints -1.0 (-3.0 to 2.0)
Lovell, McLellan,
& Minahan, 2015) 7 3800 m (NH) 1 10 x 26 sec sprint with 24 sec recovery -5.8 (-11.3 to 0) Smith & Billaut,
2010 13 12.1 3700 m (NH) 1
10 x 10 s sprint with 30 sec passive
recovery -7.7 (-10.3 to -4.9) Smith & Billaut,
2012
10 male 12.5
3700 m (NH) 1 10 x 10 s sprint with 30 sec passive recovery
-7.7 (-13.1 to -3)
10 female 14.7 -6.8 (-29.5 to -18.1)
Sweeting et al.,
2017 7 [59.5 ± 5.1]
2000 m (NH)
3 26.4 min repeated sprint protocol 2.0 (-6.7 to 11.6)
3000 m (NH) -13.1 (-23.7 to -1.0)
Anaerobic exercise – Sprint
Calbet et al., 2015 11 [50.7 ± 4.0] 5300 m (NH) 1 30 s Wingate -7.7 (-10.4 to -3.0)
Calbet et al., 2003 5 [62.0 ± 2.0] 5300 m (NH) 1 30 s Wingate -1.0 (-3.0 to 1.0)
5 [72.0 ± 1.0] -6.7 (-9.5 to -3.9)
McLellan et al.,
1990 12
15.7
5700 m (NH) 1 30 s Wingate 0 (-2.0 to 2.0)
13.7 45 s Wingate -1.0 (-3.0 to 1.0)
Morales-Alamo et
al., 2012 10 5500 m (NH) 1 30 s Wingate -4.9 (-9.5 to -1.0)
Ogura et al., 2006 7 2000 m (NH) 1 40 s Wingate 0 (-5.8 to -5.1)
4000 m (NH) -3.9 (-8.6 to 2.0)
Oguri et al., 2008 9 [62.5 ± 4.1] 8 2000 m (NH) 1 30 s Wingate 1.0 (-5.8 to 7.3)
9 [49.9 ± 5.2] 6 -2.0 (-6.8 to 3.0)
Exercise capacity – time to exhaustion tests
Amann et al.,
2007 8 [67.2 ± 2.5]
12 2700 m (NH)
2 81.4% normoxic Wpeak -57.7 (-60.1 to -55.1)
27 5700 m (NH) -81.0 (-82.1 to -79.6)
Billat et al., 2003 8 [57.3 ± 3.3] 13 3400 (NH) 2 Velocity at VO2max 5.1 (-7.7 to 19.7)
Flinn, Herbert, Graham, & Siegler, 2014
12 [53.5 ± 10.0] 2.7 3000 m (NH) 2 Intermittent 30 s work at 120% Wpeak and 30 s recovery at 30% Wpeak
-27.4 (-33.6 to -20.5)
Girard &
Racinais, 2014 11 8 2500 m (NH) 3 66% normoxic VO2peak -38.1 (-48.3 to -26.7)
Goodall et al.
2014 9 [61.1 ± 4.6] 17.4 3800 m (NH) 2
60% of the difference between the VT1 and˙VO2max
-55.5 (-62.1 to -47.8)
Heubert, Quaresima,
Laffite, Koralsztein, &
Billat, 2005
Kelly et al., 2014 13 [58.3 ± 6.3] 14 3800 m (NH) 3 75% of the difference between the VT1 and˙VO2max
-54.2 (-58.9 to -48.8)
Romer et al., 2007 9 [56.5 ± 2.7] 17 3800 m (NH) 3 92 ± 1% of Wpeak -68.7 (-70.2 to -67.0)
Wehrlin & Hallén, 2006
8 [66.0 ± 1.6]
2.8 500 m (HH)
2 107% VO2peak
-13.1 (-16.5 to -9.5)
4.8 1000 m (HH) -14.8 (-17.3 to -12.2)
7.2 1500 m (HH) -25.9 (-28.8 to -22.9)
9.8 2000 m (HH) -29.5 (-31.6 to -27.4)
12.4 2500 m (HH) -35.6 (-37.5 to -34.3)
NH: normobaric hypoxia; HH: hypobaric hypoxia.
Table 2. Linear and quadratic interaction between altitude and subgroups within exercise type, with an illustrative example of percentage effect on performance at 3000 m
*Represents a statistically significant interaction determined through 95% confidence intervals Data reported as mean ± standard error.
Intercept for all models are constrained to zero. Exercise
Category Model Altitude Altitude
2 Example performance effect at 3000 m
TT Linear -6.4 ± 0.4%* -58.0%
Quadratic -1.7 ± 3.5% -1.4 ± 0.3% * -47.7%
TTE Linear -19.6 ± 2.0% * -19.2%
1. Aldous, J. W. F., Chrismas, B. C. R., Akubat, I., Dascombe, B., Abt, G., & Taylor, L. (2016). Hot and Hypoxic Environments Inhibit Simulated Soccer Performance and Exacerbate Performance Decrements When Combined. Frontiers in Physiology, 6, 421.
https://doi.org/10.3389/fphys.2015.00421
2. Amann, M., Eldridge, M. W., Lovering, A. T., Stickland, M. K., Pegelow, D. F., & Dempsey, J. A. (2006). Arterial oxygenation influences central motor output and exercise performance via effects on peripheral locomotor muscle fatigue in humans. The Journal of Physiology,
575(Pt 3), 937–52. https://doi.org/10.1113/jphysiol.2006.113936
3. Amann, M., Romer, L. M., Subudhi, A. W., Pegelow, D. F., & Dempsey, J. A. (2007). Severity of arterial hypoxaemia affects the relative contributions of peripheral muscle fatigue to exercise performance in healthy humans. The Journal of Physiology, 581(Pt 1), 389–403. https://doi.org/10.1113/jphysiol.2007.129700
4. Beidleman, B. A., Fulco, C. S., Staab, J. E., Andrew, S. P., & Muza, S. R. (2014). Cycling performance decrement is greater in hypobaric versus normobaric hypoxia. Extreme Physiology & Medicine, 3, 8. https://doi.org/10.1186/2046-7648-3-8
5. Billat, V. L., Lepretre, P. M., Heubert, R. P., Koralsztein, J. P., & Gazeau, F. P. (2003). Influence of acute moderate hypoxia on time to exhaustion at vVO2max in unacclimatized runners. International Journal of Sports Medicine, 24(1), 9–14. https://doi.org/10.1055/s-2003-37251
6. Billaut, F., & Buchheit, M. (2013). Repeated-sprint performance and vastus lateralis
oxygenation: Effect of limited O 2 availability. Scandinavian Journal of Medicine & Science
in Sports, 23(3), e185–e193. https://doi.org/10.1111/sms.12052
7. Billaut, F., Kerris, J. P., Rodriguez, R. F., Martin, D. T., Gore, C. J., & Bishop, D. J. (2013). Interaction of Central and Peripheral Factors during Repeated Sprints at Different Levels of Arterial O2 Saturation. PLoS ONE, 8(10), e77297.
https://doi.org/10.1371/journal.pone.0077297
8. Bourdillon, N., Fan, J.-L., & Kayser, B. (2014). Cerebral oxygenation during the Richalet hypoxia sensitivity test and cycling time-trial performance in severe hypoxia. European Journal of Applied Physiology, 114(5), 1037–48. https://doi.org/10.1007/s00421-014-2835-8 9. Bourdillon, N., Fan, J.-L., Uva, B., Müller, H., Meyer, P., & Kayser, B. (2015). Effect of oral
nitrate supplementation on pulmonary hemodynamics during exercise and time trial
performance in normoxia and hypoxia: a randomized controlled trial. Frontiers in Physiology,
6, 288. https://doi.org/10.3389/fphys.2015.00288
10. Bowtell, J. L., Cooke, K., Turner, R., Mileva, K. N., & Sumners, D. P. (2014). Acute physiological and performance responses to repeated sprints in varying degrees of hypoxia.
https://doi.org/10.1016/j.jsams.2013.05.016
11. Brosnan, M. J., Martin, D. T., Hahn, A. G., Gore, C. J., & Hawley, J. A. (2000). Impaired interval exercise responses in elite female cyclists at moderate simulated altitude. Journal of Applied Physiology (Bethesda, Md. : 1985), 89(5), 1819–24.
12. Calbet, J. A. L., De Paz, J. A., Garatachea, N., Cabeza de Vaca, S., & Chavarren, J. (2003). Anaerobic energy provision does not limit Wingate exercise performance in endurance-trained cyclists. Journal of Applied Physiology, 94(2), 668–676.
https://doi.org/10.1152/japplphysiol.00128.2002
13. Calbet, J. A. L., Losa-Reyna, J., Torres-Peralta, R., Rasmussen, P., Ponce-González, J. G., Sheel, A. W., … Lundby, C. (2015). Limitations to oxygen transport and utilization during
sprint exercise in humans: evidence for a functional reserve in muscle O2 diffusing capacity.
The Journal of Physiology, 593(20), 4649–64. https://doi.org/10.1113/JP270408
14. Carr, A. J., Hopkins, W. G., & Gore, C. J. (2011). Effects of acute alkalosis and acidosis on performance: a meta-analysis. Sports Medicine (Auckland, N.Z.), 41(10), 801–14.
https://doi.org/10.2165/11591440-000000000-00000
15. Castellani, J. W., Muza, S. R., Cheuvront, S. N., Sils, I. V., Fulco, C. S., Kenefick, R. W., … Sawka, M. N. (2010). Effect of hypohydration and altitude exposure on aerobic exercise performance and acute mountain sickness. Journal of Applied Physiology, 109(6), 1792– 1800. https://doi.org/10.1152/japplphysiol.00517.2010
16. Chapman, R. F., Stager, J. M., Tanner, D. A., Stray-Gundersen, J., & Levine, B. D. (2011). Impairment of 3000-m run time at altitude is influenced by arterial oxyhemoglobin saturation.
Medicine and Science in Sports and Exercise, 43(9), 1649–56. https://doi.org/10.1249/MSS.0b013e318211bf45
17. Clark, S. A., Bourdon, P. C., Schmidt, W., Singh, B., Cable, G., Onus, K. J., … Aughey, R. J. (2007). The effect of acute simulated moderate altitude on power, performance and pacing strategies in well-trained cyclists. European Journal of Applied Physiology, 102(1), 45–55. https://doi.org/10.1007/s00421-007-0554-0
18. Coppel, J., Hennis, P., Gilbert-Kawai, E., & Grocott, M. P. (2015). The physiological effects of hypobaric hypoxia versus normobaric hypoxia: a systematic review of crossover trials.
Extreme Physiology & Medicine, 4(1), 2. https://doi.org/10.1186/s13728-014-0021-6
19. Dahlstrom, B. K., Duff, W. R. D., Poloskei, S., Schaerz, S., Len, T. K., & Neary, J. P. (2013). Neuromuscular changes following simulated high-intensity cycling performance in moderate hypoxia. Journal of Exercise Science & Fitness, 11(2), 78–84.
https://doi.org/10.1016/j.jesf.2013.10.001
21. De Pauw, K., Roelands, B., Cheung, S. S., de Geus, B., Rietjens, G., & Meeusen, R. (2013). Guidelines to classify subject groups in sport-science research. International Journal of Sports Physiology and Performance, 8(2), 111–22.
22. Deb, S. K., Gough, L. A., Sparks, S. A., & McNaughton, L. R. (2017). Determinants of curvature constant (W’) of the power duration relationship under normoxia and hypoxia: the
effect of pre-exercise alkalosis. European Journal of Applied Physiology, 117(5), 901–912. https://doi.org/10.1007/s00421-017-3574-4
23. Duffield, R., Dawson, B., & Goodman, C. (2005). Energy system contribution to 1500- and 3000-metre track running. Journal of Sports Sciences, 23(10), 993–1002.
https://doi.org/10.1080/02640410400021963
24. Fan, J.-L., Bourdillon, N., & Kayser, B. (2013). Effect of end-tidal CO2 clamping on cerebrovascular function, oxygenation, and performance during 15-km time trial cycling in severe normobaric hypoxia: the role of cerebral O2 delivery. Physiological Reports, 1(3), e00066. https://doi.org/10.1002/phy2.66
25. Flinn, S., Herbert, K., Graham, K., & Siegler, J. C. (2014). Differential effect of metabolic alkalosis and hypoxia on high-intensity cycling performance. Journal of Strength and Conditioning Research / National Strength & Conditioning Association, 28(10), 2852–8. https://doi.org/10.1519/JSC.0000000000000489
26. Foss, J. (2015). Short Term Arrival Strategies For Endurance Exercise Performance At Moderate Altitude. [dissertation]. Indianna University.
27. Garvican-Lewis, L. A., Clark, B., Martin, D. T., Schumacher, Y. O., McDonald, W., Stephens, B., … Menaspà, P. (2015). Impact of Altitude on Power Output during Cycling
Stage Racing. PLOS ONE, 10(12), e0143028. https://doi.org/10.1371/journal.pone.0143028 28. Girard, O., Brocherie, F., Morin, J.-B., & Millet, G. P. (2015). Neuro-mechanical
determinants of repeated treadmill sprints - Usefulness of an “hypoxic to normoxic recovery” approach. Frontiers in Physiology, 6, 260. https://doi.org/10.3389/fphys.2015.00260
29. Girard, O., Brocherie, F., Morin, J.-B., & Millet, G. P. (2016). Running mechanical alterations during repeated treadmill sprints in hot versus hypoxic environments. A pilot study. Journal of Sports Sciences, 34(12), 1190–1198.
https://doi.org/10.1080/02640414.2015.1101482
30. Girard, O., & Racinais, S. (2014). Combining heat stress and moderate hypoxia reduces cycling time to exhaustion without modifying neuromuscular fatigue characteristics.
European Journal of Applied Physiology, 114(7), 1521–32. https://doi.org/10.1007/s00421-014-2883-0
32. Goods, P. S. R., Dawson, B., Landers, G. J., Gore, C. J., Croft, K., & Peeling, P. (2016). Effect of repeat-sprint training in hypoxia on post-exercise interleukin-6 and F 2 -isoprostanes.
European Journal of Sport Science, 16(8), 1047–1054. https://doi.org/10.1080/17461391.2015.1123776
33. Goods, P. S. R., Dawson, B. T., Landers, G. J., Gore, C. J., & Peeling, P. (2014). Effect of Different Simulated Altitudes on Repeat-Sprint Performance in Team-Sport Athletes.
International Journal of Sports Physiology and Performance, 9(5), 857–862. https://doi.org/10.1123/ijspp.2013-0423
34. Gore, C. J., Little, S. C., Hahn, A. G., Scroop, G. C., Norton, K. I., Bourdon, P. C., … Emonson, D. L. (1997). Reduced performance of male and female athletes at 580 m altitude.
European Journal of Applied Physiology and Occupational Physiology, 75(2), 136–43. https://doi.org/10.1007/s004210050138
35. Hamlin, M.J., Hopkins, W.G., & Hollings, S.C. (2015) Effects of altitude on performance of elite track-and-field athletes. Int J Sports Physiol Perform. 10(7), 881 -887. https://doi: 10.1123/ijspp.2014-0261
36. Heubert, R. A. P., Quaresima, V., Laffite, L. P., Koralsztein, J. P., & Billat, V. L. (2005). Acute Moderate Hypoxia Affects the Oxygen Desaturation and the Performance but not the Oxygen Uptake Response. International Journal of Sports Medicine, 26(7), 542–551. https://doi.org/10.1055/s-2004-821329
37. Horscroft, J. A., & Murray, A. J. (2014). Skeletal muscle energy metabolism in
environmental hypoxia: climbing towards consensus. Extreme Physiology & Medicine, 3(1), 19. https://doi.org/10.1186/2046-7648-3-19
38. Jacobs, K. A., Kressler, J., Stoutenberg, M., Roos, B. A., & Friedlander, A. L. (2011). Sildenafil Has Little Influence on Cardiovascular Hemodynamics or 6-km Time Trial
Performance in Trained Men and Women at Simulated High Altitude. High Altitude Medicine & Biology, 12(3), 215–222. https://doi.org/10.1089/ham.2011.0011
39. Kelly, J., Vanhatalo, A., Bailey, S. J., Wylie, L. J., Tucker, C., List, S., … Jones, A. M. (2014). Dietary nitrate supplementation: effects on plasma nitrite and pulmonary O2 uptake dynamics during exercise in hypoxia and normoxia. AJP: Regulatory, Integrative and Comparative Physiology, 307(7), R920–R930. https://doi.org/10.1152/ajpregu.00068.2014 40. Koelwyn, G. J., Wong, L. E., Kennedy, M. D., & Eves, N. D. (2013). The effect of hypoxia
and exercise on heart rate variability, immune response, and orthostatic stress. Scandinavian Journal of Medicine & Science in Sports, 23(1), e1–e8. https://doi.org/10.1111/sms.12003 41. Kon, M., Nakagaki, K., Ebi, Y., Nishiyama, T., & Russell, A. P. (2015). Hormonal and
Jacobs, K. A. (2011). Sildenafil does not improve steady state cardiovascular hemodynamics, peak power, or 15-km time trial cycling performance at simulated moderate or high altitudes in men and women. European Journal of Applied Physiology, 111(12), 3031–3040.
https://doi.org/10.1007/s00421-011-1930-3
43. Macinnis, M. J., Nugent, S. F., Macleod, K. E., & Lohse, K. R. (2015). Methods to Estimate V˙O2max upon Acute Hypoxia Exposure. Medicine & Science in Sports & Exercise, 47(9),
1869–1876. https://doi.org/10.1249/MSS.0000000000000628
44. MacLeod, K. E., Nugent, S. F., Barr, S. I., Koehle, M. S., Sporer, B. C., & MacInnis, M. J. (2015). Acute Beetroot Juice Supplementation Does Not Improve Cycling Performance in Normoxia or Moderate Hypoxia. International Journal of Sport Nutrition and Exercise Metabolism, 25(4), 359–66. https://doi.org/10.1123/ijsnem.2014-0129
45. McLellan, T. M., Kavanagh, M. F., & Jacobs, I. (1990). The effect of hypoxia on
performance during 30 s or 45 s of supramaximal exercise. European Journal of Applied Physiology and Occupational Physiology, 60(2), 155–61.
46. Morales-Alamo, D., Ponce-González, J. G., Guadalupe-Grau, A., Rodríguez-García, L., Santana, A., Cusso, M. R., … Calbet, J. A. L. (2012). Increased oxidative stress and
anaerobic energy release, but blunted Thr172-AMPKα phosphorylation, in response to sprint exercise in severe acute hypoxia in humans. Journal of Applied Physiology, 113(6).
47. Morrison, J., McLellan, C., & Minahan, C. (2015). A Clustered Repeated-Sprint Running Protocol for Team-Sport Athletes Performed in Normobaric Hypoxia. Journal of Sports Science & Medicine, 14(4), 857–63.
48. Ogura, Y., Katamoto, S., Uchimaru, J., Takahashi, K., & Naito, H. (2006). Effects of low and high levels of moderate hypoxia on anaerobic energy release during supramaximal cycle exercise. European Journal of Applied Physiology, 98(1), 41–7.
https://doi.org/10.1007/s00421-006-0214-9
49. Oguri, K., Fujimoto, H., Sugimori, H., Miyamoto, K., Tachi, T., Nagasaki, S., … Matsuoka, T. (2008). Pronounced muscle deoxygenation during supramaximal exercise under simulated hypoxia in sprint athletes. Journal of Sports Science & Medicine, 7(4), 512–9.
50. Peltonen, J. E., Rantamäki, J., Niittymäki, S. P., Sweins, K., Viitasalo, J. T., & Rusko, H. K. (1995). Effects of oxygen fraction in inspired air on rowing performance. Medicine and Science in Sports and Exercise, 27(4), 573–9.
51. Périard, J. D., & Racinais, S. (2016). Performance and Pacing during Cycle Exercise in Hyperthermic and Hypoxic Conditions. Medicine & Science in Sports & Exercise, 48(5), 845–853. https://doi.org/10.1249/MSS.0000000000000839
53. Romer, L. M., Haverkamp, H. C., Amann, M., Lovering, A. T., Pegelow, D. F., & Dempsey, J. A. (2007). Effect of acute severe hypoxia on peripheral fatigue and endurance capacity in healthy humans. American Journal of Physiology. Regulatory, Integrative and Comparative Physiology, 292(1), R598-606. https://doi.org/10.1152/ajpregu.00269.2006
54. Salazar-Martínez, E., Gatterer, H., Burtscher, M., Naranjo Orellana, J., & Santalla, A. (2017). Influence of Inspiratory Muscle Training on Ventilatory Efficiency and Cycling Performance in Normoxia and Hypoxia. Frontiers in Physiology, 8, 133.
https://doi.org/10.3389/fphys.2017.00133
55. Scott, B. R., Goods, P. S. R., & Slattery, K. M. (2016). High-Intensity Exercise in Hypoxia: Is Increased Reliance on Anaerobic Metabolism Important? Frontiers in Physiology, 7, 637. https://doi.org/10.3389/fphys.2016.00637
56. Shearman, S., Dwyer, D., Skiba, P., & Townsend, N. (2015). Modeling Intermittent Cycling Performance in Hypoxia Using the Critical Power Concept. Medicine and Science in Sports and Exercise. https://doi.org/10.1249/MSS.0000000000000794
57. Simpson, L. P., Jones, A. M., Skiba, P. F., Vanhatalo, A., & Wilkerson, D. (2015). Influence of hypoxia on the power-duration relationship during high-intensity exercise. International Journal of Sports Medicine, 36(2), 113–9. https://doi.org/10.1055/s-0034-1389943
58. Smith, K. J., & Billaut, F. (2010). Influence of cerebral and muscle oxygenation on repeated-sprint ability. European Journal of Applied Physiology, 109(5), 989–999.
https://doi.org/10.1007/s00421-010-1444-4
59. Smith, K. J., & Billaut, F. (2012). Tissue oxygenation in men and women during repeated-sprint exercise. International Journal of Sports Physiology and Performance, 7(1), 59–67. 60. Sweeting, A. J., Billaut, F., Varley, M. C., Rodriguez, R. F., Hopkins, W. G., & Aughey, R. J.
(2017). Variations in Hypoxia Impairs Muscle Oxygenation and Performance during Simulated Team-Sport Running. Frontiers in Physiology, 8, 80.
https://doi.org/10.3389/fphys.2017.00080
61. Townsend, N. E., Nichols, D. S., Skiba, P. F., Racinais, S., & Périard, J. D. (2017). Prediction of Critical Power and W’ in Hypoxia: Application to Work-Balance Modelling. Frontiers in Physiology, 8, 180. https://doi.org/10.3389/fphys.2017.00180
62. Turner, G., Gibson, O. R., & Maxwell, N. S. (2014). Simulated moderate hypoxia reduces intermittent sprint performance in games players. The Journal of Sports Medicine and Physical Fitness, 54(5), 566–74.
63. Van den Noortgate, W., López-López, J. A., Marín-Martínez, F., & Sánchez-Meca, J. (2013). Three-level meta-analysis of dependent effect sizes. Behavior Research Methods, 45(2), 576– 594. https://doi.org/10.3758/s13428-012-0261-6
flow limitation. European Journal of Applied Physiology, 115(8), 1653–1663. https://doi.org/10.1007/s00421-015-3145-5
65. Wehrlin, J. P., & Hallén, J. (2006). Linear decrease in .VO2max and performance with increasing altitude in endurance athletes. European Journal of Applied Physiology, 96(4), 404–12. https://doi.org/10.1007/s00421-005-0081-9
66. Witmer, C. A. (2011). Effects of acute exposure to moderate hypoxia during different phases of repeated-sprint cycling on fatigue and anaerobic power reserve :[Dissertations. Temple University .
67. Wyatt, F. (2014). Journal of Exercise Physiologyonline Editor-in-Chief JEPonline Physiological Responses to Altitude: A Brief Review, 17(1).