Vol.7 (2017) No. 4
ISSN: 2088-5334
Investigating the Relationship between the Reflected Near Infrared
Light and the Internal Quality of Pineapples Using Neural Network
Mohamad Nur Hakim Jam
#, Kim Seng Chia
*#,*
Faculty of Electrical and Electronic Engineering, Universiti Tun Hussein Onn Malaysia, 86400 Parit Raja,
Batu Pahat, Johor, Malaysia
E-mail:* [email protected],# [email protected]
Abstract— One of the important internal qualities of pineapples is the total soluble solid content (SSC). Normally, the SSC can be evaluated using a reflectometer that is destructive and time-consuming. This research investigates the relationship between the reflected near infrared light and the internal quality of pineapples non-destructively. Five light emitted diodes (LEDs) that are in the range between 750 nm and 950 nm were used as the light source. The photodiode (OPT101) sensor was used to collect the light from the pineapple. The digital reflectometer was used to determine the reference SSC. The Near-infrared (NIR) data and the digital refractometer data were used to build the predictive model. The relationship between the near infrared light and the SSC of the pineapple was determined using artificial neural network predictive model. The internal quality of pineapples was determined using five NIR data wavelengths, the result points out that the k-fold cross-validation accurate classification was 75.56%. Besides, findings indicate that the artificial neural network that used four wavelengths that were 780 nm, 850 nm, 870 nm, and 940 nm achieved better classification than that used five wavelengths that included 910 nm. Thus, the artificial neural network coupled with NIR light is promising to be used to classify the internal quality of pineapples non-destructively.
Keywords— neural network; pineapple; near infrared light; internal quality
I. INTRODUCTION
Pineapple maturity is evaluated by the fruit eye flatness, the extent of skin yellowing and by the aroma. Pineapples take 3-5 months to reach maturity [1]. The highest fruit quality is if the fruit matures on the plant. Pineapples harvested prematurity do not continue to ripen or sweeten because of there is no starch reserves in the fruit to be converted to sugar [1]. The pineapples maturity is related to the changes in rind texture, juice composition and taste [2]. Besides that, the pineapples acidity increases during the fruit growth, as the fruit approach maturity and start to ripen, the acidity will drops [3]. Moreover, the physical, chemical and sensorial characters of pineapples show significant changed at different maturation stages [2]. Furthermore, the quality of the pineapples can be obtained by separating it into only maturity classes [4]. The pineapples were classified into three stage of maturity [3]. Green pineapple, half-ripe pineapple, and ripe pineapple are the three stages involved in the process of maturation of the pineapple [5]. Likewise, it can be separated as class A greater than 50%
translucent yellow, class B having 25-50% translucent yellow, and class C less than 25% translucent yellow [4].
the SSC value of pineapple is different from bottom to top [9]. By applying the same method by Sasathorn Srivichien, the pineapple can be separated into three-part that is top, middle, and bottom [10].
Near infrared is a quick, low-cost and non-destructive technique of analysis to distinguish between varieties and measure internal properties of fruits [11]. Near infrared uses light of wavelengths between the visible and the infrared region [12]. The use of shortwave near infrared region from 700-1100 nm can be accessed using inexpensive detectors and has been investigated in studies using various measurement modes such as reflectance, transmission, and interanctance [13]. Shortwave NIR can be applied to thicker samples and can yield information on the internal attributes of biological material such as sugar and water content [14]. NIR has been tested for measurement of SSC in several types of fruit [15]. Usually, the NIR region that is observed is C-H, N-H, O-H, and S-H bonds of organic components [11]. The NIR region radiation is observed by different chemical bonds such as C-H, C=O, and O-H of sugar present in the samples [16]. The calibrations of sugar content of intact fruit should be based on O-H and C-H features, emphasising the C-H feature to be less sensitive to temperature [14]. In the previous study shows that the pineapple can be scanning using spectrophotometer using reflectance mode in the range between 700 nm and 1100 nm [17].
In order to obtain information from the fruit, multiple wavelengths are used. Each of wavelength only provides light scattering information at one spectral band which is insufficient for predicting the internal quality of fruit [18]. In this research five NIR LEDs is used to obtain the information. Each wavelength will collect different information about the fruit. At a range of 760 nm wavelength, the water absorbance bands were strong as presented for the second and third harmonics of the fundamental O-H stretching vibration [19]. 850 nm is closed to the third combination overtone of sugar O-H stretching at 840 nm [20]. At 870 nm the absorption of the valley of water and oxygen is strong [21]. At 910 nm it is related to the third C-H stretch overtone and at 940 nm the water absorbance bands for the second and third harmonics of the fundamental O-H stretching vibration is strong [19].
The artificial neural network has a good capability of self-learning and self-adapting that considered as a powerful tool for pattern recognition [22]. ANN has the ability to solve regression and classification problem using supervised learning methods [23]. This ANN gains popularity because the can tolerate noise data to predict or classify patterns with the data that have not been trained on [24]. More than that, ANN learns from the relationship between input parameters and controlled or uncontrolled variables by referring to previous trends in data as non-linear regression [25].
The ANN architecture consists three parts that are input layers where it receives the input from the outside, the hidden layers are to restrict the interaction between neurons and output layers, as a result of the output network [26]. Therefore, ANN is very effective in predicting any outcome by learning from some predicting data, where the theoretical relation between the input variable and the output variable is quite complicated or there is no known theory at all [27].
The aim of this research to determine the relationship between the near infrared light and the internal quality of pineapples by means the total soluble content of the fruits.
II. MATERIALS AND METHODS
This section gives a brief explanation about the process of collecting data and data processing by using neural network. Furthermore, the predictive model is explained in this section.
A. Pineapple Samples
Four pineapples were bought from the store at Parit Raja, Batu Pahat, Johor. The pineapples are selected randomly but with the same size. Before the experiments, the samples were transported to the laboratory immediately. The pineapples were stored at room temperature overnight to release field heat [11]. On the next day, the pineapples were marked using pins and divided into three parts that are top, middle, and bottom. Each of the parts consists four pins which will be scanned using near infrared light and digital refractometer.
B. Near Infrared Light Measurements
The near-infrared light data were collected in diffuse reflectance mode using portable near infrared light that was built. The portable near infrared light consisted of five LEDs in a range of 750 nm and 950 nm. The photodiode detector (OPT101) was used to collect the light that was reflected from the pineapples. For each LEDs, an average of five scans was performed at each mark.
C. Reference determination Soluble Solid Content (SSC)
The pineapple was cut by using stainless steel apple corer at the pin area. Same size of each area will be taken out. Then, the selected area is crush using a crusher to get the juice. After that, the juice is measured using digital refractometer (PAL-1, Atago, Tokyo, Japan). The SSC was expressed in ˚Brix.
D. Data Processing
The total number of sample NIR data is 48 from 4 fruits. One fruit will contain 12 samples NIR data. The result is shown in Brix unit. From the result, the Brix reading is in the range of 8 and 14. This Brix result is separated into three section that is below 10 is classified as class C, between 10 and 12 as class B, and above 12 is classified as class A. After separate the NIR data into three, the NIR data was arranged by class starting from class C, followed by class B and lastly class A.
E. Artificial Neural Network
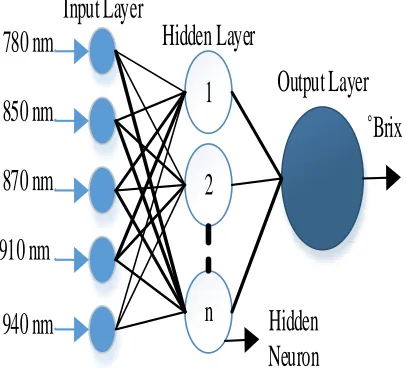
neuron is adjusted in between one and ten. The output layer consists the ˚Brix information.
1
2
n
Input Layer
Hidden Layer
Output Layer
Hidden
Neuron
˚Brix
780 nm
850 nm
870 nm
910 nm
940 nm
Fig. 1 The basic structure of ANN consists of Input Layer, Hidden Layer, and Output Layer
Scaled conjugate gradient (SCG) is a supervised learning algorithm that updates weight and bias values based on scaled conjugate gradient method [29]. By using a step size scaling mechanism SCG is avoiding time-consuming. The line-search per iteration is faster than the second-order algorithms [30]. An exploration is performed on the conjugate direction that produces faster convergence. SCG is a direct method because it provides the accurate solution of a limited number of iteration [31]. When the number of iteration increases, the number of computations per iteration is significantly low [29].
The process to build the predictive model were shown in Fig. 2. The data was collected by using near infrared light consists of five different wavelengths as a non-destructive method and using digital reflectometer as the destructive method. To remove the unwanted data from the data set several methods have been used such as by using boxplot, pre-neural network, and leave one out cross validation. By using boxplot the outlier value that was outside the interquartile ranges was removed from the data set. After that, the preliminary result of the neural network was tested
to obtain the correct classification before removing the data set.
The number of hidden neuron in the neural network was tuned to determine the best result for training and testing. This trial and error technique was used to estimate any nonlinear function with any level of accuracy, and it was used to investigate for the best model for the performance distribution prediction [32]. Next, the predictive model performance is improved by applying the leave-one-one cross-validation.
Then, in the training process, the predictive model is trained and tested again by tuning the randomseed and hidden neuron.
The predictive model is validated using K-fold validation. Afterwards, by removing one wavelength data, the data set was trained and tested again using the same predictive model. Lastly, the k-fold validation is performed by only using four wavelength data.
F. Validation
K-fold validation is used to validate the neural network. The k value is set to three. Each set consists of 15 samples. This set select samples randomly including three classes that are class A, class B, and class C. Each class will be brought to test once and the remaining sample will be in training. The hidden neuron is set in the range of one to ten. More than that, the random seed is adjusted to find the precise result.
III. RESULTS AND DISCUSSION
A. Data analysis
Class A consists of 13 samples where three of the samples is taken randomly for testing and the remaining samples are used for training. For class B, from 24 samples five samples are used for testing and the remaining is for training. While for class C, two samples out of 11 are used for testing and the remaining is used for training. The total samples for training are 38 and 10 samples for testing.
The results of the SSC from the pineapples obtained agreed with the previous work carried out by E.V Miller [6] that, the total soluble solid content is lower at the top and higher at the bottom of the pineapples.
Validation
Training
Collect data (NIR light data
and Brix data)
Boxplot
48 Samples
Pre-Neural network
Training = 38 samples
Testing = 10 samples
Leave one out
Training = 47 samples
Testing = 1 sample
Neural network
Training = 36 samples
Testing = 9 samples
K-fold validation
K= 3
Training = 30 samples
Testing = 15 samples
Remove one wavelength data
Training = 36 samples
Testing = 9 samples
K-fold validation
K=3
Training = 30 samples
Testing = 15 samples
Pre-processing
B. Artificial neural network
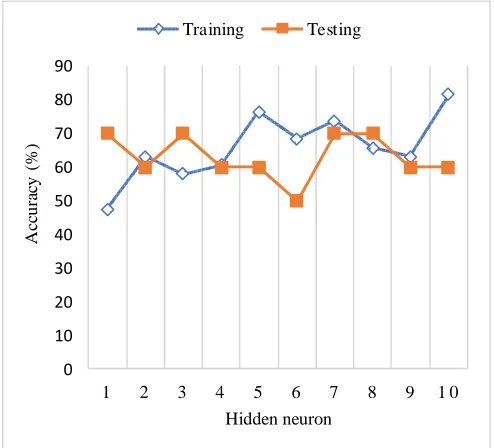
Fig. 3 shows the percentage of misclassification for training and testing. From 38 samples that are used for training and 10 samples for testing the best result show that when the hidden neuron is seven where the accuracy for training is 73.68% and 70% for testing. The best result is selected based on the lower number of misclassification for training and testing.
0 10 20 30 40 50 60 70 80 90
1 2 3 4 5 6 7 8 9 1 0
A
cc
u
ra
cy
(
%
)
Hidden neuron Training Testing
Fig. 3 The training and testing of the neural network predictive model without removing the outlier
Based on the Fig. 4 the most accurate result is when the hidden neuron is five. The percentage of correct classification is 69.44% where from 36 samples for training 25 are incorrect classified. While for testing, from nine samples there are seven samples are correct classified with 77.78%. For others hidden neuron the percentage of testing is almost the same in between 70-90%. The highest percentage of correct training is when the hidden neuron is five.
0 10 20 30 40 50 60 70 80 90 100
1 2 3 4 5 6 7 8 9 10
A
cc
u
ra
cy
(%
)
Hidden neuron
Training Testing
Fig. 4 The training and testing of the neural network predictive model after removing the outlier
By comparing Fig. 3 and Fig. 4 it is shown that the testing result for Fig. 4 is much better to compare in Fig. 3 this is because the percentage of accuracy is higher in Fig. 4. This is due to the sample that has been removed from the data set after the pre-processing process and therefore the result of the correct classification is increased. As for training, Fig.3 shows the percentage of correct classification are in the range of 40-80%. While in Fig. 4 it is shown that result is more consistent in range of 60–70%. Therefore, by removing the outlier in the pre-processing process its helps the predictive model to predict the NIR data precisely.
C. Validation
Fig. 5 shows the number of hidden neuron versus accuracy of the classification for the internal quality of pineapples. As can be seen, the graph in Fig. 5 plotted that the most accurate result is when the hidden neuron is four where the percentage of correct classification is 71.11%. This shows that from 45 samples 13 of the samples is predicted wrongly. Based on these result, the lowest correct classification is when the hidden neurons are one and two. It is shown that the correct classification is 60%, where the number of the mistaken classification is 18. Most of the results show 68.89% of correct classification which is hidden neuron five, seven, eight, nine and ten.
60 60
66.
67
71.
11
68.
89
66.
67
68.
89
68.
89
68.
89
68.
89
0 10 20 30 40 50 60 70 80 90 100
1 2 3 4 5 6 7 8 9 10
A
cc
ur
ac
y
(
%
)
Hidden neuron
Fig. 5 The percentage of incorrect classification using k-fold validation
D. Remove one wavelength NIR data
is when the data for 870 nm and 940 nm is removed. The results show that the percentage is 66.67% accurate classified. 7 2 .2 2 6 3 .8 9 6 6 .6
7 75 72.2
2 7 7 .7 8 7 7 .7 8 6 6 .6 7 1 0 0 6 6 .6 7 0 10 20 30 40 50 60 70 80 90 100
780 nm 850 nm 870 nm 910 nm 940 nm
A cc ur ac y (% )
The LED that was removed
Training Testing
Fig. 6 The best result for training and testing when one wavelength data is removed from the data set using neural network predictive model
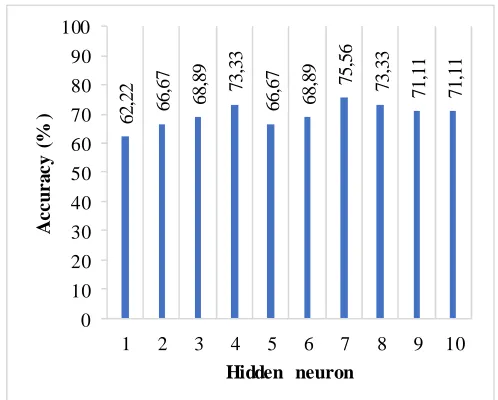
E. Validation after removing 910 nm wavelength
The bar chart in Fig. 7 shows the result after removing 910 nm wavelength from the data set. The hidden neuron and the random seed is adjusted to select the best percentage of correct classification. The lowest percentage classification accuracy is when the hidden neuron is one where 17 from 45 samples is incorrect to classify. From the result, hidden neuron seven shows the best result with 75.56% accurate classification. The number of incorrect samples was 11 from 45 samples.
6 2 ,2 2 6 6 ,6 7 6 8 ,8 9 7 3 ,3 3 6 6 ,6 7 6 8 ,8 9 7 5 ,5 6 7 3 ,3 3 7 1 ,1 1 7 1 ,1 1 0 10 20 30 40 50 60 70 80 90 100
1 2 3 4 5 6 7 8 9 10
A c c u r a c y ( % )
Hidden neuron
Fig. 7 The result of k-fold validation to validate the predictive model after removing 910 nm wavelength data
Based on Fig. 6 considering 910 nm wavelength, the results indicate the testing and training result of the neural
network misclassification. While by referring to Fig. 7 the results express the validation of the predictive model. To validate the predictive model, the K-Fold Cross Validation was applied as shown in Fig. 7. Therefore, after removing the 910 nm wavelength the result of the K-fold validation is better to compared in Fig. 5. The percentage of accurate classification for K-fold validation was 3% higher after removing the 910 nm wavelength.
IV.CONCLUSION
In this research, it can be observed that the relationship between near infrared light and the internal quality of pineapples can be build using artificial neural network to predict the internal quality of pineapples. By tunning the number of hidden neuron and the random seed in the neural network, the predictive model could classify the near infrared light from LED data to classify the class of the pineapples. The predictive model was optimized using k-fold validation. After optimizing the random seed and the hidden neuron the predictive model is capable of achieving 75.56% accurate classification. Findings suggest that there is a better relationship between the solid soluble content of pineapples and the reflected near infrared light if the 910 nm was excluded. This shows that the neural network coupled with near-infrared light is capable of classifying the internal quality of the pineapples non-destructively.
Further research should be conducted to evaluate the potential of the predictive model in the analysis of the near infrared data from pineapples. Further studies can be performed in large samples number to predict the internal quality of pineapples.
ACKNOWLEDGMENT
This study was partially sponsored by Research and innovation fund, Office for Research, Innovation, Commercialization and Consultancy Management (ORICC), Geran Penyelidikan Pascasiswazah (GPPS) (U461), UTHM, and Geran Jangka Pendek (U351) UTHM. Authors would like to thank the university and Advanced Mechatronic Research Group (AdMiRe), FKEE, UTHM for providing facilities for this study.
REFERENCES
[1] R. Moyle, D. J. Fairbairn, J. Ripi, M. Crowe, and J. R. Botella, “Developing pineapple fruit has a small transcriptome dominated by metallothionein,” J. Exp. Bot., vol. 56, no. 409, pp. 101–112, 2005. [2] N. Hajar, S. Zainal, K. Z. Nadzirah, S. Roha, O. Atikah, and T. Elida,
“Physicochemical Properties Analysis of Three Indexes Pineapple (Ananas Comosus) Peel Extract Variety N36,” APCBEE Procedia, vol. 4, no. 4, pp. 115–121, 2012.
[3] P. Saradhuldhat and R. E. Paull, “Pineapple organic acid metabolism and accumulation during fruit development,” Sci. Hortic. (Amsterdam)., vol. 112, no. 3, pp. 297–303, 2007.
[4] S. Pathaveerat, A. Terdwongworakul, and A. Phaungsombut, “Multivariate data analysis for classification of pineapple maturity,” J. Food Eng., vol. 89, no. 2, pp. 112–118, 2008.
[5] L. Angel, S. Lizcano, J. Viola, and U. P. Bolivariana, “Assessing the State of Maturation of the Pineapple in its Perolera Variety Using Computer Vision Techniques,” in Signal Processing, Images and Computer Vision (STSIVA), 2015, vol. 20th Sympo, pp. 1–6. [6] E. V Miller and G. D. Hall, “Distribution of Total Soluble Solids,
[7] S. Rosnah, W. R. Wan Daud, T. Mohd Sobri, and H. Osman, “Physico-mechanical properties of the Josapine pineapple fruits,” in Pertanika Journal of Science & Technology, 2009, vol. 17, no. 1, pp. 117–123.
[8] J. Guthrie, B. Walsh, and K. Walsh, “Non-invasive assessment of pineapple and mango fruit quality using near infra-red spectroscopy,” Aust. J. Exp. Agric., vol. 37, p. 253–63 264, 1997. [9] K. S. Chia, H. Abdul Rahim, and R. Abdul Rahim, “Prediction of
soluble solids content of pineapple via non-invasive low cost visible and shortwave near infrared spectroscopy and artificial neural network,” Biosyst. Eng., vol. 113, no. 2, pp. 158–165, 2012. [10] S. Srivichien, A. Terdwongworakul, and S. Teerachaichayut,
“Quantitative prediction of nitrate level in intact pineapple using Vis-NIRS,” J. Food Eng., vol. 150, pp. 29–34, 2015.
[11] M. Li, W. Lv, R. Zhao, H. Guo, J. Liu, and D. Han, “Non-destructive assessment of quality parameters in ‘Friar’ plums during low temperature storage using visible/near infrared spectroscopy,” Food Control, vol. 73, pp. 1334–1341, 2017.
[12] P. F. Stanbury, A. Whitaker, and S. J. Hall, “Instrumentation and control,” in Principles of fermentation technology, Third Edit., Elsevier, 2017, pp. 487–536.
[13] H. Milk, S. Sabbatucci, D. Riordan, and J. Walsh, “Development of Short - Range Near Infrared Scatter Sensor for the Determination of Fat Content in Homogenised Milk,” in ISSC, 2014, pp. 30–34. [14] M. Golic, K. Walsh, and P. Lawson, “Short-wavelength
near-infrared spectra of sucrose, glucose, and fructose with respect to sugar concentration and temperature,” Appl. Spectrosc., vol. 57, no. 2, pp. 139–145, 2003.
[15] S. Escribano, W. V. Biasi, R. Lerud, D. C. Slaughter, and E. J. Mitcham, “Non-destructive prediction of soluble solids and dry matter content using NIR spectroscopy and its relationship with sensory quality in sweet cherries,” Postharvest Biol. Technol., vol. 128, pp. 112–120, 2017.
[16] X. Zhao, B. Hui, L. Hu, Q. Cheng, B. K. Via, R. Nadel, T. Starkey, and S. Enebak, “Potential of near infrared spectroscopy to monitor variations in soluble sugars in Loblolly pine seedlings after cold acclimation,” Agric. For. Meteorol., vol. 232, pp. 536–542, 2017. [17] B. M. Nicolai, K. Beullens, E. Bobelyn, A. Peirs, W. Saeys, K. I.
Theron, and J. Lammertyn, “Nondestructive measurement of fruit and vegetable quality by means of NIR spectroscopy: A review,” Postharvest Biol. Technol., vol. 46, no. 2, pp. 99–118, 2007. [18] M. Liu, D. Wumao, and H. Lin, “The study of non-destructive
measurement apple ’ s firmness and soluble solid content using multispectral imaging,” in International Conference on Computer and Computing Technologies in Agriculture. Springer US, 2008, pp. 1077–1086.
[19] Y. Liu, X. Sun, H. Zhang, and O. Aiguo, “Nondestructive measurement of internal quality of Nanfeng mandarin fruit by charge coupled device near infrared spectroscopy,” Comput. Electron. Agric., vol. 71, no. SUPPL. 1, pp. 10–14, 2010.
[20] V. Giovenzana, R. Civelli, R. Beghi, R. Oberti, and R. Guidetti, “Testing of a simplified LED based vis/NIR system for rapid ripeness evaluation of white grape (Vitis vinifera L.) for Franciacorta wine.,” Talanta, vol. 144, pp. 584–91, 2015.
[21] Y. Zhang, L. Zheng, M. Li, X. Deng, and R. Ji, “Predicting apple sugar content based on spectral characteristics of apple tree leaf in different phenological phases,” Comput. Electron. Agric., vol. 112, pp. 20–27, 2015.
[22] I. E. Livieris and P. Pintelas, “A new class of nonmonotone conjugate gradient training algorithms,” Appl. Math. Comput., vol. 266, pp. 404–413, 2015.
[23] V. K. Ojha, A. Abraham, and V. Snášel, “Metaheuristic design of feedforward neural networks: A review of two decades of research,” Eng. Appl. Artif. Intell., vol. 60, no. December 2016, pp. 97–116, 2017.
[24] A. H. Manek, “Comparative Study of Neural Network Architectures for Rainfall Prediction,” in International Conference on Technological Innovations in ICT For Agriculture and Rural Development (TIAR 2016), 2016, pp. 171–174.
[25] R. C. Deo and M. Şahin, “Application of the Artificial Neural Network model for prediction of monthly Standardized Precipitation and Evapotranspiration Index using hydrometeorological parameters and climate indices in eastern Australia,” Atmos. Res., vol. 161–162, pp. 65–81, 2015.
[26] D. Dharma. Silalahi, C. E. Reaño, F. P. Lansigan, R. G. Panopio, and N. C. Bantayan, “Using Genetic Algorithm Neural Network on Near Infrared Spectral Data for Ripeness Grading of Oil Palm (Elaeis guineensis Jacq.) Fresh Fruit,” Inf. Process. Agric., vol. 3, pp. 252–261, 2016.
[27] M. S. Hossain, Z. C. Ong, Z. Ismail, S. Noroozi, and S. Y. Khoo, “Artificial neural networks for vibration based inverse parametric identifications: A review,” Appl. Soft Comput., vol. 52, pp. 203–219, 2017.
[28] C. K. On, T. K. Yau, R. Alfred, J. Teo, P. Anthony, and W. Cheng, “Backpropagation Neural Ensemble for Localizing and Recognizing Non-Standardized Malaysia ’ s Car Plates,” Int. J. Adv. Sci. Eng. Inf. Technol., vol. 6, no. 6, pp. 1112–1119, 2016.
[29] M. Mia and N. Ranjan, “Prediction of surface roughness in hard turning under high pressure coolant using Artificial Neural Network,” Measurement, vol. 92, pp. 464–474, 2016.
[30] J. Orozco and C. A. R. García, “Detecting Pathologies from Infant Cry Applying Scaled Conjugate Gradient Neural Networks,” in European Symposium on Artificial Neural Networks, 2003, no. April, pp. 349–354.
[31] V. K. Garg and R. K. Bansal, “Comparison of neural network back propagation algorithms for early detection of sleep disorders,” in Conference Proceeding - 2015 International Conference on Advances in Computer Engineering and Applications, ICACEA 2015, 2015, pp. 71–75.