ISSN 0975-928X
Research Article
Non parametric measures to investigate genotype x environment
interaction for feed barley genotypes evaluated under multi environment
trials
Ajay Verma*, J. Singh, V. Kumar, A.S. Kharab and G.P. Singh ICAR-Indian Institute of Wheat & Barley Research, Karnal 132001 Haryana
E-mail: [email protected]
(Received: 03 May 2017; Revised: 20 Aug 2017; Accepted: 27 Aug 2017)
Abstract
In the present investigation g x e interaction of twenty seven feed barley genotypes were evaluated at fifteen locations by non parametric measures. Results based on nonparametric measures do not require distributional assumptions for testing of effects. JB322 was high yielder followed by PL890 & HUB250 among studied genotypes. CMR and CSD measures pointed towards HUB113, NDB1634 and UPB1054, JB322 as desirable genotypes by respective measures. Si1 and Si2 measures identified JB322 and UPB1054 along with UPB1054 & HUB 113 as of stable yield performance. Values of the sum of Zi1 and Zi2 denotedsignificant differences among feed barley genotypes across 15 studied environments. Genotypes UPB1054, HUB113, BH1005 based on Si3 and Si6 were identified as the stable genotypes whereas KB1436 & RD2552 were unstable. First two NPs were very similar for unstable performance of RD2552 and last two NPs for similar behaviour of HUB250. Biplot analysis observed highly significant negative rank correlation of yield with corrected mean yield, SD and no significant correlation with MR.
Key words
Non-parametric measures, Spearman rank correlation, Ward’s hierarchical clustering, biplot analysis Introduction
Genotype × environment interaction reflects the change in response of cultivars across the environments (Rasoli et al., 2015). Recently GxE interaction has been considered a perquisite to point out cultivars’ recommendation for general or specific adaptation (Farshadfar et al., 2014). Interpretation of GxE interaction as well as yield stability was feasible in different crops using nonparametric strategy as several nonparametric measures had observed in literature (Nassar and Hühn, 1987). These measures are mainly based on the ranks, rij, or adjusted ranks, r*ij, as per genotypes responses in each environment. One of the major concerns is to categorize stable genotypes based on similar rankings across environments. Some measures consider only stability of genotypes like Si
3 and Si
4
while others like Si
1 , Si
2
combine both yield and stability to propose an ideal genotype. Four non-parametric stability measures, NPi(1) , NPi(2) , NPi(3) & NPi(4) based on ranks calculated from adjusted yield proposed by Thennarasu, 1995. Association among non parametric measures helped breeder to choose most informative measure for reliable prediction of cultivar behaviors (Mahtabi et al., 2013).
The objectives of this study were to (i) identify feed barley genotypes by nonparametric measures possessing high yield along with stable performance across different test environments (ii) study the relationships among different nonparametric stability statistics.
Materials and methods
Twenty seven feed barley genotypes were used as plant material for this study. Cultivars were grown in 15 environments. The field experimental layout was of randomized complete block design with four replications in each environment. All agronomical practices were followed as per zone wise recommendations for considered locations. Grain yield of each cultivar was recorded on a plot basis. For a two-way classification of kgenotypes into n environments Xij, denotes the phenotypic value of ith genotype in jth environment where i= 1,2 , ,...k, j=1,2,..., n,and rij as the rank of the ith genotype in the jth environment, and was the average rank of the ith genotype across considered environments. Nonparametric measures based on corrected yield to remove the effect of genotype from phenotypic value as (X*ij = Xij - .+ ) as
X*ij, was the corrected phenotypic value; . was the mean of ith genotype in all environments and
was the grand mean (Mortazavian and Azizinia, 2014). The genotype with the lowest adjusted yield was given highest rank and vice versa for highest adjusted yielder (Rasoli et al., 2015). Stable genotypes would show similar ranks over environments; i.e. maximum stability occurs with equal ranks over environments.
Electronic Journal of Plant Breeding, 8(3): 849-856 (September 2017) ISSN 0975-928X
DOI: 10.5958/0975-928X.2017.00135.1
Thennarasu (1995) proposed the nonparametric stability measures NPi(1) , NPi(2) , NPi(3) and NPi(4) ,based on ranks of adjusted means of genotypes, as those whose position in relation to the others remained unaltered in the set of environments. In the above formulas, r*ij was the rank of X*ij, and and Mdi were the mean and median ranks for original yield, where * and M*di were the same parameters computed from the corrected yield values.
All nonparametric stability statistics calculated using SAS-based program, and Microsoft Excel (Hussein et al., 2000). To understand relationships among stability methods, principal component analysis (PCA) based on rank correlation matrices and to group different parameters into clusters, hierarchical cluster analysis were performed. Spearman’s coefficient of rank correlation was employed to statistically compare the non parametric measures used in this study.
Results and discussion
According to mean yield, genotype JB322 (41.9 q/ha) followed by PL890 & HUB250 while large variation observed in yield values among genotypes. As per the mean of ranks, KB1436 and PB891 showed higher values over environments while SD pointed towards JB322 and UPB1054 and regarding to CMR and CSD the desirable genotypes would be HUB113, NDB1634 & UPB1054, JB322 respectively. The effect of correction and removing the genotype effect from phenotypic data is in agreement with Karimizadeh
et al. (2012). According to CV & corrected CV
nonparametric measures contain mean and standard deviation of ranks, genotypes KB1436 &
KB1434 UPB1054, JB322 identified as the stable genotypes respectively whereas HUB250, BH946 & DWRB156, BH946 as unstable (Mortazavian and Azizinia, 2014). Genotypes JB322 and UPB1054 along with UPB1054 & HUB 113 with minimum two nonparametric Si1 and Si2 measures where. Si
1
estimate considered all possible pair-wise rank differences, while Si2 was based on variances of ranks for each genotype across environments. These statistics ranked genotypes similarly for stability. Genotype RD2552 was most unstable by both measures. Further significance tests of Si1 and Si2 developed by Nassar and Huehn (1987). For each feed barley genotype, Zi1 and Zi2 values were calculated as per ranks of adjusted yield and summed over genotypes to obtain total Z
values. Since sum of Zi1 = 41.49 and Zi2 = 92.51 were more than the critical value of 2 = 27.58, there were significant differences among 27 feed barley genotypes across 15 studied environments (Rasoli et al., 2015). Inspecting the individual Z values, it was found that some genotypes were significantly unstable relative to others, because large Z values were observed as compared to the critical value of 2 at 5% level of significance i.e. 3.84.
Non-parametric statistics of Si3 and Si6 combine yield and stability based on yield ranks of genotypes in each environment. Genotypes UPB1054, HUB113, BH1005 based on Si3 and Si6 statistics were identified as the stable genotypes at the same time KB1436 and RD2552 were unstable by both measures. The numerical value of Si
3 is determined by both yield and stability. Among these stable genotypes, PL890 had relatively high yield.
Nonparametric measures Si1, Si2, Si3, Si4, Si5 and Si6 identified UPB1054, HUB113 & BH1005 as the stable genotypes at the same times KB1436 & RD2552 as unstable genotypes (Karimizadeh et al., 2012). Nonparametric stability indices judged different genotypes i.e. NPi(1) pointed towards JB322 and UPB1054 as stable in comparison to others and RD2552 along BH946 unstable while , genotype PB891 showed lowest value NPi(2) followed by KB1434 and because of high value stabilities of BH946 & RD2552 were low, NPi(3) unlike NPi
(2)
identified BH1005 as the most stable followed by BH949. The unstable genotypes based on NPi(3) were JB322 & HUB250 . Stability parameters NPi(4) like NPi(2) identified PB891 & KB1434 and BH946 but like NPi
(3)
pointed towards unstable performance of HUB250 (Khalili and Aboughadareh, 2016). The results of first two NPs were very similar for unstable performance of RD2552 and last two NPs towards HUB250 as unstable genotypes (Table 2).
Cluster Analysis: To better reveal associations
ISSN 0975-928X
genotypes’ mean yield and ranks based on different nonparametric stability measures, was performed further using a clustering procedure. The dissimilarity between two clusters is shown by the “loss of information” from joining the two clusters with this loss of information measured by the increase in error sum of squares. First cluster consisted of high yielding genotypes JB322, PL890, BH 902 and JB325. Second cluster consisted of genotypes DWR156, RD2552 and BH946 were of unstable performance. Third cluster consisted of moderate to high yielder with moderate stable genotypes HUB250, BH946 and DWRB156. Rest of remaining genotypes clustered in last group.
Biplot analysis: Principal component analysis
based on rank correlation matrices was performed to understand the relationship among the nonparametric measures. For better visualization, the first two principal components (PC1 and PC2) were plotted against each other (Figure 2). Table 3 shows the loading of the first two PCA of ranks of non parametric measures as two first PCs (PC1 and PC2) explained 83.8% (52.4 and 31.4 % by PC1 and PC2, respectively) of the total variance. Biplot classified the stability measures in 3 groups. The lines that connect the stability estimates to the biplot origin are called stability vectors. An acute angle between the vectors of two stability indices approximates the positive correlation between them while an obtuse angle reveals independence or very weak correlation between these stability measures. Yield shows a highly significant negative rank correlation with corrected mean yield, SD whereas no correlation with MR. This result was also shown by Karimzadeh et al (2012). In this plot, CV showed high correlation with NPi
(2) , NPi
(3)
and NPi (4)
, corrected mean of rank (CMR). Sabaghnia et al. (2012) reported NPi(2) was similar in concept to GE interaction measures as it defines stability in the sense of biological concept. Also there is significant positive correlation of SD with CV, Si1, Si2 , Si3, Si4, Si5 & Si6 while yield expressed negative correlation with these measures. However, Mahtabi et al. (2013) found significantly and negatively correlated between mean yield and Si3 ,Si6, NPi(2) and NPi(4) measures that is in contradiction with our result. They referred the high correlation between mean yield and stability statistics to higher values of these statistics for high yielding genotypes. Meanwhile, also showed Si6 has more strongly correlated with mean yield. Karimzadeh et al.,
(2012) reported that the parameters Si 1
and Si 2
were nearly perfectly associated for grain yield in winter wheat.
Relationship among nonparametric statistics:
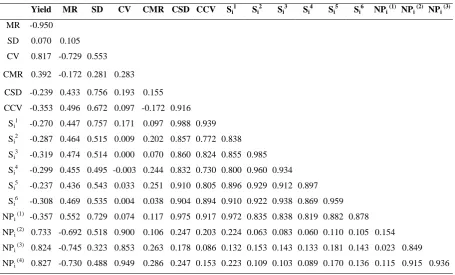
Spearman’s rank correlations calculated among ranks generated by genotype ranking as per different non parametric measures. Highly
significant (p<0.01) positive rank correlation of yield observed with CV with NPi (2) NPi (3) NPi (4) whereas negative withMR (Mahtabi et al., 2013). Significant positive correlation of MR seen with CSD, CCV, CV, Si1, Si2, Si3, Si4, Si5, Si5, NPi(1) and negative with CV as well as with NPi(2), NPi(3), NPi
(4)
. SD expressed positive correlation of moderate to higher order with all considered measures. CV maintained significant positive correlation with NPi (2) NPi (3) NPi (4) and surprisingly very low correlation with Si2, Si3, Si4, Si6. Also CSD had a highly significant positive association with Si1, Si2, Si3, Si4, Si5, Si5 (Khalili and Aboughadareh, 2016). Similar behavior had shown by CCV. Highly significant positive correlation expressed by Sis among themselves. Very low correlation observed among NPi(s) except of NPi(4). Measures NPi(1) and NPi(4) showed significant correlation with other measures. CD and CCV were observed good measures as both had significantly high (p<0.01) positive rank correlation with Sis.
Acknowledgement
The multi-environment trials of barley genotypes were performed within the AICW&BIP project at centers across the country. Authors are grateful to all the staff of testing centers for their hard work to carry out the field evaluation and data recording.
References
Farshadfar, E., Mahmudi N. and Sheibanirad A. 2014. Nonparametric methods for interpreting genotype×environment interaction in bread wheat genotypes. J. Bio. & Env. Sci. 4: 55-62. Hussein, M.A., Bjornstad A. and Aastveit A.H. 2000.
SASG× ESTAB: a SAS program for computing genotype× environment stability statistics.
Agronomy Journal,92: 454-459.
Karimizadeh, R., Mohammadi M., Sabaghnia N. and Shefazadeh M.K. 2012. Using Huehn’s nonparametric stability statistics to investigate genotype × environment interaction. Not. Bot. Horti. Agrobo.40: 195-200.
Khalili M., and Pour-Aboughadareh A. 2016.Parametric and non-parametric measures for evaluating yield stability and adaptability in barley doubled haploid lines. J. Agr. Sci. Tech. 18: 789-803 Mahtabi, E., Farshadfar E. and Jowkar M.M. 2013. Non
parametric estimation of phenotypic stability in Chickpea (Cicer arietinum L.). International Journal of Agriculture and Crop Sciences5: 888-895.
Mortazavian, S.M.M. and Azizinia S. 2014. Non-parametric stability analysis in multi-environment trial of canola. Turkish Journal Field Crops, 19(1): 108-117.
Nassar, R. and Huehn, M. 1987. Studies on estimation of phenotypic stability: Tests of significance for nonparametric measures of phenotypic stability.
Biometrics: 45-53.
Electronic Journal of Plant Breeding, 8(3): 849-856 (September 2017) ISSN 0975-928X
DOI: 10.5958/0975-928X.2017.00135.1 L.) by non parametric method J. Agr. Sci. Tech.
17: 1279-1289
Sabaghnia, N., Karimizadeh R. and Mohammadi M. 2012. The use of corrected and uncorrected nonparametric stability measurements in durum wheat multi-environmental trials. Spanish Journal of Agricultural Research,10: 722-730. Thennarasu, K. 1995. On Certain Non-Parametric
ISSN 0975-928X
Table 1. Environmental conditions and parentage details of barley genotypes
Code Genotype Parentage Locations Latitude Longitude Altitude (m)
IVTIRFB-1 KB1436 LAKHAN/JB137 Durgapur
a 26 ͦ 51 'N 75 ͦ 47 ' E 390
IVTIRFB-2 BH959 BH393/BH331 Hisar 29 ͦ 10 'N 75 ͦ 46 ' E 215.2
IVTIRFB-3 RD2922 RD2809/RD2743 Ludhiana 30o54 ' N 75o 52' E 247
IVTIRFB-4 HUB250 RD2618/RD2660 Tabiji 26 ͦ 35'N 74 ͦ 61' E 456.1
IVTIRFB-5 BH1004 33rd IBON200/BH902 Pant nagar 29 o02 ' N 79 ͦ 48' E 237 IVTIRFB-6 UPB1054 IBYT-LRA-M-12(Sr.No.27 of EIBGN 2013-14) Karnal 29 ͦ 43 ' N 76 ͦ 58 ' E 252 IVTIRFB-7 PL890 DWRUB52/DWRUB62 Varanasi 25 ͦ 20 ' N 83 ͦ 03 ' E 75.5
IVTIRFB-8 JB325 RD2615/DL88 Rewa 24 ͦ 31 ' N 81 ͦ 15 ' E 365.7
IVTIRFB-9 BH1006 15th HBSN-4/BH902 Faizabad 26 ͦ 47 'N 82 ͦ 12 ' E 113 IVTIRFB-10 HUB113 KARAN280/C138 Kanpur 26 ͦ 29 ' N 80 ͦ 18 ' E 125.9 IVTIRFB-11 KB1434
GLORIA-BAR/COPAL//PM5/BEN/3/SEN/4/PETUNIA1/5/ BBSC/CONGONA// BLLU/3/CIRU
Sabour 25 ͦ 24 ' N 87 ͦ 04 ' E 41 IVTIRFB-12 RD2786 RD2634/NDB1020//K425 SK Nagar 24 ͦ 19 ' N 72 ͦ 19 ' E 154.5
IVTIRFB-13 BH902 BH495/RD2552 Sagar 23 ͦ 83 ' N 78 ͦ 73 ' E 523
IVTIRFB-14 JB322 JB101/BH331 Morena 26 ͦ 56 ' N 78 ͦ 80 ' E 152
IVTIRFB-15 UPB1053 IBYT-MRA-12(Sr.No.35 of EIBGN 2013-14) Udaipur 24 ͦ 34 ' N 70 ͦ 42 ' E 582 IVTIRFB-16 PB891 IBON 343/12th HSBN-176
IVTIRFB-17 BH1005 BHMS24A/WG127 IVTIRFB-18 HUB249 RD2618/RD2660 IVTIRFB-19 NDB1634 IBON-HI-40 (2009-10 IVTIRFB-20 BH946 BHMS22A/BH549//RD2552 IVTIRFB-21 RD2923 RD2552/RD2786
IVTIRFB-22 KB1425 K508/NDB1295 IVTIRFB-23 DWRB157
ALANDA02/4/ARIZONA5908/ATHS//ASSE/3/F 208.74/5/ALANDA/3/CI08887/CI05761//LIGNEE 640-34
IVTIRFB-24 RD2921 RD2508/RD2743 IVTIRFB-25 JB319 LAKHAN/BH353 IVTIRFB-26 RD2552 RD2035/DL472
Electronic Journal of Plant Breeding, 8(3): 849-856 (September 2017)
ISSN 0975-928X DOI: 10.5958/0975-928X.2017.00135.1
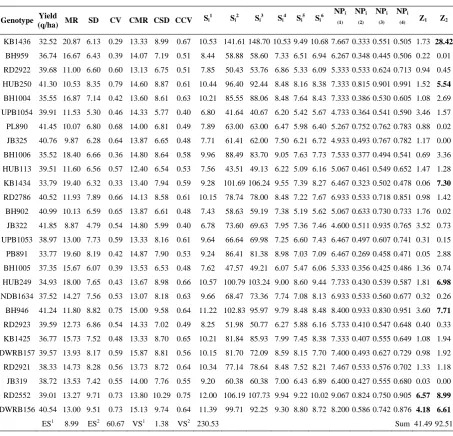
Table 2. Descriptive statistics and non parametric measures for grain yield
Genotype Yield
(q/ha) MR SD CV CMR CSD CCV Si
1 S
i2 Si3 Si4 Si5 Si6
NPi (1)
NPi (2)
NPi (3)
NPi
(4) Z1 Z2
KB1436 32.52 20.87 6.13 0.29 13.33 8.99 0.67 10.53 141.61 148.70 10.53 9.49 10.68 7.667 0.333 0.551 0.505 1.73 28.42 BH959 36.74 16.67 6.43 0.39 14.07 7.19 0.51 8.44 58.88 58.60 7.33 6.51 6.94 6.267 0.348 0.445 0.506 0.22 0.01 RD2922 39.68 11.00 6.60 0.60 13.13 6.75 0.51 7.85 50.43 53.76 6.86 5.33 6.09 5.333 0.533 0.624 0.713 0.94 0.45 HUB250 41.30 10.53 8.35 0.79 14.60 8.87 0.61 10.44 96.40 92.44 8.48 8.16 8.38 7.333 0.815 0.901 0.991 1.52 5.54 BH1004 35.55 16.87 7.14 0.42 13.60 8.61 0.63 10.21 85.55 88.06 8.48 7.64 8.43 7.333 0.386 0.530 0.605 1.08 2.69 UPB1054 39.91 11.53 5.30 0.46 14.33 5.77 0.40 6.80 41.64 40.67 6.20 5.42 5.67 4.733 0.364 0.541 0.590 3.46 1.57 PL890 41.45 10.07 6.80 0.68 14.00 6.81 0.49 7.89 63.00 63.00 6.47 5.98 6.40 5.267 0.752 0.762 0.783 0.88 0.02 JB325 40.76 9.87 6.28 0.64 13.87 6.65 0.48 7.71 61.41 62.00 7.50 6.21 6.72 4.933 0.493 0.767 0.782 1.17 0.00 BH1006 35.52 18.40 6.66 0.36 14.80 8.64 0.58 9.96 88.49 83.70 9.05 7.63 7.73 7.533 0.377 0.494 0.541 0.69 3.36 HUB113 39.51 11.60 6.56 0.57 12.40 6.54 0.53 7.56 43.51 49.13 6.22 5.09 6.16 5.067 0.461 0.549 0.652 1.47 1.28 KB1434 33.79 19.40 6.32 0.33 13.40 7.94 0.59 9.28 101.69 106.24 9.55 7.39 8.27 6.467 0.323 0.502 0.478 0.06 7.30 RD2786 40.52 11.93 7.89 0.66 14.13 8.58 0.61 10.15 78.74 78.00 8.48 7.22 7.67 6.933 0.533 0.718 0.851 0.98 1.42 BH902 40.99 10.13 6.59 0.65 13.87 6.61 0.48 7.43 58.63 59.19 7.38 5.19 5.62 5.067 0.633 0.730 0.733 1.76 0.02 JB322 41.85 8.87 4.79 0.54 14.80 5.99 0.40 6.78 73.60 69.63 7.95 7.36 7.46 4.600 0.511 0.935 0.765 3.52 0.73 UPB1053 38.97 13.00 7.73 0.59 13.33 8.16 0.61 9.64 66.64 69.98 7.25 6.60 7.43 6.467 0.497 0.607 0.741 0.31 0.15 PB891 33.77 19.60 8.19 0.42 14.87 7.90 0.53 9.24 86.41 81.38 8.98 7.03 7.09 6.467 0.269 0.458 0.471 0.05 2.88 BH1005 37.35 15.67 6.07 0.39 13.53 6.53 0.48 7.62 47.57 49.21 6.07 5.47 6.06 5.333 0.356 0.425 0.486 1.36 0.74 HUB249 34.93 18.00 7.65 0.43 13.67 8.98 0.66 10.57 100.79 103.24 9.00 8.60 9.44 7.733 0.430 0.539 0.587 1.81 6.98 NDB1634 37.52 14.27 7.56 0.53 13.07 8.18 0.63 9.66 68.47 73.36 7.74 7.08 8.13 6.933 0.533 0.560 0.677 0.32 0.26 BH946 41.24 11.80 8.82 0.75 15.00 9.58 0.64 11.22 102.83 95.97 9.79 8.48 8.48 8.400 0.933 0.830 0.951 3.60 7.71 RD2923 39.59 12.73 6.86 0.54 14.33 7.02 0.49 8.25 51.98 50.77 6.27 5.88 6.16 5.733 0.410 0.547 0.648 0.40 0.33 KB1425 36.77 15.73 7.52 0.48 13.33 8.70 0.65 10.21 81.84 85.93 7.99 7.45 8.38 7.333 0.407 0.555 0.649 1.08 1.94 DWRB157 39.57 13.93 8.17 0.59 15.87 8.81 0.56 10.15 81.70 72.09 8.59 8.15 7.70 7.400 0.493 0.627 0.729 0.98 1.92 RD2921 38.33 14.73 8.28 0.56 13.73 8.72 0.64 10.34 77.14 78.64 8.48 7.52 8.21 7.467 0.533 0.576 0.702 1.33 1.18 JB319 38.72 13.53 7.42 0.55 14.00 7.76 0.55 9.20 60.38 60.38 7.00 6.43 6.89 6.400 0.427 0.555 0.680 0.03 0.00 RD2552 39.01 13.27 9.71 0.73 13.80 10.29 0.75 12.00 106.19 107.73 9.94 9.22 10.02 9.067 0.824 0.750 0.905 6.57 8.99 DWRB156 40.54 13.00 9.51 0.73 15.13 9.74 0.64 11.39 99.71 92.25 9.30 8.80 8.72 8.200 0.586 0.742 0.876 4.18 6.61
ISSN 0975-928X
Table 3. Loadings of ranks derived from measures
83.79 Component PC1
Component PC2 Yield -0.121 0.397
MR 0.156 -0.374
SD 0.238 0.172
CV 0.028 0.421
CMR 0.067 0.144
CSD 0.324 0.040
CCV 0.305 -0.010
Si1 0.322 0.033
Si2 0.308 -0.053
Si3 0.300 -0.087
Si4 0.306 -0.037
Si5 0.318 0.006
Si6 0.315 -0.049
NPi1 0.320 0.013
NPi2 0.094 0.380
NPi3 0.044 0.377
NPi4 0.083 0.415
% Variance 52.38 31.41
Fig.1: Biplot of PC1 verses PC2 for non parametric measures
Table 4. Spearman rank correlation among measures for feed barley genotypes
Yield MR SD CV CMR CSD CCV Si 1
Si 2
Si 3
Si 4
Si 5
Si 6
NPi (1)
NPi (2)
NPi (3)
MR -0.950 SD 0.070 0.105 CV 0.817 -0.729 0.553 CMR 0.392 -0.172 0.281 0.283
CSD -0.239 0.433 0.756 0.193 0.155 CCV -0.353 0.496 0.672 0.097 -0.172 0.916
Si 1
-0.270 0.447 0.757 0.171 0.097 0.988 0.939 Si2 -0.287 0.464 0.515 0.009 0.202 0.857 0.772 0.838 Si3 -0.319 0.474 0.514 0.000 0.070 0.860 0.824 0.855 0.985 Si
4
-0.299 0.455 0.495 -0.003 0.244 0.832 0.730 0.800 0.960 0.934 Si
5
Electronic Journal of Plant Breeding, 8(3): 849-856 (September 2017)
ISSN 0975-928X DOI: 10.5958/0975-928X.2017.00135.1