Understanding the integration of buses and metro systems
using smart card data
Diao Lin
*, Ruoxin Zhu
Chair of Cartography, Technical University of Munich. Diao Lin, [email protected]
Ruoxin Zhu, [email protected] * Corresponding author
Abstract: Buses are considered as an important type of feeder model for urban metro systems. It is important to understand the integration of buses and metro systems for promoting public transportation. Using smart card data generated by automatic fare collection systems, we aim at exploring the characteristics of bus-and-metro integration. Taking Shanghai as a case study, we first introduced a rule-based method to extract metro trips and bus-and-metro trips from the raw smart card records. Based on the identified trips, we conducted three analyses to explore the characteristics of bus-and-metro integration. The first analysis showed that 46% users have at least two times of using buses to access metro stations during five weekdays. By combining the ridership of metro and bus-and-metro, the second analysis examined how the share of buses as the feeder mode change across space and time. Results showed that the share of buses as the feeder mode in morning peak hours is much larger than in afternoon peak hours, and metro stations away from the city center tend to have a larger share. Pearson correlation test was employed in the third analysis to explore the factors associated with the ratios of bus-and-metro trips. The metro station density and access metro duration are positively associated with the ratios. The number of bus lines around 100 m to 400 m of metro stations all showed a negative association, and the coefficient for 200 m is the largest. In addition, the temporal differences of the coefficients also suggest the importance of a factor might change with respect to different times. These results enhanced our understanding of the integration of buses and metro systems.
Keywords: Spatiotemporal analysis, Smart card data, Metro systems, Feeder buses
1.
Introduction
Metro systems are a preferred public transport mode worldwide, because of their fast speed and high passenger capacity. An increasing number of cities are constructing metro systems to cope with challenges related to urban sprawl, traffic congestion, and air pollution, in particular in China. Building a metro system that covers every point in a city is difficult due to the high costs of construction and some policy limitations (e.g. historical zones). Additionally, a preferred metro station is not always easily accessible by non-motorized transport modes (e.g. walking or biking). Thereby, to improve the accessibilities of the metro systems, many feeder bus lines are built around the metro stations. Besides increasing the metro accessibilities, the integration of buses and metro systems also plays a vital role in ensuring the success of multimodal transport systems. A well-designed bus-metro transport network can improve the overall accessibility of public transport, offering chances to increase public transport use. Therefore, it is essential to understand the integration of buses and metro systems.
According to the literature (Goel and Tiwari, 2016; Pan et al., 2010), buses are commonly reported as an important type of feeder mode for the metro systems. A number of cities in China have launched policies (e.g. free or
discounted transfer) to encourage the integration of buses and metro systems, such as Beijing and Shanghai. In addition, some cities outside China also offer similar policies. For instance, the “T Money” service in Seoul allows a free transfer between buses and metro systems (Sun et al., 2017).
Over the past decades, automatic fare collection systems (AFCs) have been introduced to many cities, offering a convenient way to acquire data related to public transport use. Compared with traditional data sources, such as travel surveys or diaries, the large-scale smart card (SC) data generated by AFCs are easier to collect (Ma et al., 2012). Additionally, the SC data usually are recorded at a finer spatiotemporal scale. Many studies have demonstrated the effectiveness of SC data in transport-related research, such as transit ridership modeling (Sun et al., 2017; Tu et al., 2018) and commuting pattern mining (Ma et al., 2017).
correlated with bus-and-metro ridership and the share of buses as the feeder mode.
2.
Literature review
Depending on the feeder mode, studies related to the feeder services of public transit can be classified into four categories: walk-and-ride, bike-and-ride, park-and-ride, and bus-and-ride (Daniels and Mulley, 2013; El-Geneidy et al., 2014). This study belongs to the category of and-ride. We thereby focus on the studies related to bus-and-ride below.
Many studies related to the bus-and-ride have been focused on the transfer between buses and public transit (e.g. rail and metro). Tyrinopoulos and Antoniou (2008) discussed factors that related to the quality of public transportation transfer from three aspects, the distances between the transfer points, the waiting time, and the information provision at the transit stations. Results showed that the transfer quality plays a critical role in the overall quality of public transit. Seaborn, Attanucci and Wilson (2009) validated the usefulness of SC data in identifying the transfer trips by comparing with the London Travel Demand Survey (LTDS). Jang (2010) utilized SC data to estimate the travel time and identified the transfer points that need to be improved based on the transfer time. Hu et al. (2012) proposed a model to optimize the feeder buses of trail transit and showed the effectiveness of the proposed model. Zhao et al. (2017) proposed a method to isolate transfer points with longer transfer times and many passengers by using SC data. According to them, the decay time is reflected as an critical component of the total transfer time. Wang et al. (2018) characterized the interchange from bus to metro based on four aspects: the average transfer time, average Euclidean and network distance between metro and its feeding bus stops, and average transfer demand. The k-means clustering method was applied to identify the transfer points that need improvements. Some studies have a pitucular interest in methods for extracting the bus-and-ride trips from SC data. For instance, (Ma et al., 2012) proposed a Markov chain-based method to extract the boarding location of bus trips from raw SC records. Using the bus trajectory and the boarding time of buses, Tu et al. (2018) presented an interpolation-based method to extract the boarding locations of bus trips.
3.
Methodology
3.1 Data
The dataset used in this study covers the SC transaction records generated in a normal week in 2015 of Shanghai, with a total number of 98.2 million transaction records. Each record includes seven fields: user ID, date, time, bus line ID or metro station name, transportation mode, fee, discount. In Shanghai, the smart card can be used for the payment of systems such as metro, bus, taxi, ferry, and parking, which can be distinguished by the field of transportation mode. In this study, only the records correspond to buses and metro lines are used for the following analysis. In Shanghai, 80% of public
transportation is paid by using smart cards1, which somehow guarantee the representativeness of the SC data for research related to public transportation. Other data related to metro stations and bus lines were collected via Gaode map API (one of the leading map services in China).
3.2 Trip identification
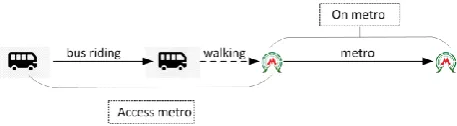
There are three types of trips need to be extracted, i.e., bus trips, metro trips, and and-metro trips. A bus-and-metro trip in this study is illustrated by an example in Figure 1. The trip starts with a bus journey with the aim of accessing metro stations. After alighting from buses, a user walking from the alighting bus station to the aimed metro station. The egress part after the alighting from the metro station is not considered in this study. Each bus-and-metro trip is split into two parts: access metro part and on metro part. The access metro includes the buses journey and walking journey.
Figure 1. An example of a bus-and-metro trip.
Since each bus transaction record corresponds to a bus trip, it is easy to identify the bus trips. For the identification of a metro trip, two transaction records are required, corresponding to the tap-in and tap out of the metro trip, respectively. Normally, a metro trip is started with a record of fare equal to 0 and ended with a non-zero fare, because users are only required to pay at the point of tap-out. Based on this, by chronologically sorting the records for each user, it is easy to extract the metro trips. Users with an odd‐numbered transaction record are ignored in this study. In addition, metro trips with abnormal time durations are ignored as well.
Based on the identified bus and metro trips, we need to identify the bus-and-metro trips from the metro trips. Since the transaction records of buses have no information (i.e., time and location) related to the bus alighting in our dataset. The commonly used constraint elapsed time-based method cannot be applied directly (Seaborn et al., 2009). In Shanghai, if a user has a bus transaction record within 2 hours before the tap-in time of the metro, the user can get a discount of 1 Yuan. By using this information, we identify if a metro trip belongs a bus-and-metro trip by two criteria:
1) The metro trip is labeled as a discount trip, and the amount of discount equal to 1 Yuan;
2) There is at least one bus trip with a tap-in time within 2 hours before the metro tap-in that generated by the same user.
In case of multiple buses trips are detected within the 120 minutes before a metro trip. We assume that the bus trip
with the lowest time difference as the access trip. It is noted that the bus trips before the metro trips are assumed to serve as the function of accessing the metro stations.
4.
Analytical results
4.1 General trip characteristics
The results of the trip identification are listed in Table 1. In total, there are 28.5 million metro trips and 37.2 million bus trips are extracted. Around 15.1 % of metro trips are identified as bus-and-metro trips, which also indicates the importance of the bus and metro integration.
Number
bus trips 37.2 million
metro trips 28.5 million bus-and-metro trips 4.3 million Table 1. The numbers of different types of trips
The time duration for the two parts (i.e., access metro and on metro parts) of the bus-and-metro trips are shown in Figure 2. The median values for the two parts are 17 minutes and 34 minutes. It is noticed that 5-10 minutes is the most frequent time bin that needs for accessing the metro, and the access time shows a decrease pattern after this peak bin. On the other hand, 20-25 minutes acts as the peak time bin for on metro time duration, starting from this point, a decrease pattern is observed as well. The two distributions generally reflect the dominant role of the metro part among the bus-and-metro trips. It is reasonable because metro systems in metropolis usually are faster than buses and thus attract more users.
Figure 2. The time durations of access metro (a) and on metro (b) parts of the bus-and-metro trips.
To examine if the bus-metro integration is a routine or an impromptu behavior, the proportions of users with different frequencies of bus-and-metro integration during the five weekdays are calculated as an indicator. The results are shown in Table 2. As shown, there are 46% users have at least two times of using buses to access the metro stations during the five weekdays. Correspondingly, 56% users only show one bus-and-metro trip, which indicates over half of the users integrate the bus and metro system as an impromptu behavior. However, compared with the corresponding figures (11% users have at least 6 times in three weeks) of bikeshare-metro integration reported in Nanjing, China (Ma et al., 2018)), reflecting that buses act as a more stable feeder mode of metro systems than shared bikes.
Frequency 1 2 3 4 5
proportion 56.0% 15.0% 10% 9.5% 9.5% Table 2. The proportions of users with different frequencies of bus-and-metro integration during the five weekdays.
4.2 Spatiotemporal analysis
Following the general analysis of the trip characteristics of the bus-and-metro trips, we focus on the spatiotemporal analysis of the bus-and-ride trips in this section. Specifically, we aim to examine how the bus-and-metro integration change across space and time. Additionally, in order to understand the role of buses as the feeder mode, a comparison between the spatiotemporal patterns of bus-and-metro trips and the entire metro trips is conducted.
The hourly distributions of metro ridership, bus-and-metro ridership, and the ratios between bus-and-bus-and-metro ridership and metro ridership are visualized in Figure 3. The measurement of metro trip frequency is based on the tap-in times of metro trips. Correspondingly, the measurement of the bus-and-metro trip frequency is based on the tap-in time of the metro journey part. For each day, only the period from 5:00 to 22:00 are considered, other times are ignored due low or no ridership has been detected.
The hourly metro ridership shows a clear peak pattern during the commuting hours. Similarly, more bus-and-metro trips are generated during commuting hours. However, compared with the patterns reflected from the entire metro trips, the afternoon peak for the bus-and-ride trips is relatively weaker. This is reflected by the temporal change of bus-and-metro ratios (Figure 3 (c)). It is noticeable that the share of buses as the access mode in the morning is much larger than that in the afternoon. Theoretically, the trip directions during morning and afternoon peak hours are opposite. Precisely, the morning and afternoon commuting correspond to the home-work trips and work-home trips, respectively. In this way, the ratio differences might indicate that buses are a more attractive feeder mode (the access part) for the home-work trips than for the home-work-home trips.
Figure 3. The hourly distributions of entire metro ridership (a), metro ridership (b), and the ratios between bus-and-metro ridership and bus-and-metro ridership (c).
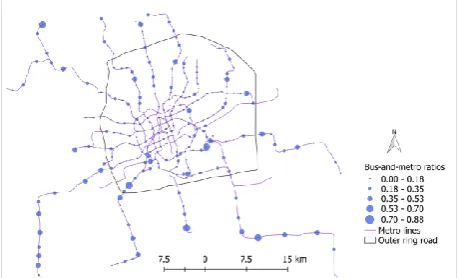
ridership trend to have a high bus-and-metro ridership. However, there are also cases that not exactly follow this trend. It can be partly explained by that the bus-and-metro ridership is not only related to the bus-and-metro ridership but also related to other factors such as the convenient of transfer and the competition from alternative feeder models (e.g. walking or biking). To further mine the spatial pattern of the share of buses as the access mode, the ratios between the number of bus-and-metro trips and entire metro ridership for metro stations in Shanghai are measured and visualized in Figure 5. Generally, the bus-and-metro ratios are relatively small for stations in the city center, and more stations with large ratios are found near or outside the outer ring road (i.e., the central urban area of Shanghai). The highest and the lowest ratios for the bus-and-metro trips are 0.870 and 0.003, corresponding to the Lingang Avenue metro station and the Pudong International Airport respectively. The former one is probably due to very less residential areas are found around the metro station, and the latter one is mainly used for transfer purposes of air passengers.
Figure 4. The average daily number of metro trips and bus-and-metro trips to different bus-and-metro stations in central Shanghai.
Figure 5. The ratios of bus-and-metro trips for different metro stations.
4.3 Correlation analysis
In this section, Pearson correlation test is used to examine the factors that correlate with the average daily bus-and-metro ridership and the bus-and-bus-and-metro ratios. We present the analyses of these two set of tests one by one.
For the correlation tests of bus-and-metro ridership, metro ridership, access metro duration, metro station density, and the numbers of bus lines around 100 m to 400 m buffer of the metro station are selected. The metro ridership is measured by the average number of metro trips during the working days. The access metro duration also corresponds to the average duration of the access metro trips (i.e., bus riding and walking to metro station) during working days. The density of a metro station is
represented by the reciprocal of the average distance of the nearest 4 metro stations around the metro station. The number of bus lines is measured by the number of individual bus lines within a given threshold. The distance between a bus line and a metro station is measured by the nearest distance of buses line stations and metro entrances. In this study, four buffer thresholds are selected: 100 m, 200 m, 300 m, and 400 m.
The results of the Pearson correlation test are shown in Table 3. As expected, the metro ridership shows a positive association with the bus-and-metro ridership. Whereas, the access metro duration is negatively correlated with the bus-and-metro ridership. This indicates that a shorter access trip trend to have more bus-and-ride trips. The numbers of bus lines within 100 m to 400 m are positively associated with bus-and-ride ridership. The positive associations can be easily understood because more bus lines usually attract more users. Besides, the coefficient corresponds to 300 m is the largest. At last, the negative correlation between the metro density and the bus-and-ride ridership is very weak.
variable coefficient p-value
metro ridership 0.53 0.000
access metro duration -0.21 0.000
metro density -0.11 0.055
bus line around 100 m 0.30 0.000 bus line around 200 m 0.50 0.000 bus line around 300 m 0.56 0.000 bus line around 400 m 0.47 0.000
Table 3. The results of Pearson correlation tests between the bus-and-metro ridership and selected variables.
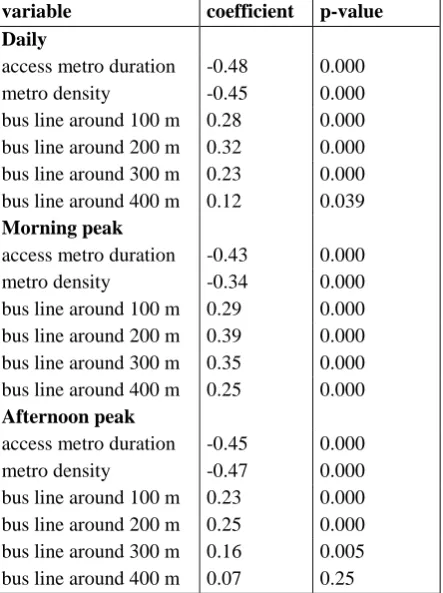
ratio. This indicates that 200 m might act as the “acceptable” walking distance for transfer between buses and metro systems.
A comparison of coefficients for morning peak and evening peak reflects: 1) the correlations related to access metro duration only shows a slight difference between the morning peak and afternoon peak; 2) the metro density shows much stronger negative association with the bus-and-metro ratios in the afternoon peak than in the morning peak; 3) the number of bus line around metro stations shows a weaker positive correlation in the afternoon peak than in the morning peak. The differences of the coefficients in the morning and afternoon peaks can be partly explained by the ratio differences of bus-and-metro trips in the morning and evening. This reflects that the same factor might have different roles in explaining the share of bus-and-metro trips across different times.
variable coefficient p-value
Daily
access metro duration -0.48 0.000
metro density -0.45 0.000
bus line around 100 m 0.28 0.000 bus line around 200 m 0.32 0.000 bus line around 300 m 0.23 0.000 bus line around 400 m 0.12 0.039 Morning peak
access metro duration -0.43 0.000
metro density -0.34 0.000
bus line around 100 m 0.29 0.000 bus line around 200 m 0.39 0.000 bus line around 300 m 0.35 0.000 bus line around 400 m 0.25 0.000 Afternoon peak
access metro duration -0.45 0.000
metro density -0.47 0.000
bus line around 100 m 0.23 0.000 bus line around 200 m 0.25 0.000 bus line around 300 m 0.16 0.005 bus line around 400 m 0.07 0.25
Table 4. The results of Pearson correlation tests between the bus-and-metro ratios and selected variables for different periods.
5.
Conclusion
This study focuses on using SC data to explore the characteristics of bus-and-metro integration. We first present methods to identify the bus-and-metro trips. We then analyze the bus-and-metro trips from three different aspects: the general trip characteristics, spatiotemporal patterns, and the factors associated with the metro-and-ride metro-and-ridership and ratios. It is found that 46% users have at least two times of using buses to access the metro stations during the five weekdays. The spatiotemporal analysis indicates the patterns of metro ridership and bus-and-metro ridership show positive associations in terms of temporal and spatial distribution. On the other hand,
morning trips show larger bus-and-metro ratios than afternoon trips, and suburban areas show larger ratios than the city center. The access metro time duration and metro density are negatively associated with station-level bus-and-metro ratios and the number of bus lines shows a positive association. Those analytical results enhanced our understanding of the integration of buses and metro systems.
In this study, we only examined the associations between the bus-and-metro ratios and six variables. In the future, we plan to explore the more variables that might be associated with the bus-and-metro ratios, such as the bus frequency, quality of road network around the metro stations. Furthermore, we will apply spatiotemporal regression model to estimate the bus-and-metro ratios across different spaces and times.
6.
References
Daniels R and Mulley C (2013). Explaining walking distance to public transport: The dominance of public transport supply. Journal of Transport and Land Use 6(2): 5. DOI: 10.5198/jtlu.v6i2.308.
El-Geneidy A, Grimsrud M, Wasfi R, et al. (2014). New evidence on walking distances to transit stops: Identifying redundancies and gaps using variable service areas. Transportation 41(1): 193–210. DOI: 10.1007/s11116-013-9508-z.
Goel R and Tiwari G (2016). Access-egress and other travel characteristics of metro users in Delhi and its satellite cities. IATSS Research 39(2). The Authors: 164–172. DOI: 10.1016/j.iatssr.2015.10.001. Hu Y, Zhang Q and Wang W (2012). A Model Layout
Region Optimization for Feeder Buses of Rail Transit. Procedia - Social and Behavioral Sciences 43: 773–780. DOI: 10.1016/j.sbspro.2012.04.151. Jang W (2010). Travel Time and Transfer Analysis Using
Transit Smart Card Data. Transportation Research Record: Journal of the Transportation Research Board 2144: 142–149. DOI: 10.3141/2144-16. Ma X, Wang Y, Chen F, et al. (2012). Transit smart card
data mining for passenger origin information extraction. Journal of Zhejiang University
SCIENCE C 13(10): 750–760. DOI:
10.1631/jzus.C12a0049.
Ma X, Liu C, Wen H, et al. (2017). Understanding commuting patterns using transit smart card data. Journal of Transport Geography 58. Elsevier Ltd: 135–145. DOI: 10.1016/j.jtrangeo.2016.12.001. Ma X, Ji Y, Yang M, et al. (2018). Understanding
bikeshare mode as a feeder to metro by isolating metro-bikeshare transfers from smart card data. Transport Policy 71. Pergamon: 57–69. DOI: 10.1016/J.TRANPOL.2018.07.008.
Seaborn C, Attanucci J and Wilson N (2009). Analyzing Multimodal Public Transport Journeys in London with Smart Card Fare Payment Data. Transportation Research Record: Journal of the Transportation Research Board 2121(2121): 55– 62. DOI: 10.3141/2121-06.
Sun SN, Her J, Lee SY, et al. (2017). Meso-scale urban Form elements for bus transit-oriented development: Evidence from Seoul, Republic of Korea. Sustainability (Switzerland) 9(9). DOI: 10.3390/su9091516.
Tu W, Cao R, Yue Y, et al. (2018). Spatial variations in urban public ridership derived from GPS trajectories and smart card data. Journal of Transport Geography 69(3688). Elsevier: 45–57. DOI: 10.1016/j.jtrangeo.2018.04.013.
Tyrinopoulos Y and Antoniou C (2008). Public transit user satisfaction: Variability and policy implications. Transport Policy 15(4): 260–272. DOI: 10.1016/j.tranpol.2008.06.002.
Wang Z-J, Liu Y and Chen F (2018). Evaluation and Improvement of the Interchange from Bus to Metro Using Smart Card Data and GIS. Journal of Urban Planning and Development 144(2): 05018004. DOI: 10.1061/(asce)up.1943-5444.0000435. Zhao D, Wang W, Woodburn A, et al. (2017). Isolating