Vol.9 (2019) No. 4
ISSN: 2088-5334
Improving Thermal Performance of Dwelling Single Glass Windows
Using Secondary Glazing in the UK
Dewanto Harjunowibowo
#1, Ridwan Aji Budi Prasetyo
#2, Farid Ahmadi
#3, Taqia Rahman
#4,
Revian Nathanael Wirabuana
#5, Rami Zeinelabdein
#6#1,5
Department of Architecture and Built Environment, University of Nottingham, University Park, NG7 2RD Nottingham, UK
#1
Department of Physics Education, Universitas Sebelas Maret, Surakarta, 57126, Indonesia E-mail: #[email protected]; #[email protected]
#2
Human Factors Research Group, University of Nottingham, University Park, NG7 2RD Nottingham, UK
#2Brawijaya University, Department of Psychology, Malang, Indonesia E-mail: [email protected]
#3
Education Science Faculty, Semarang State University, Semarang, Indonesia E-mail: [email protected]
#4
Department of Civil and Environmental Engineering, Universitas Gadjah Mada, Sekip Bulaksumur, Indonesia E-mail: [email protected]
#6
Department of Housing Studies, Faculty of Architecture, University of Khartoum, Sudan E-mail: [email protected]
Abstract—In the globe, 40% of heat losses in domestic buildings were caused by single glazing windows usage and around 20% were
due to air infiltration. Therefore, an improvement for the single glazed windows and reducing the air infiltration must be considered to lower the energy consumption. This study aims to investigate the thermal performance of the secondary glazing sheet on the ordinary windows in the low-income dwellers. The PVC sheets were used as the secondary glazing which easies to tailor and fit into the windows frame in the living room. Besides, a commercial foam insulation tape was used to seal the air leakage of the windows.
The indoor and outdoor temperatures of a living room, pre- and post-retrofitting, were measuredand the U-values were compared
based on ISO 9869:2014 standard. It is found that the respective temperature differences between indoor and outdoor at pre- and post-retrofitting were 5.6 °C and 8.6 °C. The post-retrofitting indoor temperature was more stable, with fewer fluctuations compared to the pre-treatment. Furthermore, the U-values were improved by 57% where the number before and after retrofitting found to be
5.71±0.01 W/m2K and 3.23±0.01 W/m2K, respectively. The utilization of the proposed glazing and diminishing the air infiltration on a
single glazing window play the key role in improving the thermal comfort, cheaper than commercial double glazing, eco-friendly, and easy to install.
Keywords—airtightness; dwelling; secondary glazing; thermal performance; U-value.
I. INTRODUCTION
The UK government stated that households in 2017 have accounted for around 15% of the greenhouse gas emission in the UK [1] and for around one-third of the total energy use more than the transportation and industry sectors. Thus, energy consumption in the UK has targeted a cut of 20% by 2020 [2]. In addition, the government issued a cut of 34% greenhouse gas emissions in 1990 by 2020 and is expected
to reach 80% by 2050 [3], since the domestic sector has a key role in achieving the UK’s 2050 targets [4].
Although windows are not the only one cause of heat losses, around the globe, its glazing is responsible for around 40% of heat losses in the building [5], [6], which in turn increases the fossil fuel need and hence leads to environmental damage and climate change [7], [8].
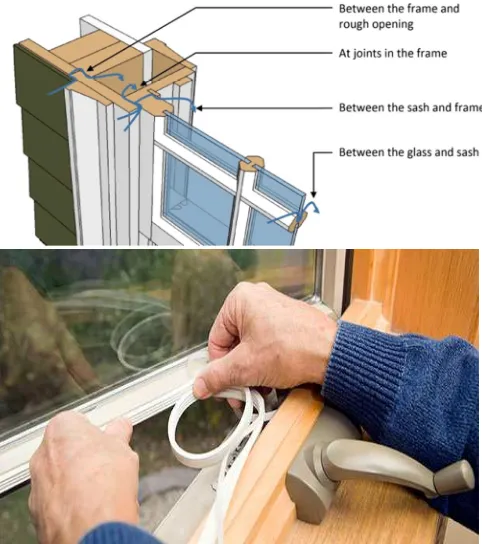
This factor contributes up to 20% of all building’s heat losses and even worse up to a third in a well-insulated house [10]. Air infiltrations produce a phenomenon of air mass exchange between the indoor and the outdoor of the building, causing energy transfer with a different hygrothermal level of the air. The high airtightness mainly occurs in old building stocks and caused by low-control on properties installation [11] such as around old windows and doors [12], as can be seen in Fig. 1 . Generally, it has been estimated that air infiltration could increase the heating demand by 10 kWh/m2 y in moderately cold climate [13] such as Greenland and Finland, 2.43 to 16.44 kWh/m2 y in the Mediterranean area [14] such as Spain and Canary Island, and 20 kWh/m2 y in temperate climate [15] such as in the UK.
Moreover, to tackle the heat losses caused by low thermal performance of the single glazing and uncontrolled air infiltration, the new houses must comply with the L1A UK building regulation [16] and L1B for the existing houses [17]. The U-value of the windows according to L1A and L1B UK building regulation is 2.0 W/m2K and 1.6 W/m2K, respectively. In fact, as much as 2.25 million houses in the UK until 2011 have not used double glazing windows [2]. The old windows were commonly made of lacquered wood and simple glass with a thickness of 4 mm [14] where the U-value varies from 5.2 W/m2K to 6.7 W/m2K [18]. In addition, the UK building regulation requires an air infiltration rate at 10.0 m3/(hm2) at 50 Pa for new buildings [16].
The published literature found that increasing the airtightness quality determined in the UK building regulation standard of 11.5 m3/(m2h) to be 5 m3/(m2h) at 50 Pa may result in a 15% reduction of heat loss [13]. Furthermore, in terms of windows thermal performance, Smith et al [19] reported the performance of four different types of secondary glazing; a plastic film, a plastic sheet, an acrylic sheet, and a low-E glass; applied to a single glazing base window in a guarded hot box. The results have shown a notable thermal performance improvement as can be seen from TABLE .
TABLEI
SECONDARY GLAZING RETROFIT MEASUREMENT
[19]
Panel system
Thickness (mm)
U-value
(W/m2K)
External glass
Air gap Internal glazing
Base window 4.0 - - 6.9±2.0
Base + Plastic
glazing 4.0 61.4 6.0 3.0±0.5
Base + Thin
plastic film 4.0 88.1 0.2 2.9±0.4 Base + Acrylic 4.0 48.5 3.0 2.8±0.4 Base + low-E
glazing 4.0 61.4 6.0 1.8±0.3
Based on TABLE
, t
he experimental results have shown that the thermal transmittance or the effectiveness of material for preventing heat transmittance from one side to another (U-value) could be remarkably improved by around 74% by using low-E glass as secondary glazing. This result shows the potential of secondary glazing on a single glazing window to improve the thermal performance and reduce the energy consumption. However, a research on measuring thethermal performance on site, which has different conditions and unpredictable weather, is very scarce.
Instead of retrofitting entire building in a single step which is not financially feasible for most owners, focusing on windows and its airtightness as the base point of high heat losses will result in a more significant thermal performance improvement. Besides, retrofitting millions of single glazing in the old housing sector using eco-friendly material could be easier and feasible. Therefore, this study aims to investigate the potential of a commercial PVC sheet material as a secondary glazing and a commercial leakage air sealer against the thermal performance of the customary window and its impact to the dwelling thermal performance.
II. MATERIALS AND METHOD
A. Methodology
This study was based on an in-situ experimental where the U-value measurement of the samples was carried out under normal environmental atmosphere based on ISO 9869:2014. Hence, the measurements period were conducted for at least 72 h [20]. In order to obtain good data, a living room faces the north direction where it is protected from the direct sunlight has been considered. Moreover, the U-value calculation was determined in an average method as shown in equation (1). The uncertainty of the average method (∆ ) was determined by the standard error formula based on standard deviation in equation (2).
=∑( ∑
, − , )
(1)
∆ = 1 √
∑( − ) − 1
(2)
where U is the thermal transmittance (W/m2K), is the heat flux through the window considered at regular time intervals I (W/m2), , , and T , , are the internal and the external air temperature (
°
C), respectively, and n is the number of data population.B. Experimental Procedures
The testing was conducted in the period from February to March 2019 under the climatic condition of Nottingham, UK. In this period, the minimum and maximum ambient temperature ranged between 1 and 8
°
C [23]. An occupied living room in a dwelling was used to investigate the windows thermal performance before and after retrofitting [24].1) Pre-Retrofit Investigation: The first step was
The heat flux sensor was used to measure the heat flux per square meter through the glass; hence it was placed on the glass internal surface, together with the thermocouples which were placed on the internal and external glass surfaces. The other two thermocouples were used to measure the ambient temperature and the indoor air temperature at a distance of 1.0 m in front of the heat flux sensor [26]. The outside thermocouples for the external glass surface and ambient temperature measurements respectively were covered from the direct sun exposure by using aluminum tape and hung under the shadow of the walls. The sensors were connected to the data logger DT-80, which recorded every 30 seconds on average for a period of 4 days. The room temperature was maintained at 21°C by a wireless thermostat with an accuracy of ±1F to control the portable electric heater of 2.4 kW. The heater was positioned to face the other wall, so the heat can be indirectly circulated in the room using the heater fan.
Fig. 1 Air infiltration in a single glazed window [21] and air leak sealing process [22].
In order to understand the temperature differences on pre- and post-retrofit against the thermal comfort, the indoor and outdoor temperatures were also measured. Two K-type thermocouples with limits of error ± 1.1
°
C or 0.4% were used for five days before secondary glazing was applied and without any additional heating. To avoid disturbance from direct solar radiation, the thermocouple was installed close to the outside wall, which protected from the sunlight. Moreover, to get a homogenous reading on indoor temperature, the indoor thermocouple was placed in the middle of the room 1 m below the ceiling. The temperature data from both thermocouples were logged utilizing data logger DT80 series 2 and recorded every 5 minutes for 5 days.In addition, measuring the average air infiltration was carried out using Testo 405i hot-wire anemometer Bluetooth with accuracy 0.1 m/s. The recording was undergone in every two seconds for an hour. The measurement of the air infiltration speed was carried out on the micro gap between the window sashes and the frame. Since the air infiltration rate fluctuates depending on the outside wind speed, an average calculation was used. These measurements were performed on pre- and post-refurbishment after the base window has been sealed as shown in Fig. 1 . The commercial foam tape seal was used and installed surrounding the sashes windows. It must be well-sealed by checking the air leakage using the anemometer thermal tool.
2) Post-Retrofit Investigation: After the first testing
completed and no air infiltration, the 2 mm PVC sheet with a density of 1.7 g/cm3 and a thermal conductivity of 0.14-0.17 W/mK was installed on the base windows as secondary glazing with an air gap of 4.5 cm. The secondary glazing was stuck with magnetic tape around the edge as can be seen in Fig. 2. The measurement above procedure for air infiltration, indoor and outdoor temperatures, and the U-value were repeated completely. A dual thermal camera FLIR android-based with an accuracy up to 0.1 °C (0.18 °F) and a measurement range from -20 °C to 120 °C was used to show the temperature differences between the original single glazing and the double glazing resulted from the post-retrofitting of windows.
Fig. 2 U-value measurement tools setting; 1) PU11T Heat flux sensor, 2) Datalogger, 3) wireless thermostat transmitter, 4) thermocouples, 5) Testo 405i anemometer transmitter, 6) Smartphone Testo logger receiver, 7) magnetic tape, and 8) PVC sheet.
III.RESULTS AND DISCUSSION
As predicted before, the old building used has air leakage as depicted in Fig. 3. It is clearly seen that the average velocity was 0.12 m/s and it differs depending on the outside wind speed and the temperature difference between indoor and outdoor. For this reason, air infiltration will lead to 40% heat loss in a building [27]. Therefore, retrofitting should pay more attention to the prevention of air leakage.
As a consequence of the heat losses caused by the air-infiltration from the original windows, as can be seen in Fig. 4, the indoor temperature was very low; approximately 16.1
oC, which is 5.6
°
C different from the outside temperature.The indoor temperature is getting worse as the outside temperature drops. The only factor that assisted in keeping
1
2 3
5 6
4
the living room warm enough was the building’s position; other occupied houses on the left and right sides flank it. For this reason, heat losses from those sides are negligible.
Fig. 3 The air infiltration velocity entering the building pre-retrofitting
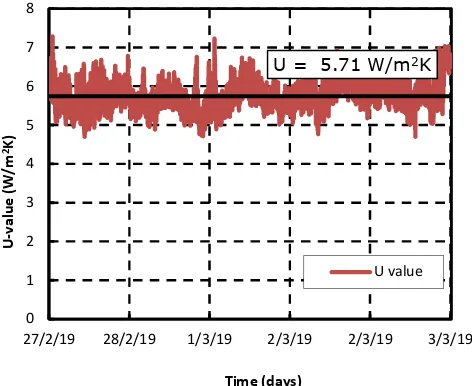
Besides the air infiltration, thermal transmittance of the windows also influences the thermal comfort of the occupants. In this respect, the investigation of the windows’ glass U-value is very important to be carried out. Based on the in-situ measurements, it is obviously revealed that the U-value was found to be 5.71±0.01 W/m2K as presented in Fig. 5. The testing was conducted in an environmental temperature condition that is recommended by the ISO 9869-1:2014 standard and the temperature differences obtained in average were never less than 10
°
C as shown in Fig. 6 [20].Fig. 4 Environmental conditions outside and inside at pre-retrofitting
However, the U-value was 5.8 W/m2K a bit lower than the similar type of a 4 mm single glass from a commercial manufacturer [28]. This difference might be attributed to the measurement method used by the manufacturer, which is based on the European standard EN572-2:1994 ”Glass in
Building–Part 2: Floatglass” method. Nevertheless, the trivial differences of 0.1 from both methods are negligible and considered in accordance.
Fig. 5 U-value measurement results of the original single glass window
Compared to the post-retrofitting results, the air sealing and the secondary glazing application significantly reduced the heat loss and improved the thermal performance of the windows. In turn, the indoor temperature could be increased up to 8.6
°
C higher than the pre-retrofit as revealed in Fig. 7. Furthermore, the indoor temperature could be maintained stability even though the outdoor temperature dropped.Fig. 6 The environmental condition on the U-value measurement of the original single glass window
However, the sensible temperature difference between indoor and outdoor air is affected by the occupants’ behavior. Hence, there were some data discrepancies, such as a high fluctuation while the outdoor temperature dropped as can be seen from the graphs. Yet, it does not affect the graphs trend line.
va= 0.122
0 0,05 0,1 0,15 0,2 0,25 0,3 0,35
0 600 1200 1800 2400 3000 3600
V
e
loc
it
y
(
m
/s
)
Time (seconds)
Air infiltration
Tair,out= 10.5 Tair,in= 16.1
0 4 8 12 16 20
22/2/19 23/2/19 24/2/19 25/2/19 26/2/19 27/2/19
T
e
m
p
e
ra
tu
re
(
°C
)
Time (days)
Outdoor
Indoor
U = 5.71 W/m2K
0 1 2 3 4 5 6 7 8
27/2/19 28/2/19 1/3/19 2/3/19 2/3/19 3/3/19
U
-v
a
lu
e
(
W
/m
2K
)
Time (days)
U value
Tair,E= 10.1 Tair,I= 21.1
0 5 10 15 20 25
27/2/19 28/2/19 1/3/19 2/3/19 2/3/19 3/3/19
T
e
m
p
e
ra
tu
re
(
°C
)
Time (days)
Fig. 7 Environmental conditions outside and inside at post-retrofitting
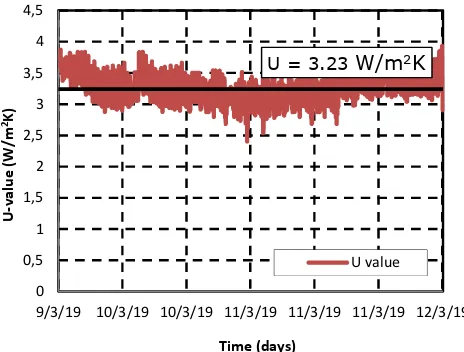
In respect of windows thermal transmittance at post-retrofitting, Fig. 8 shows a significant improvement of U-value of 3.23±0.01 W/m2K, i.e. up to 57%. This result has a good agreement with reference [19], where the air gap was wider than in the present study. The air thermal conductivity is low; therefore, the wider the air gap layer, the lower the U-value of the window.
Fig. 8 The U-value measurement resulted from post-retrofitting
Furthermore, this improvement was achieved since the windows were very airtight; where no air leakage was detected around the micro gap between the window sashes and its frame. Consequently, it can be said that air infiltration and thermal properties of the secondary glazing are also determining the U-value of the retrofitted windows. Likewise, to lower the U-value, using thicker PVC sheet film can be used. Additionally, the temperature difference between the inside and outside of the window was appropriate and even reached 15
°
C as shown in Fig. 9.To show the thermal appearances between the original single glazing window, which can be represented by the similar single glass above the door, and the post-retrofitting windows, a thermal camera was utilized as shown in Fig. 10. The red color above the door shows the area with the highest heat loss. It shows 6
°
C on average higher than the average temperature of 3.8°
C on the post-retrofitting windows. Thisobviously shows the thermal comfort enhancement that can be achieved by the secondary glazing application against the old dwelling.
Fig. 9 The environmental condition outside and inside at post-retrofitting for U-value measurement
Fig. 10 Temperatures difference between the ordinary glass and the post-retrofitting in thermal camera
IV.CONCLUSIONS
The present study investigated the potential performance of a secondary glazing application to single glazing windows in dwellings. It is commonly known that airtightness and thermal transmittance of the windows play a key role in the thermal performance of a building, affecting the heat loss and energy consumption. The low-cost and easy-to-install solutions must be taken into account in order to retrofit and improve the life quality of the occupants in millions of single glazing dwellings in the UK. From the experimental results, it is evident that an eco-friendly PVC sheet could reduce the thermal transmittance of the old single glazing windows by up to 57%, providing a stable indoor air temperature, significantly higher than the ambient temperature by around 8.6
°
C. Overall, it can be stated that the proposed new window design is capable of reducing the energy consumption for the heating significantly and aiding the low-income dwellers to refurbish their houses toward 20% UK energy consumption reduction in 2020.y = 17.4
y = 8.8
0 4 8 12 16 20 24
3/3/19 4/3/19 5/3/19 6/3/19 7/3/19 8/3/19
T
e
m
p
e
ra
tu
re
(
°C
)
Time (days)
Indoor
Outdoor
U = 3.23 W/m2K
0 0,5 1 1,5 2 2,5 3 3,5 4 4,5
9/3/19 10/3/19 10/3/19 11/3/19 11/3/19 11/3/19 12/3/19
U
-v
a
lu
e
(
W
/m
2K
)
Time (days)
U value
Tair,E= 6.2 Tair,I= 21.2
0 5 10 15 20 25 30
9/3/19 10/3/19 10/3/19 11/3/19 11/3/19 11/3/19 12/3/19
T
e
m
p
e
ra
tu
re
(
°C
)
Time (days)
Outdoor Indoor
Avg= 3.8
oC
Post-retrofitting
ACKNOWLEDGMENT
The authors would like to thank DIKTI and LPDP, Doctoral Grant UNS No.623/UN27.21/PP/2017 for the funding support. The authors also would like to thank the Indonesian Embassy in the UK and PPI Nottingham for the support
.
REFERENCES
[1] British Government, “2017 UK Greenhouse Gas Emission,” Dep. business, energy Ind. Strateg., p. 8090, 2017.
[2] J. Palmer and I. Cooper, “Housing Energy Fact File 2013,” 2013. [3] DECC, “Government response to the Committee on Climate Change.
Progress on meeting carbon budgets and preparing for climate change - Summary Document,” London, 2015.
[4] H. (URBED) Grimshaw, “Retrofit factfile,” 2016.
[5] W. J. Hee et al., “The role of window glazing on daylighting and energy saving in buildings,” Renew. Sustain. Energy Rev., vol. 42, pp. 323–343, 2015.
[6] M. H. Tascon, “Experimental and computational evaluation of thermal performance and overheating in double skin façades,” no. August, p. 370, 2008.
[7] R. Zeinelabdein, S. Omer, and G. Gan, “Critical review of latent heat storage systems for free cooling in buildings,” Renew. Sustain. Energy Rev., 2017.
[8] D. Harjunowibowo, Y. Ding, S. Omer, and S. Riffat, “Recent active technologies of greenhouse systems – A comprehensive review,” Bulg. J. Agric. Sci., vol. 24, no. 1, pp. 158–170, 2018.
[9] A. Alabdullatief, S. A. Omer, and S. Alfraidi, “GAlabdullatief, A., Omer, S. A. and Alfraidi, S. (2016) ‘Green roof and louvers shading for sustainable mosque buildings in Riyadh , Saudi Arabia .’, (July 2018), pp. 1–20.reen roof and louvers shading for sustainable mosque buildings in Riyadh , Saudi Ar,” no. July 2018, pp. 1–20, 2016. [10] Energy Saving Trust, “GPG268 - Energy efficient ventilation in
dwellings – a guide for specifiers Contents,” p. 20, 2006.
[11] D. Sinnott and M. Dyer, “Air-tightness field data for dwellings in Ireland,” Build. Environ., vol. 51, pp. 269–275, 2012.
[12] L. H. Mortensen and N. C. Bergsøe, “Air tightness measurements in older Danish single-family houses,” Energy Procedia, vol. 132, pp. 825–830, 2017.
[13] TightVent Europe, Building and ductwork artightness. Brussels: The TightVent Europe, 2013.
[14] J. Feijó-Muñoz et al., “Energy impact of the air infiltration in residential buildings in the Mediterranean area of Spain and the
Canary islands,” Energy Build., vol. 188–189, pp. 226–238, 2019. [15] M. Spiekman, “ASIEPI. The final recommendations of the ASIEPI
project: How to make EPB-regulations more effective?,” no. March 2010, p. 121, 2010.
[16] HM Government, “L1A Conservation of fuel and power in new dwellings,” UK Building Regulations, vol. L1A. pp. 1–48, 2016. [17] HM Government, “L1B Conservation of fuel and power in existing
dwellings.” UK Building Regulations, pp. 1–32, 2018.
[18] A. M. Abdel-Ghany and T. Kozai, “On the determination of the overall heat transmission coefficient and soil heat flux for a fog cooled, naturally ventilated greenhouse: Analysis of radiation and convection heat transfer,” Energy Convers. Manag., vol. 47, no. 15– 16, pp. 2612–2628, 2006.
[19] N. Smith, N. Isaacs, J. Burgess, and I. Cox-Smith, “Thermal performance of secondary glazing as a retrofit alternative for single-glazed windows,” Energy Build., vol. 54, pp. 47–51, 2012.
[20] ISO9869-1, “International Standard- Thermal insulation — Building elements-In-situ measurement of thermal resistance and thermal transmittance,” 2014.
[21] US Department of Energy, “Low-E Permanent Interior Storm Windows,” 2013. [Online]. Available: https://basc.pnnl.gov/resource-guides/low-e-permanent-interior-storm-windows#quicktabs-guides=2. [Accessed: 05-Apr-2019].
[22] E. Simmonds, “Draught proofing,” 2019. [Online]. Available: https://www.which.co.uk/reviews/insulation/article/draught-proofing. [Accessed: 05-Apr-2019].
[23] W. W. and C. Information, “World Weather and Climate Information,” Http://Www.Weather-and-Climate.Com, 2019. [Online]. Available: http://www.weather-and-climate.com/%0Afile:///C:/Users/rupkotha02es/Documents/Mendeley Desktop/Weather and Climate_ Dhaka, Bangladesh, average monthly hours Sunshine.pdf. [Accessed: 05-Apr-2019].
[24] M. Dastbaz, C. Gorse, S. Proceedings, I. Conference, S. Ecological, and E. Design, Sustainable Ecological Engineering Design. 2016. [25] Hukseflux, “PU Series Heat Flux Sensors And Specials,” Datasheet,
2015. [Online]. Available: http://www.muroz.co.jp/wp-content/uploads/2015/05/PUseries.pdf. [Accessed: 16-Mar-2019]. [26] D. A. McIntyre, “In situ measurement of U-values,” Build. Serv. Eng.
Res. Technol., vol. 6, no. 1, pp. 1–6, 1985.
[27] M. J. and C. Sciyver, “Airtightness in commercial And public buildings,” Construction, 2011.
[28] Guardian, “Clear float glass,” A company of Vision, 2017. [Online]. Available: