ORIGINAL ARTICLE
Coefficient of Engine Flexibility as a Basis
for the Assessment of Vehicle Tractive
Performance
Dariusz Szpica
*Abstract
The paper attempts to analyze full load characteristics of over 500 combustion engines. Using statistical tools, the author determined the value of the coefficient of flexibility. Engine flexibility is the capability of the engine to adapt to varying loads. Importantly, in the investigations, the author took into account the parameters calculated in the course of the investigations on a chassis dynamometer, i.e., actual, not taken from technical specifications of brand new vehi‑ cles. Different stages of operating wear allow a better characterization of the population. Subsequent utilization of the results in tractive calculations is more reliable. The engines were divided into in six groups, depending on the type of fuel system: fuel injected gasoline and turbocharged gasoline, spark ignition LPG, naturally aspirated diesel and turbo‑ charged diesel. However, engines running on alternative fuels are characterized with a greater flexibility than the fuel injected base engines. Conformity of flexibility of fuel injected and LPG IV generation engines have been observed, which confirms the appropriateness of engine adaptation to alternative fueling. Gasoline engine supercharging allowed a reduction of the maximum engine speed of the maximum torque, which extends the range of analyzable speeds for flexibility and consequently, the flexibility as such.
Keywords: Vehicle, Tractive performance, Flexibility coefficient, Engine characteristics
© The Author(s) 2019. This article is distributed under the terms of the Creative Commons Attribution 4.0 International License (http://creat iveco mmons .org/licen ses/by/4.0/), which permits unrestricted use, distribution, and reproduction in any medium, provided you give appropriate credit to the original author(s) and the source, provide a link to the Creative Commons license, and indicate if changes were made.
1 Introduction
Yet another indicator showing vehicle tractive and opera-tional abilities is engine flexibility coefficient E (Eq. (1)) that is the factor of the torque flexibility eT and engine speed flexibility (range) in Ref. [1]. It shows the capabil-ity of engine adaptation to variable loads and speeds (Figure 1).
where Tmax is the maximum torque value, TPmax is the torque value at maximum power, nPmax is the engine speed value at maximum power, nTmax is the engine speed value at maximum torque.
(1)
E =eTen= Tmax TPmax
nP
max
nTmax
,
By flexibility, we also understand the acceleration time on individual gears. On a chassis dynamometer we may simulate the motion resistance using the coefficient val-ues and using the flexibility option determine the times of acceleration on selected gears.
Yet, in the case of the coefficient of flexibility (E) it is a bit different. If the vehicle drives on the IV gear near the engine speed of the maximum power (point 1 in Figure 2) and if the vehicle drives onto a hill, because of the collec-tive resistance (dotted lines) its engine speed will drop to increase the torque (point 2 in Figure 2) and reach point 3. As we can see, we need a surplus of torque ΔT that will allow the increase of the motion resistance of the vehi-cle. When analyzing the flexibility coefficient the full load characteristics is analyzed in the reverse order. Coeffi-cient E is decisive when analyzing the vehicle motion and enables predicting certain behaviors on the road. Its value in connection with an appropriate analysis may turn out useful when designing roads, artificial hills in particular
Open Access
*Correspondence: [email protected]
(entrance to overpasses) or when designing road portions preceding natural land elevation.
2 Literature Review
Literature information on the subject dates back to the first half of the 20th century, when by Ref. [1] along with the description of the coefficient provides a division of engines in terms of their E value (Table 1).
Grishkievich [2] and Prochowski [3] compared the value of coefficients of flexibility E for selected old gen-eration engine types (Table 2).
The problem of engine flexibility was presented by Myslowski and Koltun [4] but we will not find a complex comparison of flexibility for different types of engines (particularly if alternative fueling is applied). The calcula-tions were made based on technical specificacalcula-tions of new vehicles for 206 vehicles (Table 3). Engines adapted for retrofitted alternative LPG fueling do not have this kind of information.
Some of the studies present only selected groups of engines indicating their flexibility. In Ref. [5] it was observed that MAN engines are characterized by
E= 2.83, in Ref. [6] the presented results for V.A.G 1.9TDi
the coefficient was E= 2.4. Some of the publications are based on values of eT deeming them decisive in the trac-tive analysis of vehicles. Bogatyrjev et al. [7] for gasoline engines states eT= 1.25,…, 1.4 and for diesel engines 1.15, …, 1.2. Kolchin and Demidov [8] states: gasoline, carbu-retor engines—1.2,…, 1.35 and diesel engines—1.25,…, 1.4. In Ref. [8] study several gasoline carburetor engines have been compared where the averaged value eT= 1.24 and with fuel injected engines eT= 1.114, which is to be understood that the latter are less flexible. A com-parison of a naturally aspirated and turbocharged diesel engine has been performed indicating a similar value of
eT= 1.19.
Debicki [9] compared the courses of flexibility of engines used in vehicles of different applications. Based on Figure 3 we can confirm that performance vehicles, which operate at higher speeds, are much less flexible than heavy-duty trucks.
This has also been confirmed in Ref. [6] where the V.A.G 1.9TDi factory engine, compared with an upgraded engine, exhibits better flexibility. Szpica et al. [10] has shown that as the power drops the flexibility grows (Table 4).
Figure 1 Full load engine characteristics—characteristic points needed to determine the flexibility coefficient
Figure 2 Diagram explaining the principle of the coefficient of flexibility
Table 1 Division of engines in terms of flexibility [1] Not
flexible Low flexibility Medium flexible Highly flexible Extremely flexible
Up to 1.6 1.6–2.0 2.0–2.8 2.8–3.8 More than 3.8
Table 2 Values of the coefficients of flexibility for selected engine types
Engine Grishkievich [2] Prochowski [3]
Having the values of characteristic parameters of the flex-ibility coefficient E, i.e., eT and en we can determine the full load characteristics of an engine based on the Leiderman-Khlystov relation (in the literature they are named—Leide-man’s and Leidemann’s) [11–14]. Then assuming:
Relations P=f(n) and T=f(n) are described with rela-tions (Eqs. (3), (4)) presented Bortnicki and Zadorozny [15]:
Besides, for n=nPmax the equality P=Pmax should be ful-filled and then:
(2)
= n nPmax
.
(3) P=PmaxA+B2−C3 [kW],
(4)
T =TPmax
A+B−C2 [N·m].
According Grishkevich [2] coefficients A, B and C may be applicable for gasoline engines and diesel engines and their values are calculated from:
According Litvinov and Farobin [16] for spark ignition engines, without engine speed limiter:
where Tr is the coefficient of torque surplus:
For diesel engines with engine speed limiter:
For engines without engine speed limiter or speed con-troller a condition dP/dn for n=nmax (Eq. (10)) should be fulfilled:
Full load engine characteristics can be used in many aspects, such as modeling of the vehicle in motion-per-formance with automatic transmission [17, 18], vehicle body behavior [19, 20], performance under different soil conditions [21], when changing lanes [22], when assessing motion stability (vehicle-driver) [23], because additional information allows a virtual diagnostic assessment in real time (as has been proposed in Ref. [24]) or a vehicle acceleration simulation [13].
(5) A+B−C=1 ⇒ C=A+B−1.
(6)
A= eTen(2−en)−1 en(2−en)−1 ; B=
2en(1−eT)
en(2−en)2;
C= e
2
n(1−eT) en(2−en)−1.
(7) A=2− 0.25
Tr
; B= 0.5
Tr
−1; C= 0.25
Tr ,
(8)
Tr =
Tmax−TPmax
TPmax
=(eT −1).
(9)
A=1−Tr
en(2−en)
(en−1)2
; B=2Tr
en
(en−1)2 ;
C=Tr
e
n
en−1
.
(10)
A+2B−3C=0. Table 3 Flexibility of combustion engines [4]
Engine Gasoline Diesel
Carburetor Single point Multi point Direct injection Pre-chamber Direct injection turbocharged
eT 1.222 1.222 1.141 1.110 1.195 1.441
en 1.761 1.745 1.511 1.462 2.023 2.101
E 2.153 2.129 1.724 1.622 2.414 3.027
Figure 3 Comparison of the flexibility of different engines [9]: 1. performance vehicle; 2. sports vehicles; 3. passenger vehicles; 4. heavy‑duty trucks; 5. off road vehicles
Table 4 Dependence of the flexibility on the power output [10]
Power output (%) 100 70 50 30
3 Objectives
The aim of the study was the determination of the coef-ficients of engine flexibility under different variants of fueling systems. We can obviously make the calculations based on the data provided by the vehicle manufacturers. In such a case however all results would pertain to new vehicles only, which, as confirmed earlier, is not always reflected on the chassis dynamometer tests. Used vehi-cles, at different stages of their life prevail on the roads, which is why it is important to test larger population to generalize the results.
The problem is important because in literature there is no complex information related to modern engines or alternative fueling. The author also decided to ana-lyze the components of the coefficient of flexibility, i.e., flexibility of torque and flexibility of speed. These two parameters are decisive of the transport capability of a vehicle because not always wider range of torque ΔT is accompanied by a wider range of Δn. This results from the full road characteristics of an engine where the total range of speeds in diesel engines is approximately 70% of that of a gasoline engine. Obviously, vehicles fitted with diesel engines have different gear ratios in the transmis-sion system.
4 Material and Methods 4.1 Subject of the Research
The investigations were carried out on full load passen-ger vehicle engine characteristics calculated on a chassis dynamometer. The engines were grouped into:
– Indirect fuel injected gasoline engines—234 units. – Indirect fuel injected, turbocharged gasoline
engines—7 units.
– Spark ignition LPG, I and II generation engines—64 units.
– Spark ignition LPG, IV generation engines—23 units. – Naturally aspirated diesel engines—10 units.
– Turbocharged diesel engines—171 units.
The engines included in the LPG groups were dual fuel engines and the tests were performed for both types of fuel. The author also had the characteristics of the carbu-retor engines and they were only used to validate infor-mation found in the literature.
4.2 Research Methodology
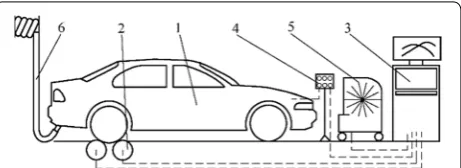
In the investigations, the authors used a chassis dynamometer (LPS 3000 by Maha, Figure 4). Chas-sis dynamometers have a wide range of applications in research from calculating different types of engine char-acteristics to performance of driving cycles [25]. Majority
of the chassis dynamometer tests are related to testing exhaust emissions from engines using driving cycles or proprietary solutions [26]. For example in Refs. [27, 28] used the chassis dynamometer to assess the PM emis-sion from diesel engines and Ref. [29] used it as a tool to compare fueling systems. Measurements with the use of a chassis dynamometer are characterized by high repro-ducibility and the time of adapting the dynamometer to another test object is relatively short compared with engine dynamometers.
On the LPS 3000 dynamometer operating in the load-applying mode, at a continuous test, the cycle during the measurement is realized assuming a constant accelera-tion of the roller.
Such a type of chassis dynamometer is a specific solu-tion in the aspect of measurement of the power output. The LPS 3000 chassis dynamometer adjusts the load on a continuous basis.
In the preceding investigations, in the beginning of the research cycle preliminary tests were performed. They aimed at checking the reproducibility of the results on one hand (within 3 consecutively repeated tests no errors greater than 1% of the measurement range were recorded) and determining the full load engine character-istics at different gears on the other. It has been observed that only the gear ratio close to 1 allows an assessment of the full measurement range. For overdrives the risk of exceeding the maximum vehicle speed range declared by the manufacturer occurs. The test stand also has a secu-rity system against accidental vehicle takeoff from the rollers during the tests. It is rather important because the turbocharged diesel engines have a rapidly increas-ing torque at maximum chargincreas-ing, which may result in the vehicle uncontrolled takeoff from the stand. The chas-sis dynamometer systems calculate the slip between the front and the rear axles by monitoring the speeds of the front and rear rollers and can reduce the load in hazard-ous situations.
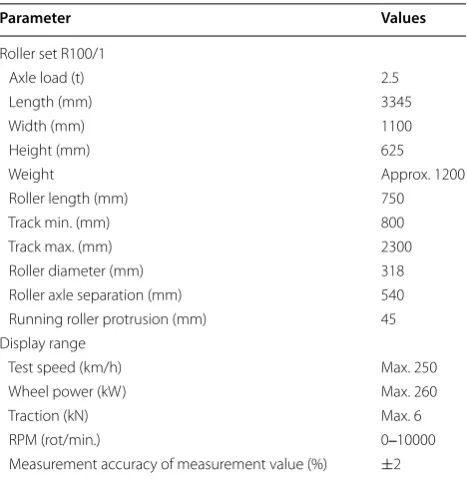
The technical data of the test stand have been shown in Table 5. Because the tested vehicles were not property of
the university, the tests were not repeated and the con-clusions were drawn based on the preliminary tests.
In the case of this type of chassis dynamometer the research process is realized as follows: upon setting of the vehicles on the rollers and securing it against take-off or displacement and connecting all necessary signals the driving is initiated to obtain the operating coolant and lubricant temperatures. Then, on the gear ratio closest to 1:1 the engine power is increased to 100%. The dynamometer adjusts the engine load starting from 50 km/h automatically, which is sufficient for most of the engines to initiate the measurement. The test is continued until the power starts dropping after reach-ing its maximum value. Then, we continue to reduce the engine power to minimum, depress the clutch and thus determine the accumulated motion resistance.
The measurement is indirect, as the torque is meas-ured on the wheels by the brake rollers and the power in the initial phase is calculated and displayed on the monitor as the power on the wheels. An example full load characteristics has been presented in Figure 5. During the measurement, the power on the wheels
Pw and then, in the coastdown trial, the power of the resistance Pd are determined. The engine power is cal-culated as Pe=Pw+Pd. During the test, the torque T is not displayed to enable finishing of the measurement. It is displayed only after the engine power Pe is calculated.
Based on this type of characteristics, as in Figure 5, following Eq. (1) the characteristics values were calcu-lated. Additionally, the value of the torque surplus Tr was determined applicable in the tractive calculations of the vehicle.
5 Results and Discussion
The results of the measurements were analyzed only in the adopted groups, they were not compared with the factory technical data.
In a statistical analysis, Gaussian distributions were adopted. However one may attempt to use information theory to analyze discrete distributions. The statistical processing covered:
• Arithmetic average:
• Estimator of standard deviation:
• Median:
• Sample variance:
• Standard deviation:
(11) ¯
x= x1+x2+ · · · +xn
n .
(12) sb=
1
n−1· n
i=1
(xi−x)2.
(13) M= n+1
2 .
(14) s2= 1
n · n
i=1
(xi−x)2.
(15)
so =
s2. Table 5 Basic technical data of the Maha LPS 3000
dynamometer (Maha Manuals)
Parameter Values
Roller set R100/1
Axle load (t) 2.5
Length (mm) 3345
Width (mm) 1100
Height (mm) 625
Weight Approx. 1200
Roller length (mm) 750 Track min. (mm) 800 Track max. (mm) 2300 Roller diameter (mm) 318 Roller axle separation (mm) 540 Running roller protrusion (mm) 45 Display range
Test speed (km/h) Max. 250 Wheel power (kW) Max. 260 Traction (kN) Max. 6 RPM (rot/min.) 0‒10000 Measurement accuracy of measurement value (%) ±2
• Bias:
• Kurtosis:
Moreover, the following have been determined: the range, the minimum, the maximum, the sum, the coun-ter and confidence level that marks the probability that the result of the measurement falls in the range of the bounded interval limited by the extended uncertainty of the measurement. The results were not eliminated based on the Dixon and Grubbs test because of the wide range of vehicles tested in the groups.
In the results analysis, attention was focused on the flexibility coefficient E, yet, in the tables results for all obtained parameters were given, which may be impor-tant when analyzing the influence of different factors on the vehicle tractive performance.
Based on 234 samples we can confirm with 95% prob-ability that direct injected gasoline engines are char-acterized by the flexibility coefficient on the level of 1.645 ± 0.049 (Figure 6 and Table 6). The distribution of E is a bit flattened against the regular one, which is indicated by the negative value of the kurtosis of a left-side skewness. E is more influenced by en and deter-mines its distribution. The interval of the obtained values is E= 1.062,…, 2.747.
In the case of gasoline supercharged engines the num-ber of samples is low (7 samples) and statistical con-clusion is uncertain. E= 2.558 ± 0.386 (Figure 7 and Table 7). Distribution of E is close to normal. Value E
(16) Ad=
n
(n−1)·(n−2) · n
i=1
x
1− ¯x
s 3
.
(17) K =
n·(n+1)
(n−1)·(n−2)·(n−3) · n
i=1
x
1− ¯x s
4
− 3·(n−1)
2
(n−2)·(n−3).
is predominantly influenced by en. The interval of the obtained values E= 1.946,…, 3.112.
Based on 64 samples we can confirm with a 95% prob-ability that gasoline engines with alternative I and II gen-eration LPG fueling are characterized with a flexibility index on the level of 1.808 ± 0.120 (Figure 8 and Table 8). The distribution of E is significantly flattened against the regular one, which is indicated by the negative value of the kurtosis of a left-side skewness. E is more influenced by en and determines its distribution. The interval of the obtained values is E= 1.140,…, 3.892.
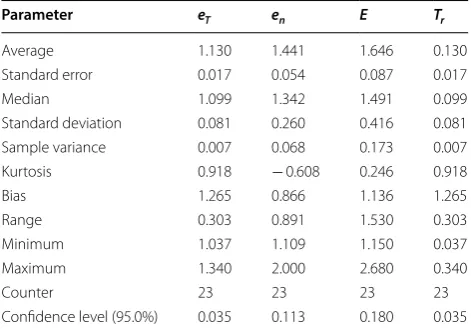
It is similar for IV generation LPG fueling. With 23 samples we can confirm with 95% probability that
E= 1.646 ± 0.180 (Figure 9 and Table 9). The distribution of E is slightly flattened against the regular one, which is indicated by the negative value of the kurtosis of a left-side skewness. E is more influenced by en and determines its distribution. The interval of the obtained values is
E= 1.150,…, 2.680.
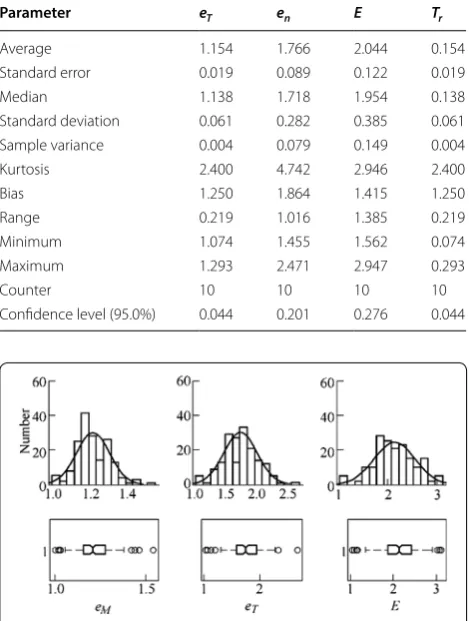
Traditional, naturally aspirated diesel engines were tested in the amount of 10 units. Hence, the conclusions
Figure 6 Histograms and box plots for fuel injected gasoline engine groups
Table 6 Results of the calculations for fuel injected gasoline engine groups
Parameter eT en E Tr
Average 1.120 1.458 1.645 0.120 Standard error 0.004 0.018 0.025 0.004 Median 1.105 1.377 1.529 0.105 Standard deviation 0.065 0.271 0.378 0.065 Sample variance 0.004 0.074 0.143 0.004 Kurtosis 0.372 − 0.216 − 0.392 0.372 Bias 0.853 0.783 0.744 0.853 Range 0.340 1.247 1.685 0.340 Minimum 1.005 1.039 1.062 0.005 Maximum 1.345 2.286 2.748 0.345 Counter 234 234 234 234 Confidence level (95.0%) 0.008 0.035 0.049 0.008
are uncertain. E= 2.044 ± 0.276 (Figure 10 and Table 10). In this manner the conformity of values for this type of engines following in Refs. [2, 3] was confirmed. The dis-tribution of E is flattened against the regular one having a left-side skewness. Values E are determined by en. The interval of the obtained values is E= 1.562,…, 2.947.
Turbocharged diesel engines in the amount of 171 units have shown E= 2.141 ± 0.063 (Figure 11 and Table 11). The distribution of E is close to normal of a slight right-side skewness. E is significantly influenced by en and determines its distribution. The interval of obtained val-ues is E= 1.036,…, 3.114.
Comparing the results (Figure 12), we can confirm that supercharged engines have the greatest flexibility. Gasoline supercharged engines have an average value of the coefficient of flexibility of 2.558, turbocharged die-sel engines − 2.141. Traditional diesel engines (naturally aspirated) of the value of 2.044 are within the range given in the literature. We can classify these engines as medium flexible according to Ref. [1]. The rest can be classified as low flexibility engines. It is interesting that engines with
Table 7 Results of the calculations for fuel injected, turbocharged gasoline engines groups
Parameter eT en E Tr
Average 1.194 2.143 2.558 0.194 Standard error 0.030 0.117 0.158 0.030 Median 1.225 2.125 2.444 0.225 Standard deviation 0.078 0.309 0.418 0.078 Sample variance 0.006 0.096 0.175 0.006 Kurtosis − 0.919 2.049 − 0.583 − 0.919 Bias − 0.592 − 0.937 0.229 − 0.592 Range 0.217 0.983 1.166 0.217 Minimum 1.068 1.559 1.947 0.068 Maximum 1.285 2.542 3.112 0.285
Counter 7 7 7 7
Confidence level (95.0%) 0.072 0.286 0.386 0.072
Figure 8 Histograms and box plots for LPG, I and II generation engine groups
Table 8 Results of the calculations for LPG, I and II generation engine groups
Parameter eT en E Tr
Average 1.147 1.567 1.808 0.147 Standard error 0.008 0.045 0.060 0.008 Median 1.145 1.493 1.748 0.145 Standard deviation 0.065 0.357 0.482 0.065 Sample variance 0.004 0.127 0.233 0.004 Kurtosis − 0.127 6.062 5.345 − 0.127 Bias 0.311 1.969 1.842 0.311 Range 0.307 2.079 2.752 0.307 Minimum 1.007 1.111 1.140 0.007 Maximum 1.314 3.191 3.892 0.314
Counter 64 64 64 64
Confidence level (95.0%) 0.016 0.089 0.120 0.016
Figure 9 Histograms and box plots for LPG IV generation engine
Table 9 Results of the calculations for LPG IV generation engine groups
Parameter eT en E Tr
Average 1.130 1.441 1.646 0.130 Standard error 0.017 0.054 0.087 0.017 Median 1.099 1.342 1.491 0.099 Standard deviation 0.081 0.260 0.416 0.081 Sample variance 0.007 0.068 0.173 0.007 Kurtosis 0.918 − 0.608 0.246 0.918 Bias 1.265 0.866 1.136 1.265 Range 0.303 0.891 1.530 0.303 Minimum 1.037 1.109 1.150 0.037 Maximum 1.340 2.000 2.680 0.340
Counter 23 23 23 23
alternative I and II generation LPG fueling are more flex-ible (1.808) than the base fuel injected engines (1.645). This was drawn attention to in Ref. [30].The main param-eters responsible for this status quo was the composition of the mixture shifted towards enriched mixture in this type of LPG systems. The values of the fuel injected gaso-line engines and IV generation LPG engines are close 1.645 and 1.646, which also indicates appropriate engine adaptation to alternative fueling.
Analyzing Figure 12 we can see that value en deter-mines E while in the literature most attention is devoted to eT. If we want to obtain the highest value of the coef-ficient of flexibility, we need to provide the maximum of torque at low speeds, which is traditionally done by supercharging. As we already know, flexibility is the capa-bility of reacting of the engine to variable engine loads. It is not only the surplus of torque but also the range of engine speeds at which it occurs.
6 Conclusions
(1) The determined values of the coefficients of flex-ibility are a complex study related to combustion engines of different fueling systems used in pas-senger vehicles.
(2) The results are related to the characteristics of engines in service, of a varied level of wear.
(3) The greatest flexibility have supercharged engines, that, in the case of passenger vehicles,
Figure 10 Histograms and box plots for naturally aspirated diesel groups
Table 10 Results of the calculations for naturally aspirated diesel groups
Parameter eT en E Tr
Average 1.154 1.766 2.044 0.154 Standard error 0.019 0.089 0.122 0.019 Median 1.138 1.718 1.954 0.138 Standard deviation 0.061 0.282 0.385 0.061 Sample variance 0.004 0.079 0.149 0.004 Kurtosis 2.400 4.742 2.946 2.400 Bias 1.250 1.864 1.415 1.250 Range 0.219 1.016 1.385 0.219 Minimum 1.074 1.455 1.562 0.074 Maximum 1.293 2.471 2.947 0.293
Counter 10 10 10 10
Confidence level (95.0%) 0.044 0.201 0.276 0.044
Figure 11 Histograms and box plots for turbocharged diesel groups
Table 11 Results of the calculations for turbocharged diesel groups
Parameter eT en E Tr
Average 1.217 1.750 2.141 0.217 Standard error 0.007 0.021 0.032 0.007 Median 1.208 1.739 2.126 0.208 Standard deviation 0.089 0.271 0.416 0.089 Sample variance 0.008 0.074 0.173 0.008 Kurtosis 0.809 0.504 0.037 0.809 Bias 0.477 0.011 − 0.049 0.477 Range 0.543 1.660 2.078 0.543 Minimum 1.002 1.028 1.036 0.002 Maximum 1.544 2.688 3.114 0.544 Counter 171 171 171 171 Confidence level (95.0%) 0.013 0.041 0.063 0.013
we can classify as medium group. The rest are engines of low flexibility.
(4) Individual cases of highly flexible engines have been observed in the group of diesel engines (2.94), turbo diesel engines and turbo gasoline engines (3.11).
(5) The deficit of values describing the flexibility of engines fitted with LPG systems has been elimi-nated.
(6) In I and II generation LPG fueled engines the maximum value of E = 3.89 was recorded, which confirms very high flexibility.
(7) Engines fitted with I and II generation LPG sys-tems have greater flexibility than their base gaso-line fuel injected counterparts.
(8) Conformity of the flexibility for fuel injected gas-oline engines with IV generation LPG has been confirmed, which proves appropriate engine adaptation to alternative fueling.
(9) Not in all cases, the number of samples was suf-ficiently high to adequately represent the popula-tion, which is why, some of the results should be treated as uncertain.
(10) Research needs to be continued, based on techni-cal data for new engines to be able to determine the flexibility of utility vehicles, farm tractors, etc.
Authors’ contributions
The author read and approved the final manuscript.
Authors’ Information
Dariusz Szpica, born in 1971, is currently a PhD MEng at Faculty of Mechanical Engineering, Bialystok University of Technology, Poland. His research interests include fuel supply in combustion engines.
Competing Interests
The authors declare no competing financial interests.
Funding
The research has been carried out within work no. S/WM/1/2018 realized at Bialystok University of Technology and financed from the funding allocated for science by the Ministry of Science and Higher Education – Poland.
Received: 21 April 2017 Accepted: 16 April 2019
References
[1] W Flossel. Elasticity and specific power output. Stuttgart: Franckh’sche Verlagshandlung, W. Keller & Co, 1950. (in German)
[2] A I Grishkevich. Cars theory. Minsk: Higer School, 1986. (in Russian) [3] L Prochowski. Mechanics of movement. Warsaw: WKL, 2005. (in Polish) [4] J Myslowski, J Koltun. Flexibility of piston internal combustion engines.
Warsaw: WNT, 2000. (in Polish)
[5] J Myslowski, J Myslowski. Simulation testing of the MAN engines response. MOTROL Commission of Motorization and Energetics in Agricul-ture, 2003, 5: 104–108. (in Polish)
[6] D Szpica, J Czaban. The flexibility of car the diesel engines on example of group 1.9TDi of firm the Volkswagen. Combustion Engines, 2011, 3(50): 1–6. (in Polish)
[7] A W Bogatyrev, J K Esenovski‑Lashkov, M L Nasonovski, et al. Automobiles.
Moscow: KolosS, 2004. (in Russian)
[8] A N Kolchin, W P Demidov. Calculation of automobile and tractor engines. Minsk: Higer School, 2008. (in Russian)
[9] M Debicki. Car theory: Transmission theory. Warsaw: WNT, 1971. (in Polish) [10] D Szpica, J Piwnik, M Sidorowicz. The motion storage characteristics as
the indicator of stability of internal combustion engine ‑ receiver coop‑ eration. Mechanika, 2014, 20(1): 108–112.
[11] J Myslowski, J Myslowski. Leidemann’s formulas coefficients correction for presents requirements of technology state. Combustion Engines, 2007, SC2: 418–423.
[12] K Prajwowski, G Tarczynski. Analytical determination of partial power characteristics using Leidemann`s formulas. The Archives of Automotive Engineering, 2005, 1: 49–57. (in Polish)
[13] A Stonys, J Sapragonas, S Mockus. The analogy method for the descrip‑ tion of external characteristic of inner combustion engines. Transport, 2004, 5(16): 214–218.
[14] D Szpica, J Czaban. Leideman’s equation and modern construction of inter‑ nal combustion engine. Przeglad Mechaniczny, 2010, 6: 24–29. (in Polish) [15] P I Bortnicki, W I Zadorozny. Traction–speed characteristics of cars. Minsk:
Higher School, 1978. (in Russian)
[16] A S Litvinov, J E Farobin. Car: Operational properties theory. Moscow: Mashinostroienie, 1989. (in Russian)
[17] H S JO, Y I PARK, J M LEE, et al. A study on the improvement of the shift characteristics for the passenger car automatic transmission. International Journal of Vehicle Design, 2000, 23(3–4): 307–328.
[18] M R Gabdullin, N M Filkin, R S Muzafarov, et al. Development of a KESU with an automatic step less transmission of a very small passenger car (ATV). Izhevsk: Izhevski State Technological University, 2012: 129–136. (in Russian)
[19] M Kojic, D Obradovic, Z Bogdanovic. Dynamic analysis of vehicle propul‑ sion group with nonlinear characteristics of supports and arbitrary motion of the car body. International Journal of Vehicle Design, 2001, 26(5): 523–540.
[20] U K Lee, C S Han. A method for predicting dynamic behaviour character‑ istics of a vehicle using the screw theory ‑ part I. Proceedings of the Institu-tion of Mechanical Engineers, Part D: Journal of Automobile Engineering, 2008, 222 (D1): 65–77.
[21] L Li, C Sandu. On the impact of cargo weight, vehicle parameters, and terrain characteristics on the prediction of traction for off‑road vehicles.
Journal of Terramechanics, 2007, 44(3): 221–238.
[22] S Moridpour, G Rose, M Sarvi, et al. Influence of the surrounding traffic characteristics on lane changing decision of heavy vehicle drivers. Road & Transport Research, 2012, 21(3): 19–33.
[23] R Pueboobpaphan, B Van Arem. Driver and vehicle characteristics and platoon and traffic flow stability. Understanding the relationship for design and assessment of cooperative adaptive cruise control transport.
Transportation Research Record, 2010, 2189: 89–97.
[24] G An, Z Y Wang, C Q Zhang, et al. The torque measurement and analysis of state characteristic on power transmission system of vehicle. Proceed-ings of A 6th International Symposium on Test and Measurement (ISTM), Dalian, China, 1–4 June, 2005, 1–9: 4556–4560.
[25] M French, A Stark. Chassis dynamometers. Experimental Techniques, 2000, 24(4): 45–46.
[26] J Czaban, D Szpica. Drive test system to be used on roller dynamometer.
Mechanika, 2013, 19(5): 600–605.
[27] T Kear, D A Niemeier. On‑road heavy‑duty diesel particulate matter emis‑ sions modeled using chassis dynamometer data. Environmental Science & Technology, 2006, 40(24): 7828–7833.
[28] S B Kwon, K W Lee, K Saito, et al. Size‑dependent volatility of diesel nanoparticles: Chassis dynamometer experiments. Environmental Science & Technology, 2003, 37(9): 1794–1802.
[29] W G Wang, N N Clark, D W Lyons, et al. Emissions comparisons from alter‑ native fuel buses and diesel buses with a chassis dynamometer testing facility. Environmental Science & Technology, 1997, 31(11): 3132–3137. [30] D Szpica, J Czaban. Comparison of classic and alternative power supply

![Table 4 Dependence of the flexibility on the power output [10]](https://thumb-us.123doks.com/thumbv2/123dok_us/9586886.1941333/3.595.56.291.428.461/table-dependence-of-the-flexibility-the-power-output.webp)