O R I G I N A L R E S E A R C H
Open Access
Test-retest reliability and convergent
validity of (R)-[
11
C]PK11195 outcome
measures without arterial input function
Pontus Plavén-Sigray
1*, Granville James Matheson
1, Zsolt Cselényi
1,2, Aurelija Jucaite
1,2, Lars Farde
1,2and Simon Cervenka
1Abstract
Purpose:The PET radioligand (R)-[11C]PK11195 is used to quantify the 18-kDa translocator protein (TSPO), a marker for glial activation. Since there is no brain region devoid of TSPO, an arterial input function (AIF) is ideally required for quantification of binding. However, obtaining an AIF is experimentally demanding, is sometimes uncomfortable for participants, and can introduce additional measurement error during quantification. The objective of this study was to perform an evaluation of the test-retest reliability and convergent validity of techniques used for quantifying (R)-[11C]PK11195 binding without an AIF in clinical studies.
Methods:Data from six healthy individuals who participated in two PET examinations, 6 weeks apart, were analyzed. Regional non-displaceable binding potential (BPND) values were calculated using the simplified reference tissue model, with either cerebellum as reference region or a reference input derived using supervised cluster analysis (SVCA). Standardized uptake values (SUVs) were estimated for the time interval of 40–60 min.
Results:Test-retest reliability for BPNDestimates were poor (80% of ICCs < 0.5). BPNDestimates derived without an AIF were not correlated with BPND, total or specific distribution volume from the 2TCM using an AIF (allR
2 < 12%). SUVs showed moderate reliability but no correlation to any other outcome measure.
Conclusions:Caution is warranted when interpreting patient-control comparisons employing (R)-[11C]PK11195 outcome measures obtained without an AIF.
Keywords: (R)-[11C]PK11195, Arterial input function, Reference region, Supervised cluster analysis, Test-retest, Reliability
Introduction
(R)-[11C]PK11195 was the first positron emission
tomog-raphy (PET) radioligand developed for quantification of the translocator protein (TSPO). Within the brain, TSPO is mainly expressed in glial cells. Based on in vitro studies showing increases in TSPO expression in response to pro-inflammatory stimuli, the protein has been considered a biomarker for brain immune activation [1]. As such, (R)-[11C]PK11195 has, since the early 1990s, been applied in a wide range of clinical studies [2].
TSPO is expressed throughout the brain which means that no region can serve as a reference for quantification of specific (R)-[11C]PK11195 binding. Instead, a metabolite-corrected arterial input function (AIF) must be obtained and used as an input function for a kinetic model from which binding parameters can be estimated. Common measures of regional binding derived from the use of an AIF are total distribution volume (VT), specific distribution volume (VSor BPP), and binding potential (BPND) [3].
Obtaining a metabolite-corrected input function is costly, often uncomfortable for research participants, and can also be prone to measurement error. Therefore, alternative approaches for quantifying binding have been suggested which are less demanding and which do not require an AIF. The most simple method is to calculate
* Correspondence:[email protected]
1Department of Clinical Neuroscience, Center for Psychiatry Research,
Karolinska Institutet and Stockholm County Council, SE-171 76 Stockholm, Sweden
Full list of author information is available at the end of the article
the radioactivity concentration in a brain region normal-ized by the injected radioactivity and the subject’s weight (standardized uptake value or SUV). As such, the SUV does not directly reflect specific binding since the signal also contains non-specific binding and radioactivity from vasculature. Importantly, SUVs are also dependent on the rate and extent of radioligand delivery to the brain. This means that results may be influenced by cerebral blood flow or peripheral changes such as differences in metabolism or blood binding. For TSPO, previous studies have shown a high correlation between (R)-[11C]PK11195
VTand SUVs in synovial tissue in the knee joint [4, 5].
However, it has been shown that in pathological condi-tions characterized by reduced rates of flow or variacondi-tions in blood volume, the use of SUVs for quantifying (R)-[11C]PK11195 brain uptake yields biased and unpre-cise outcomes [6]. In addition, the high concentration of TSPO in peripheral tissues, which may be altered during peripheral inflammation, can greatly influence the extent of radioligand brain delivery [7]. Due to these reasons, SUVs are unlikely to be an unbiased index of TSPO bind-ing in brain.
An alternative method for quantifying (R)-[11C]PK11195
binding without the use of an AIF is the supervised cluster
analysis (SVCA) method [8,9]. SVCA, which is performed
on dynamic PET images, aims to segment voxels into clas-ses, differentiated by their kinetic behavior. The goal is to isolate gray matter (GM) voxels assumed to contain negli-gible levels of specific binding. These voxels are then used to establish a time-activity curve (TAC) serving as a ence input in a kinetic model, such as the simplified refer-ence tissue model (SRTM) [10]. However, application of the SVCA method has some limitations. The kinetic classes can produce different results depending on scanner type, acquisition protocol, and radioligand, and it is important to evaluate the classes prior to ap-plying them clinically. The SVCA method has been
used in (R)-[11C]PK11195 studies to compare TSPO
binding between healthy control subjects and patients
with Alzheimer’s disease [11, 12], multiple sclerosis
[13], traumatic brain injury [14], and schizophrenia [15] or studies which examined changes in TSPO
ex-pression in normal aging [16, 17].
Another simplified approach to obtain BPND values
without arterial sampling is to use a reference tissue model with the cerebellum as reference region, despite the fact that the cerebellum contains non-negligible levels of TSPO [18]. Since there is specific binding of
(R)-[11C]PK11195 in the reference region, ensuing BPND
values will not reflect the“true”binding potential but ra-ther pseudo-binding potential (pseudo-BPND). One
pre-vious study found that pseudo-BPND was correlated to
BPND from a constrained version of the 2TCM, using a
sample consisting of elderly and patients with traumatic
brain injury [19]. Pseudo-BPND values have also been
used, for example, to compare (R)-[11C]PK11195 binding
in healthy controls and in patients with schizophrenia [20,21], major depressive disorder [22], and glioma [23]. In order for PET quantification methods to be useful in clinical studies, they should yield outcomes which are both reliable and valid. Two previous studies evaluated a set of different methods, with and without AIF, for quantifying
(R)-[11C]PK11195 binding [19, 24], but did not examine
the test-retest reliability of ensuing outcome measures. In a previous test-retest study of six healthy subjects per-formed at our center, the reliability of (R)-[11C]PK11195
BPND values obtained using AIF were found to be very
poor in most target regions examined [25]. In contrast, the test-retest reliability of (R)-[11C]PK11195 BPND using SRTM with SVCA reference has been evaluated in four patients with Alzheimer’s disease [8]. In that study, ICC values were found to be high in most regions of interest. However, no study has yet examined the test-retest reli-ability of SVCA in healthy controls. To our knowledge,
the reliability of (R)-[11C]PK11195 SUV or BPND from
SRTM with the cerebellum as reference has never been re-ported in healthy control subjects, despite both outcomes being applied in clinical patient-control comparisons.
The main objective of this study was to evaluate the test-retest reliability and repeatability of (R)-[11C]PK11195
(1) SUVs and (2) BPND obtained from SRTM, using
cere-bellum or SVCA-derived voxels as reference, respectively. The second objective was to examine the convergent val-idity of these outcomes by correlating them toVT,VS, and
BPNDvalues derived using an AIF.
Methods and materials Subjects and imaging procedures
In the present analysis, we included PET examinations from six healthy male subjects (mean age = 25.8±3.9) who participated in a previous test-retest study of
(R)-[11C]PK11195 [25]. All subjects gave written
in-formed consent according to the Helsinki Declaration prior to their participation in the original study. The study was approved by the Karolinska University Hos-pital Radiation Safety Committee and the Regional Eth-ics Committee in Stockholm.
All subjects participated in two PET measurements that took place approximately 6 weeks apart and were run on an ECAT Exact HR 47 system (Siemens/CTI, Knoxville, TN, USA). Structural magnetic resonance imaging (MRI) examinations were performed on a Siemens 1.5T Magne-tom, resulting in a T1-weighted image for each subject.
Production and radio-synthesis of (R)-[11C]PK11195 has
ROI delineation was performed on the subjects’ T1-weighted images using the FreeSurfer software
(5.0.0, http://surfer.nmr.mgh.harvard.edu/). ROIs were
co-registered to PET images using SPM5 (Wellcome Department of Cognitive Neurology, UK). Sixty-three-minute TACs were extracted for the whole of GM, frontal cortex, striatum, thalamus, hippocampus, and cerebellum (CER), except for one PET examination where only a 50-min scan was obtained.
Quantification of outcomes with and without AIF
The two-tissue compartment model (2TCM) with AIF was used to estimate kinetic rate constants. The fraction of blood volume in target tissue (vB) and the delay be-tween start of the AIF and the ROI TAC were fitted using the 2TCM applied on the entire GM TAC. These parame-ters were held constant for the remaining ROI fits.VT,VS,
and BPND were then calculated using the rate constants.
In addition to the above, we also evaluated the outcomes from the 2TCM when fitting vB separately for each ROI, as this has been suggested to yield less bias and better fit for BPND(k3/k4) estimates [24].
SUVs were calculated from the average radioactivity concentration in frames spanning from 40 to 60 min of the regional TACs and dividing by the injected radio-activity and the subject’s body weight. A time span of 40–60 min was chosen since this has previously shown
to produce SUVs which were associated withVTin knee
joints in patients with rheumatoid arthritis [4]. However, we also evaluated three additional time intervals span-ning from 10 to 30, 20 to 40, and 30 to 50 min.
The original SVCA method classifies PET voxels into six different tissue types associated with distinct kinetic profiles: (1) GM with high specific binding, (2) GM with low specific binding, (3) white matter, (4) soft tissue, (5) bone, and (6) blood. It has been shown that removal of bone and soft tissue, by using a MRI defined brain mask, prior to performing SVCA reduced variability of binding estimates and improved correlation to outcomes derived using an AIF [26]. We therefore applied this restricted SVCA method (SVCA4), using the MATLAB software
“Super-PK” (Imperial Innovations, Imperial College
London). The Super-PK software was modified in order to be compatible with the scanning protocol applied in this study. Specifically, a cubic Gaussian smoothing ker-nel (FWHM 4 mm) was applied to all PET images prior to the analysis, and the 30-s background frame present in the population-based kinetic classes was removed. A refer-ence TAC was then obtained for each PET measurement consisting of GM voxels classified as being associated with low specific binding. SRTM (called SRTM-SVCA4 below)
was applied to estimate BPND for all ROIs. In this study,
the primary results from SVCA4 method is based on the kinetic classes from Turkheimer et al. [8]. However, we
also evaluated the reliability of outcomes derived using two additional sets of population-based kinetic classes: one set from VU University Medical Center Amsterdam (VUMC) [9] and an unpublished set from the Turku PET Centre (TPC). This was done in order to examine the ro-bustness of the SVCA4 method when using different population-based kinetic classes.
It has been shown that by using a version of SRTM that takes the radioactivity contribution from the vasculature
into account, separation in (R)-[11C]PK11195 SVCA4
de-rived BPND between patients with AD and healthy
con-trols can be improved [9, 27]. In addition to the SRTM
algorithm, this model (called SRTMv) estimates and cor-rects for the fraction of blood volume in both target and reference TACs, by using an image-derived blood curve. Hence, we also evaluated the performance of SRTMv when using a reference curve derived from SVCA4 (SRTMv-SVCA4). Image-derived blood curves were ob-tained by extracting radioactivity from the entire scan from a region defined by the 10 voxels of highest intensity from the first minute of each examination, as described previously [27].
The SRTM with the cerebellum as pseudo-reference region (SRTM-CER) was also applied on all PET
mea-surements and TACs to obtain BPND values for each
ROI.
Finally, we also calculated VT, VS, and BPND values
from the cerebellum and the SVCA4 reference TAC using the 2TCM with an AIF. This was done in order to both ascertain that the results were similar to previously published data and to evaluate the reliability and stability of the reference input.
Statistical analyses
The test-retest reliability, repeatability, and precision were examined by calculation of the intraclass correl-ation coefficient (ICC), the percentage average absolute variability (AbsVar), and the standard error of measure-ment (SEM), respectively. Since AbsVar can scale with the additive magnitude of the outcome, this particular metric is not suitable for comparing different outcomes with different means. We therefore also report the test-retest metric minimum detectable difference (MD). MD is based on the precision of an outcome (SEM) and is an approximation of the size of a difference from one measurement to another measurement which would be
needed to detect a “real” change (according to a 95%
confidence interval; [28]). MD is reported as a percent-age of the absolute mean of the outcome, in order to allow for comparison between different measures.
specific binding to target. If they are valid outcomes, they should therefore be correlated to one other. For
in-stance, both VS and BPND are defined as being
propor-tional to the availability of target (∝ Bavail/Kd), and a lack of correlation would therefore imply that one or both of the outcomes are expressing a high degree of error or im-precision. Another reason for evaluating the correlations between outcomes is to inform the design of future meta-analyses. Outcomes which are only weakly associ-ated with one another should likely not be entered into the same meta-analytic model, as this would violate a crit-ical statistcrit-ical model assumption and thereby yield unin-terpretable estimates of effect size.
All kinetic modeling were performed using the
R-package “kinfitr” (version 0.3.0, www.github.com/
mathesong/kinfitr) together with“nls.multstart”[29]. All statistical analyses were carried out in R (v.3.3.2“Sincere Pumpkin Patch”).
Results
Test-retest reliability of outcome measures derived with and without an AIF
Table 1 shows the mean, SD, and test-retest metrics for
all outcomes. BPND values from SRTM using SVCA4
and the cerebellum as reference, and SRTMv using SVCA4 as reference were in the same range as described
previously for healthy control subjects [8, 9]. There was
a large difference in magnitude of BPND values derived
with and without the use of an AIF. Regional BPND values from the 2TCM were on average 7 times higher
than BPND from SRTM-SVCA4 and over 700 times
higher than BPND from SRTM-CER. VT values for the
SVCA4 reference TACs were of a similar magnitude and range (mean = 0.74, SD = 0.18, range = 0.49 to 0.96) com-pared to previously published results [9].
In the present analysis, SUVs,VT, andVShad the
high-est reliability across all ROIs (median ICCSUV= 0.84;
me-dian ICCVT= 0.69; median ICCVS= 0.67). BPND from
SRTM and SRTMv with SVCA4 reference showed the lowest overall reliability (median ICC = 0.21 and−0.14).
SUV,VT, andVSshowed on the smallest (and therefore
best) minimum detectable difference (median MDSUV= 38;
median MDVT= 43; median MDVS= 34), while BPNDfrom
SRTM-CER showed the highest MD (median MD = 444).
Test-retest reliability of binding in the cerebellum and the SVCA4-derived reference
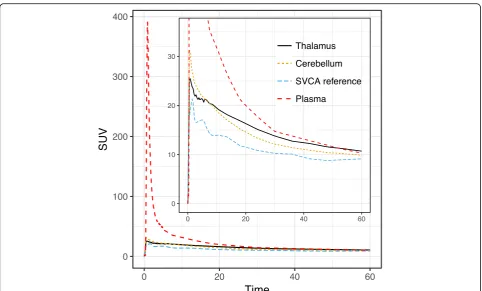
Figure1displays the average of all subjects’TACs for the cerebellum ROI, SVCA reference, and the metabolite-cor-rected plasma curve, as well as the thalamus ROI.
Using the 2TCM, we derivedVT,VS, and BPND(k3/k4) values for the cerebellum ROIs, as well as for the SVCA4 reference TACs. ICC, AbsVar, and MD values were similar to those reported for the target ROIs
(Table2).VTvalues were in the same range as described
previously (see Fig. 3 in [9]).
Evaluation of additional population-based kinetic classes for supervised cluster analysis
In addition to the population-based kinetic classes devel-oped by [8], we also applied and evaluated two different sets of population-based kinetic classes for SVCA4. The first set was developed by PET researchers at VUMC [9], and the second set was developed by the Turku PET
group (TPC) using the TPC (R)-[11C]PK11195 database
which partly consists of the subjects included in this
art-icle. All test-retest metrics is presented in Table 3. The
VUMC classes yielded higher average BPND values, but
there were no substantial differences in reliability or pre-cision regardless of what population-based classes were used.
Convergent validity of all outcome measures
Figure 2 shows the relationships between all
(R)-[11C]PK1195 outcomes derived using AIF (VT, VS,
and BPND) and all outcomes derived without using AIF (BPND:SRTM-SVCA, BPND:SRTMv-SVCA, BPND:SRTM-CER, and
SUV). The correlation between BPND from 2TCM and
BPNDfrom SRTM-SVCA4, SRTMv-SVCA4, or SRTM-CER
was negligible to non-existent, with an explained vari-ance (R2) < 2% for all associations.VTandVSwere highly correlated (R2= 69%), but neither showed a strong associ-ation with BPNDfrom AIF (R2< 9%). SUVs were not corre-lated to any other outcome measures (R2< 9%).
Additional analyses
We also fitted the 2TCM allowing vB to differ for each ROI. Ensuing BPND(k3/k4) values showed better reliabil-ity (mean ICC = 0.6) and repeatabilreliabil-ity (mean AbsVar =
23%) compared to BPNDwhen fitted with a fixed vB, but
the test-retest metrics forVTand VSwere notably worse
(VT mean ICC = 0.33, mean AbsVar = 21%; VS mean
ICC = 0.29, mean AbsVar = 25%, see Additional file 1:
Table S1). The correlation between 2TCM VT,VS, and
BPND and all other BPND outcomes (SRTM-CER,
SRTM-SVCA, and SRTMv-SVCA) was still low to negli-gible (allR2< 9%, see Additional file1: Figure S1).
We also evaluated different time intervals for the SUV outcome: 10–30, 20–40, and 30–50 min. No interval yielded superior test-retest metrics (ICC values ranged from 0.80 to 0.82, AbsVar 21 to 22%) compared to 40– 60 min, and correlations to remaining outcomes were still negligible to low (all R2< 12%). All SUV intervals were however strongly correlated to each other (allR2> 95%).
Discussion
The objective of this study was to examine the test-retest
outcomes commonly applied in clinical in vivo studies of TSPO binding. Specifically, we evaluated outcome mea-sures of radioligand brain exposure and binding which do not make use of an arterial input function (AIF) and com-pared them with binding outcomes derived using an AIF (i.e.,VT,VS, and BPNDfrom the 2TCM).
There was a striking difference in magnitude between
BPND values from 2TCM using an AIF and BPNDvalues
from SRTM-SVCA4 and SRTM-CER, with much higher
BPND values obtained using the 2TCM compared to the
other two measures. This signifies that the use of SVCA, as well as the cerebellum, for derivation of a reference
Table 1Mean values (for both PET examinations) and test-retest reliability, repeatability, and precision estimated using the intra-class correlation coefficient (ICC), average absolute variability in percentage (AbsVar), and standard error of measurement (SEM) of different outcome measures derived with or without AIF. The minimum detectable difference (MD) denotes the difference (expressed as a percentage of the mean) needed between two measurements for them to be significantly different from each other
Measure Region Mean SD ICC AbsVar% SEM MD% VT(2TCM) FC 0.72 0.16 0.73 15 0.08 32
GM 0.7 0.17 0.78 15 0.08 31 HIP 0.72 0.19 0.66 21 0.11 44 STR 0.76 0.17 0.44 18 0.13 46 THAL 0.77 0.22 0.69 21 0.12 43 VS(2TCM) FC 0.42 0.09 0.68 14 0.05 32
GM 0.42 0.09 0.67 15 0.05 34 HIP 0.45 0.1 0.35 21 0.08 51 STR 0.44 0.1 0.23 23 0.09 58 THAL 0.48 0.14 0.91 13 0.04 24 BPND(2TCM) FC 1.49 0.33 0.65 18 0.2 37
GM 1.62 0.4 0.31 29 0.33 56 HIP 2.02 0.77 −0.19 50 0.84 115 STR 1.41 0.39 0.32 22 0.32 63 THAL 1.79 0.67 −0.11 39 0.71 110 BPND(SRTM-SVCA4) FC 0.17 0.04 0.21 29 0.04 63
GM 0.21 0.06 0.34 27 0.05 59 HIP 0.17 0.09 −0.39 83 0.1 160 STR 0.21 0.09 −0.12 59 0.09 120 THAL 0.35 0.09 0.32 22 0.07 55 BPND(SRTMv-SVCA4) FC 0.15 0.09 −0.49 113 0.11 194
GM 0.22 0.1 0.04 62 0.1 122 HIP 0.17 0.08 −0.84 75 0.11 180 STR 0.2 0.1 0.79 38 0.04 60 THAL 0.36 0.12 −0.14 46 0.13 97 BPND(SRTM-CER) FC −0.07 0.09 0.5 160 0.06 258
GM −0.03 0.06 0.51 277 0.04 444 HIP 0.01 0.08 0.19 181 0.07 1920 STR −0.02 0.17 −0.14 196 0.18 2963 THAL 0.09 0.06 0.67 494 0.04 112 SUV 40–60 min FC 10.31 3.72 0.89 19 1.26 34
GM 10.44 3.55 0.87 19 1.3 34 HIP 10.43 3.36 0.82 19 1.43 38 STR 10.27 3.64 0.8 26 1.63 44 THAL 11.36 3.81 0.84 20 1.55 38
TAC yields only relative or pseudo-BPND values. TSPO is expressed throughout the brain, and specific binding is to be expected in every voxel [18,30]. Hence, it is un-likely that SVCA4 or the cerebellum can be used to es-tablish a TAC that reflects a true reference, devoid of
TSPO, for (R)-[11C]PK11195.
In general, all (R)-[11C]PK11195 outcome measures
analyzed in this study showed poor to moderate
reliabil-ity. For the whole GM ROI, only SUV and VT showed
acceptable reliability (ICC > 0.65) [31]. Assuming that the true TSPO concentration is stable between PET ex-aminations, an ICC of 0.5 suggests that as much of the variance in the sample is attributable to true signal as
can be attributed to measurement error and noise. All outcomes derived without the use of an AIF showed ICC values around or below 0.5, suggesting poor reliabil-ity for these measures. SRTM with the cerebellum as ref-erence region showed the largest imprecision and MD.
These results suggest that a change in BPND from
SRTMCERwould need to be, on average, larger than 10
times the mean in order to detect a true difference be-tween two measurements of the same subject. In
com-parison, a change in VS of (on average) 40% would be
necessary to detect a difference that is not only due to
noise. The lack of reliability and precision for BPNDfrom
the cerebellum and SVCA can likely be explained by Fig. 1Average (R)-[11C]PK11195 reference (cerebellum and SVCA4) or input (metabolite-corrected plasma) TACs expressed in SUVs. The average
thalamus TAC is also presented to allow for comparison to a target ROI included in this study
Table 2Test-retest metrics forVT,VS, and BPNDvalues derived using the 2TCM from the cerebellum and the SVCA4 reference TACs
Method Measure Mean SD ICC AbsVar% SEM MD% Cerebellum VT 0.67 0.16 0.81 13 0.07 29
VS 0.43 0.11 0.67 18 0.06 39
BPND 1.91 0.31 −0.31 21 0.36 52
SVCA4 reference TAC VT 0.74 0.18 0.67 18 0.1 38
VS 0.46 0.13 0.69 20 0.07 43
BPND 1.72 0.52 0.77 22 0.25 40
having a similar (low) specific to non-specific binding ra-tio in both the target and pseudo-reference regions, leading to TACs which are similar in both shape and
magnitude. This yields BPND values which are close to
zero (or negative) and which are sensitive to even small amounts of measurement error.
Another limitation when using the cerebellum as ref-erence is that it requires researchers to establish signifi-cant equivalence [32, 33] in reference region-specific binding between the groups which are being compared. A non-significant difference between groups does not translate into evidence in favor of an absence of a differ-ence [34], contrary to conclusions sometimes drawn in literature.
VT,VS, and BPND derived from 2TCM showed little to
no correlation with BPND derived using outcomes
with-out an AIF. This indicates that BPNDfrom the reference
input models have little to no convergent validity in rela-tion to binding outcomes from AIF, and vice versa.
Hence, if eitherVT,VS, or BPNDderived using an AIF is
to be considered to be at least moderately associated
with specific TSPO binding, then BPND derived without
the use of AIF cannot be considered valid. However,
BPND from AIF also produced low ICC values and a
negligible association with VT and VS, suggesting that
this outcome is also unreliable and unstable. SUVs showed the highest average reliability but were not cor-related with any other outcome measures.
In healthy control subjects, a large portion of the
(R)-[11C]PK11195 signal consists of non-specific binding
and unbound radioligand, as determined by blocking
studies showing BPND values in the range of 0.8–0.9
[35]. As described, a low signal for specific binding in healthy controls may partly explain the low reliability observed in this study. In comparison, much higher reli-ability has been shown for SVCA in patients with Alz-heimer’s disease [8] where glial cell markers are known to be elevated based on postmortem studies [36]. This gains partial support from the fact that second gener-ation TSPO tracers, which show higher specific binding [37], also display higher ICC values in healthy control subjects [38]. It is hence likely that (R)-[11C]PK11195 outcomes would show higher reliability in clinical popu-lations with a significant increase in brain TSPO. How-ever, this would also imply that differences between patients and controls would need to be very large in order to be detectable. While such effects may be present in some patient groups, such as patients with
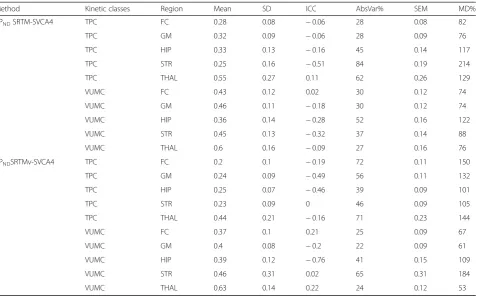
Table 3Test-retest metrics for BPNDvalues from the SVCA4 method using two additional population-based kinetic classes,
developed at VUMC and TPC, respectively
Method Kinetic classes Region Mean SD ICC AbsVar% SEM MD% BPNDSRTM-SVCA4 TPC FC 0.28 0.08 −0.06 28 0.08 82
TPC GM 0.32 0.09 −0.06 28 0.09 76 TPC HIP 0.33 0.13 −0.16 45 0.14 117 TPC STR 0.25 0.16 −0.51 84 0.19 214 TPC THAL 0.55 0.27 0.11 62 0.26 129 VUMC FC 0.43 0.12 0.02 30 0.12 74 VUMC GM 0.46 0.11 −0.18 30 0.12 74 VUMC HIP 0.36 0.14 −0.28 52 0.16 122 VUMC STR 0.45 0.13 −0.32 37 0.14 88 VUMC THAL 0.6 0.16 −0.09 27 0.16 76 BPNDSRTMv-SVCA4 TPC FC 0.2 0.1 −0.19 72 0.11 150
TPC GM 0.24 0.09 −0.49 56 0.11 132 TPC HIP 0.25 0.07 −0.46 39 0.09 101 TPC STR 0.23 0.09 0 46 0.09 105 TPC THAL 0.44 0.21 −0.16 71 0.23 144 VUMC FC 0.37 0.1 0.21 25 0.09 67 VUMC GM 0.4 0.08 −0.2 22 0.09 61 VUMC HIP 0.39 0.12 −0.76 41 0.15 109 VUMC STR 0.46 0.31 0.02 65 0.31 184 VUMC THAL 0.63 0.14 0.22 24 0.12 53
stroke [39], caution is advised for disorders for which in-creases in TSPO might be more subtle.
One caveat with this study is that the kinetic classes used for the SVCA method are sensitive to differences in the PET system, such as system type and acquisition protocol. It cannot be excluded that other scanners might have shown higher test-retest values for the SVCA outcomes, using the same de-sign. Importantly, the 6-week interval between PET measurements in this study means that TSPO levels may change from test to retest. This, in turn, would lead to lower reliability and precision. However, since many clinical studies aim to evaluate
longitu-dinal interventions or correlate (R)-[11C]PK11195
outcomes with more stable independent variables, this interval mimics that of realistic and relevant de-signs of PET studies. In addition, the time between measurements also should not impact the relative re-liability between different outcome measures of
spe-cific binding (such as VS and BPND), nor does it
affect the evaluation of convergent validity.
Conclusions
The results from this study suggest that caution is warranted for the application and interpretation of (R)-[11C]PK11195
BPND obtained using 2TCM or BPND from kinetic models
using the cerebellum or SVCA4 as reference. VTand VS
should likely be preferred over BPNDfrom 2TCM, since they
exhibited higher reliability and precision. However, the negli-gible correlations ofVTandVSto SUVs are concerning and not fully understood. One explanation might be that brain SUV values are sensitive to changes in peripheral binding of TSPO [7], while AIF-based outcomes are not. This hypoth-esis warrants further investigation in future studies.
Additional file
Additional file 1:Figure S1.Relationships between all (R)-[11C]PK1195 outcome measures, where whole-blood contribution to ROI radioactivity (vB) has been fitted for each ROI. Values from both PET examinations and all regions have been pooled in each panel. Pearson’s correlation coefficients (r)and explained variance (R2) are presented in the upper diagonal.
Table S1.Test-retest metrics for BPND,VS, andVTvalues derived using 2TCM
while fitting vB for each ROI separately. (PDF 157 kb)
Abbreviations
2TCM:Two-tissue compartment model; AbsVar: Absolute variability (or test-retest variability); AIF: Arterial input function; BPND: Non-displaceable binding
potential; CER: Cerebellum; FC: Frontal cortex; GM: Gray matter; HIP: Hippocampus; ICC: Intra-class correlation coefficient; MD: Minimum detectable difference; MRI: Magnetic resonance imaging; PET: Positron emission tomography; ROI: Region of interest; SEM: Standard error of measurement; SRTM: Simplified reference tissue model; SRTMv: Simplified reference tissue model with additional modeling of vB; STR: Striatum; SUV: Standardized uptake values; SVCA: Supervised cluster analysis; TAC: Time-activity curve; THA: Thalamus; TSPO: Translocator protein 18 kDa; vB: Radioactivity contribution from whole blood;VS: Specific distribution volume;VT: Total distribution volume
Acknowledgements
We thank Jouni Tuisku from the Turku PET Center for his help with methodological considerations during the course of the study. We would like to thank the staff at the Karolinska Institutet PET Centre for their assistance.
Funding
S.C. was supported by the Swedish Research Council (Grant No. 523-2014-3467). The remaining authors have no funding information to report.
Authors’contributions
PPS conceived of the study and designed the study. PPS and ZC carried out the image analysis. PPS and GJM performed the kinetic modeling. PPS carried out the statistical analyses. PPS and SC drafted the article. SC and LF supervised the study. All authors interpreted the results, critically revised the article, and approved of the final version for publication.
Ethics approval and consent to participate
The study was approved by the Stockholm Regional Ethical Board and carried out in accordance with the Helsinki declaration. Informed consent was obtained from all individual participants included in the study.
Consent for publication
Not applicable.
Competing interests
The data collection in the original study [25] was funded by AstraZeneca. LF, ZC, and AJ are employees at AstraZeneca. AstraZeneca had no role in the idea behind or design of the re-analyses of data carried out in this article. The remaining authors declare that they have no competing interests.
Publisher’s Note
Springer Nature remains neutral with regard to jurisdictional claims in published maps and institutional affiliations.
Author details
1Department of Clinical Neuroscience, Center for Psychiatry Research,
Karolinska Institutet and Stockholm County Council, SE-171 76 Stockholm, Sweden.2PET Imaging Centre, Precision Medicine and Genomics, IMED
Biotech Unit, AstraZeneca, Karolinska Institutet, Stockholm, Sweden.
Received: 4 July 2018 Accepted: 2 November 2018
References
1. Venneti S, Lopresti BJ, Wiley CA. Molecular imaging of microglia/ macrophages in the brain. Glia. 2013;61:10–23 Wiley Online Library. 2. Politis M, Su P, Piccini P. Imaging of microglia in patients with
neurodegenerative disorders. Front Pharmacol. 2012;3:96 Frontiers Media SA. 3. Innis RB, Cunningham VJ, Delforge J, Fujita M, Gjedde A, Gunn RN, et al.
Consensus nomenclature for in vivo imaging of reversibly binding radioligands. J Cereb Blood Flow Metab. 2007;27:1533–9.
4. Van Der Laken CJ, Elzinga EH, Kropholler MA, Molthoff CFM, van der Heijden JW, Maruyama K, et al. Noninvasive imaging of macrophages in rheumatoid synovitis using 11C-(R)-PK11195 and positron emission tomography. Arthritis Rheumatol. 2008;58:3350–5 Wiley Online Library.
5. Kropholler MA, Boellaard R, Elzinga EH, Van der Laken CJ, Maruyama K, Kloet RW, et al. Quantification of (R)-[11 C] PK11195 binding in rheumatoid arthritis. Eur J Nucl Med Mol Imaging. 2009;36:624–31 Springer.
6. Schuitemaker A, Van Berckel BNM, Kropholler MA, Kloet RW, Jonker C, Scheltens P, et al. Evaluation of methods for generating parametric (R)-[11C] PK11195 binding images. J Cereb Blood Flow Metab. 2007;27:1603–15 SAGE publications Sage UK: London, England.
7. Imaizumi M, Briard E, Zoghbi SS, Gourley JP, Hong J, Musachio JL, et al. Kinetic evaluation in nonhuman primates of two new PET ligands for peripheral benzodiazepine receptors in brain. Synapse. 2007;61:595–605 Wiley Online Library.
8. Turkheimer FE, Edison P, Pavese N, Roncaroli F, Anderson AN, Hammers A, et al. Reference and target region modeling of [11C]-(R)-PK11195 brain studies. J Nucl Med Soc Nuclear Med. 2007;48:158–67.
9. Yaqub M, Van Berckel BN, Schuitemaker A, Hinz R, Turkheimer FE, Tomasi G, et al. Optimization of supervised cluster analysis for extracting reference tissue input curves in (R)-[11C] PK11195 brain PET studies. J Cereb Blood Flow Metab. 2012;32:1600–8 SAGE Publications Sage UK: London, England. 10. Lammertsma AA, Hume SP. Simplified reference tissue model for PET
receptor studies. NeuroImage. 1996;4:153–8.
11. Van Berckel BN, Bossong MG, Boellaard R, Kloet R, Schuitemaker A, Caspers E, et al. Microglia activation in recent-onset schizophrenia: a quantitative (R)-[11 C] PK11195 positron emission tomography study. Biol Psychiatry. 2008; 64:820–2 Elsevier.
12. Parbo P, Ismail R, Hansen KV, Amidi A, Mårup FH, Gottrup H, et al. Brain inflammation accompanies amyloid in the majority of mild cognitive impairment cases due to Alzheimer’s disease. Brain. 2017.https://doi.org/10. 1093/brain/awx120.
13. Rissanen E, Tuisku J, Rokka J, Paavilainen T, Parkkola R, Rinne JO, et al. In vivo detection of diffuse inflammation in secondary progressive multiple sclerosis using PET imaging and the radioligand 11C-PK11195. J Nucl Med. Soc Nuclear Med. 2014;55:939–44.
14. Folkersma H, Boellaard R, Yaqub M, Kloet RW, Windhorst AD, Lammertsma AA, et al. Widespread and prolonged increase in (R)-11C-PK11195 binding after traumatic brain injury. J Nucl Med. Soc Nuclear Med. 2011;52:1235–9. 15. Van Der Doef TF, De Witte LD, Sutterland AL, Jobse E, Yaqub M, Boellaard R,
et al. In vivo (R)-[11C]PK11195 PET imaging of 18kDa translocator protein in recent onset psychosis. NPJ Schizophr. 2016;2:16031 Nature Publishing Group.
16. Schuitemaker A, van der Doef TF, Boellaard R, van der Flier WM, Yaqub M, Windhorst AD, et al. Microglial activation in healthy aging. Neurobiol Aging. 2012;33:1067–72 Elsevier.
17. Kumar A, Muzik O, Shandal V, Chugani D, Chakraborty P, Chugani HT. Evaluation of age-related changes in translocator protein (TSPO) in human brain using 11 C-[R]-PK11195 PET. J Neuroinflammation. 2012;9:232 BioMed Central.
18. Doble A, Malgouris C, Daniel M, Daniel N, Imbault F, Basbaum A, et al. Labelling of peripheral-type benzodiazepine binding sites in human brain with [3H] PK 11195: anatomical and subcellular distribution. Brain Res Bull. 1987;18:49–61 Elsevier.
19. Kropholler MA, Boellaard R, Schuitemaker A, Folkersma H, van Berckel BNM, Lammertsma AA. Evaluation of reference tissue models for the analysis of [11C](R)-PK11195 studies. J Cereb Blood Flow Metab. 2006;26:1431–41 SAGE publications Sage UK: London, England.
20. Holmes SE, Hinz R, Drake RJ, Gregory CJ, Conen S, Matthews JC, et al. In vivo imaging of brain microglial activity in antipsychotic-free and medicated schizophrenia: a [11C](R)-PK11195 positron emission tomography study. Mol Psychiatry. 2016;21:1672–9 Nature Publishing Group.
21. Di Biase MA, Zalesky A, O’keefe G, Laskaris L, Baune BT, Weickert CS, et al. PET imaging of putative microglial activation in individuals at ultra-high risk for psychosis, recently diagnosed and chronically ill with schizophrenia. Transl Psychiatry. 2017;7:e1225 Nature Publishing Group.
22. Holmes SE, Hinz R, Conen S, Gregory CJ, Matthews JC, Anton-Rodriguez JM, et al. Elevated translocator protein in anterior cingulate in major depression and a role for inflammation in suicidal thinking: a positron emission tomography study. Biol Psychiatry. 2018;83:61–9 Elsevier.
23. Su Z, Herholz K, Gerhard A, Roncaroli F, Du Plessis D, Jackson A, et al. [11C]-(R) PK11195 tracer kinetics in the brain of glioma patients and a comparison of two referencing approaches. Eur J Nucl Med Mol Imaging. 2013;40:1406– 19 Springer.
25. Jučaite A, Cselényi Z, Arvidsson A, Ahlberg G, Julin P, Varnäs K, et al. Kinetic analysis and test-retest variability of the radioligand [11C](R)-PK11195 binding to TSPO in the human brain - a PET study in control subjects. EJNMMI Res. 2012;2:15.
26. Boellaard R, Turkheimer FE, Hinz R, Schuitemaker A, Scheltens P, van Berckel BNM, et al. Performance of a modified supervised cluster algorithm for extracting reference region input functions from (R)-[11 C] PK11195 brain PET studies. Nucl Sci Symp Conf Rec 2008 NSS’08 IEEE. 2008:5400–2 IEEE.
https://doi.org/10.1109/NSSMIC.2008.4774453.
27. Tomasi G, Edison P, Bertoldo A, Roncaroli F, Singh P, Gerhard A, et al. Novel reference region model reveals increased microglial and reduced vascular binding of 11C-(R)-PK11195 in patients with Alzheimer’s disease. J Nucl Med. 2008;49:1249–56.
28. Weir JP. Quantifying test-retest reliability using the intraclass correlation coefficient and the SEM. J Strength Cond Res. 2005;19:231–40 LWW. 29. Padfield D, Matheson G. nls.multstart: robust non-linear regression using AIC
scores. 2018. Available from:https://cran.r-project.org/package=nls.multstart
30. Farde L. TSPO binding may also represent‘resting’microglia. Clin Transl Imaging. 2015;3:491–2 Springer.
31. Portney LG, Watkins MP. Foundations of clinical research: application to practice. 3rd ed. Stamford: Lange; 2009.
32. Schuirmann DJ. A comparison of the two one-sided tests procedure and the power approach for assessing the equivalence of average bioavailability. J Pharmacokinet Pharmacodyn. 1987;15:657–80 Springer.
33. Lakens D. Equivalence tests: a practical primer for t tests, correlations, and meta-analyses. Soc Psychol Personal Sci. 2017.https://doi.org/10.1177/ 1948550617697177SAGE Publications Sage CA: Los Angeles.
34. Dienes Z. Using Bayes to get the most out of non-significant results. Front Psychol. 2014;5:781 Frontiers.
35. Kobayashi M, Jiang T, Telu S, Zoghbi SS, Gunn RN, Rabiner EA, et al. 11C-DPA-713 has much greater specific binding to translocator protein 18 kDa (TSPO) in human brain than 11C-(R)-PK11195. J Cereb Blood Flow Metab. 2018; Available from:https://doi.org/10.1177/0271678X17699223. 36. Heneka MT, Carson MJ, El Khoury J, Landreth GE, Brosseron F, Feinstein DL,
et al. Neuroinflammation in Alzheimer’s disease. Lancet Neurol. 2015;14:388– 405 Elsevier.
37. Fujita M, Kobayashi M, Ikawa M, Gunn RN, Rabiner EA, Owen DR, et al. Comparison of four 11C-labeled PET ligands to quantify translocator protein 18 kDa (TSPO) in human brain: (R)-PK11195, PBR28, DPA-713, and ER176—based on recent publications that measured specific-to-non-displaceable ratios. EJNMMI Res. 2017;7:84 Available from:https://doi.org/10. 1186/s13550-017-0334-8.
38. Collste K, Forsberg A, Varrone A, Amini N, Aeinehband S, Yakushev I, et al. Test–retest reproducibility of [11C] PBR28 binding to TSPO in healthy control subjects. Eur J Nucl Med Mol Imaging. 2016;43:173–83 Springer. 39. Kreisl WC, Mbeo G, Fujita M, Zoghbi SS, Pike VW, Innis RB, et al. Stroke

![Fig. 2 Relationships between all (R)-[11C]PK1195 outcome measures. Values from both PET examinations and all regions have been pooled ineach panel](https://thumb-us.123doks.com/thumbv2/123dok_us/9621190.1944320/8.595.59.538.88.436/relationships-outcome-measures-values-examinations-regions-pooled-ineach.webp)
