O R I G I N A L A R T I C L E
Open Access
The core interthreshold zone during exposure to
red and blue light
Naoshi Kakitsuba
1*, Igor B Mekjavic
2and Tetsuo Katsuura
3Abstract
Background:This study tested the hypothesis that the core interthreshold zone (CIZ) changes during exposure to red or blue light via the non-visual pathway, because it is known that light intensity affects the central nervous system. We conducted a series of human experiments with 5 or 10 male subjects in each experiment.
Methods:The air temperature in the climatic chamber was maintained at 20 to 24°C. The subjects wore suits perfused with 25°C water at a rate of 600 cm3/min. They exercised on an ergometer at 50% of their maximum work rate for 10 to 15 minutes until sweating commenced, and then remained continuously seated without exercise until their oxygen uptake increased. The rectal temperature and skin temperatures at four sites were monitored using thermistors. The sweating rate was measured at the forehead with a sweat rate monitor. Oxygen uptake was monitored with a gas analyzer. The subjects were exposed to red or blue light at 500 lx and 1000 lx in both summer and winter.
Results:The mean CIZs at 500 lx were 0.23 ± 0.16°C under red light and 0.20 ± 0.10°C under blue light in the summer, and 0.19 ± 0.20°C under red light and 0.26 ± 0.24°C under blue light in the winter. The CIZs at 1000 lx were 0.18 ± 0.14°C under red light and 0.15 ± 0.20°C under blue light in the summer, and 0.52 ± 0.18°C under red light and 0.71 ± 0.28°C under blue light in the winter. A significant difference (P<0.05) was observed in the CIZs between red and blue light at 1000 lx in the winter, and significant seasonal differences under red light (P<0.05) and blue light (P<0.01) were also observed at 1000 lx.
Conclusions:The present study demonstrated that dynamic changes in the physiological effects of colors of light on autonomic functions via the non-visual pathway may be associated with the temperature regulation system.
Keywords:Body temperature regulation, Shivering, Sweating, Core interthreshold zone, Color of light
Background
In addition to the pathway of visual sensation, another pathway, the so-called ‘non-visible pathway’, is activated in response to visual stimuli. According to Klein et al. [1], visual information received by the retina is trans-ferred to the suprachiasmatic nucleus, and is then further transferred to the paraventricular nucleus of the hypothalamus and to the reticular formation. Finally, it reaches the pineal body, which controls the secretion of melatonin. Many previous studies have demonstrated the effects of light intensity on the central nervous system [2,3] and on the autonomic nervous system [4,5].
Since the pineal body is located near the hypothalamus, which regulates body temperature, reciprocal or one-sided afferent information can be incorporated into the temperature regulation system. Therefore, light intensity would be expected to influence thermal responses such as sweating and shivering.
The core interthreshold zone (CIZ) is defined as the range between core temperature at the onset of shiver-ing and that at the onset of sweatshiver-ing. A constant mean skin temperature (Tsk) is required to be independent of thermal responses due to changes in Tsk, and is recog-nized as reliable information for evaluating the charac-teristics of body temperature regulation. Kakitsubaet al. [6] demonstrated a seasonal difference in the CIZ as well as the effect of light intensity on the CIZ. The latter effect in particular indicates the possible incorporation * Correspondence:[email protected]
1Department of Environment and Technology, School of Science and Technology, Meijo University, 468-8502 Shiogamaguchi 1-501, Tenpaku-ku, Nagoya, Aichi Prefecture, Japan
Full list of author information is available at the end of the article
of the non-visual pathway into the temperature regula-tion system.
The effect of light color or color temperature on the central and autonomic nervous systems has been exten-sively studied. According to Takahashiet al.[7], the con-clusions drawn from experimental studies can be divided into two categories: studies suggesting that red light has an arousing effect as opposed to the mitigating effect of the color blue [3,4,8,9], and studies suggesting that blue light has an arousing effect as opposed to the mitigating effect of the color red [2,10]. Despite the lack of consist-ent findings on this topic, some effect of light color on the CIZ is expected since body temperature is controlled by the central and autonomic nervous systems. There-fore, the present study tested the hypothesis that the CIZ changes in response to red and blue light exposure.
Methods
Subjects
A series of the human experiments were carried out between 2008 and 2010. Five Japanese male subjects aged 22 to 24 years old participated in an experiment conducted during the winter of 2008, 10 different Japanese male subjects aged 21 to 24 years old partici-pated in experiments during the summer and winter of 2009, and 10 other Japanese male subjects aged 21 to 23 years old participated in the summer of 2010.
To estimate the subjects’maximum work capacity dur-ing an incremental load exercise on a cycle ergometer, the subjects were asked to pedal at a rate of 60 rpm, and the work rate was increased incrementally by 10 W/min until the subjects were exhausted or could no longer maintain the required cadence.
All subjects gave their informed consent to participate in the study and were fully aware that they could with-draw from the study at any time without prejudice. The
study protocol was approved by the institutional ethics review process.
Experimental protocol
The details of the experimental protocol were as de-scribed previously [11]. All the experiments were carried out between 11:00 and 15:00. The Tsk was calculated from the equation proposed by Ramanathan [12] and was maintained at 28°C by means of a water-perfused suit, described in Figure 1. Subjects wearing water-perfused suits commenced exercising at 50% of their maximum work rate on a cycle ergometer. The exercise was terminated at the onset of sweating, which occurred after 10 to 15 minutes of exercise. The subjects then remained seated on the cycle ergometer for an additional 100 minutes. The onset of shivering was observed when the oxygen uptake started to increase during the last part of the trial, while the Tsk remained at 28°C. The thresholds were defined as the rectal temperature (Tre) at which the sweating rate (Esk) and oxygen uptake were elevated above the median resting levels.
Measurements
The Tre and skin (arm, chest, thigh and calf ) tempera-tures were monitored with thermistors and the values were stored every 10 seconds using a data logger system (Cadac2 Model 9200A; Cadac, Tokyo, Japan). The Esk was measured at the forehead with a sweat rate monitor (Model SKD-4000; Skinos Co Ltd, Nagoya, Japan). Oxygen uptake was monitored with a gas analyzer (Respiromonitor RM-300i; Minato Medical Science Co Ltd, Tokyo, Japan).
The maintenance of Tsk while simultaneously extracting 120 W/m2of heat was achieved by having the subjects wear a water-perfused suit (Cool Tube Suit; Med-Eng Systems Inc, Ottawa, ON, Canada). The water perfusing the suit
was pumped at a rate of 600 cm3/min (Water Pump Model Super Tepcon; Terada, Tokyo, Japan), from a bath in which the water temperature was maintained at 25°C by a Cool Mate Model TE-105 M heat exchanger (Toyo Seisakusho, Tokyo, Japan). A diagram of the cooling system is shown in Figure 1.
In the climatic chamber, light was emitted from red or blue lamps (FLR40S-CR/M and GLR40S-CB/M, respect-ively; Panasonic Electric Industrial Co Ltd, Osaka, Japan) installed in the ceiling. The spectral distributions of the red and blue lamps were measured using a spectroradiometer (HSR-8100; Maki Manufacturing Co Ltd, Shizuoka, Japan). As shown in Figure 2, the peak emission wavelengths from the red and blue lamps were 612 nm and 436 nm, respectively. The light intensity was measured at the subject’s eye level with a luminance meter (LS-100; Konica Minoruta Co Ltd, Tokyo, Japan). The light intensity was maintained at 500 lx or 1000 lx.
Statistical analysis
All physiological and psychological variables measured are presented as means ± SD. The CIZs under two light conditions and in two seasons at the same light intensity were analyzed by a paired or unpairedt-test. The signifi-cance level was set atP<0.05.
Results
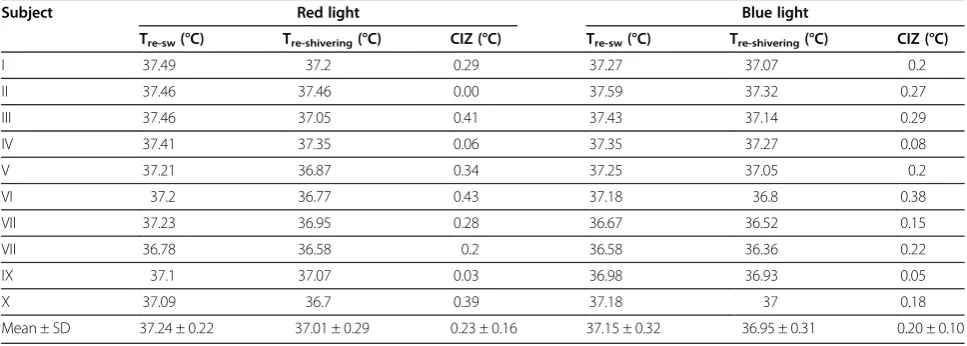
The CIZs at 500 lx are shown in Tables 1 and 2. The mean CIZs were 0.23 ± 0.16°C under red light and 0.20 ± 0.10°C under blue light in the summer, and 0.19 ± 0.20°C under red light and 0.26 ± 0.24°C under blue light in the winter. No significant differences between the red and blue lights, and no seasonal differences were observed at 500 lx.
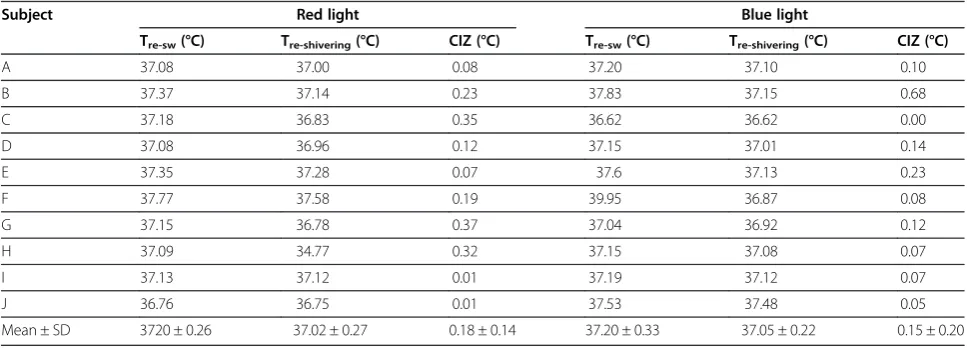
The CIZs at 1000 lx in the summer are shown in Table 3. The mean CIZs were 0.18 ± 0.14°C under red light and 0.15 ± 0.20°C under blue light. The CIZs at 1000 lx in the winter are shown in Table 4. The mean
Table 1 Core interthreshold zones at 500 lx under red and blue light conditions in the summer
Subject Red light Blue light
Tre-sw(°C) Tre-shivering(°C) CIZ (°C) Tre-sw(°C) Tre-shivering(°C) CIZ (°C)
I 37.49 37.2 0.29 37.27 37.07 0.2
II 37.46 37.46 0.00 37.59 37.32 0.27
III 37.46 37.05 0.41 37.43 37.14 0.29
IV 37.41 37.35 0.06 37.35 37.27 0.08
V 37.21 36.87 0.34 37.25 37.05 0.2
VI 37.2 36.77 0.43 37.18 36.8 0.38
VII 37.23 36.95 0.28 36.67 36.52 0.15
VII 36.78 36.58 0.2 36.58 36.36 0.22
IX 37.1 37.07 0.03 36.98 36.93 0.05
X 37.09 36.7 0.39 37.18 37 0.18
Mean ± SD 37.24 ± 0.22 37.01 ± 0.29 0.23 ± 0.16 37.15 ± 0.32 36.95 ± 0.31 0.20 ± 0.10
CIZ, core interthreshold zone; Tre-sw, sweating threshold; Tre-shivering, shivering threshold.
0 1 2 3 4 5 6 7 8 9
380 480 580 680 780
W
cm
-2
nm
-1
Wavelength (nm)
Red light lamp Blue light lamp 5000 K lamp
CIZs were 0.52 ± 0.18°C under red light and 0.71 ± 0.28°C under blue light. A significant difference (P <0.05) was observed in the CIZs between the red and blue lights at 1000 lx in the winter, and significant seasonal differences were also observed at 1000 lx under red light (P<0.05) and blue light (P<0.01).
Discussion
The results of the present study demonstrated the effects of colors of light on the CIZ during exposure to red or blue light, as well as a seasonal change in the CIZ. The difference in the CIZ under red versus blue light, a seasonal difference in the CIZ under red and blue light, and the CIZ under red and blue light versus 5000 K light, are discussed accordingly.
Difference in the CIZ under red versus blue light
The CIZs at 1000 lx were significantly (P <0.01) wider than those at 500 lx regardless of color of light. This may be due to the effect of light intensity observed
under 5000 K light [11]. Although no statistically signifi-cant difference in the CIZs was observed at 500 lx between red and blue light, the CIZ under blue light was significantly (P <0.05) wider than that under red light at 1000 lx in the winter, suggesting that blue light has a greater mitigating effect on autonomic functions than red light, particularly in the winter. This may be consist-ent with the results from the studies using red or blue fluorescent lamps, which demonstrated autonomic arousal under red light versus a mitigating effect under blue light [3,4,8,9].
According to the reciprocal cross-inhibition theory by Sherrington [13], the CIZ is a consequence of an elabor-ate balance of excitatory/inhibitory factors in the sensor-to-effector pathways of heat loss and heat production. If, during the initiation of sweating, exposure to blue light provides a stronger inhibitory effect on the heat loss sensor-to-effector pathway relative to the excitatory effect on the heat production sensor-to-effector pathway, particularly in the winter, Tre-sw under blue light would Table 2 Core interthreshold zones at 500 lx under red and blue light conditions in the winter
Subject Red light Blue light
Tre-sw(°C) Tre-shivering(°C) CIZ (°C) Tre-sw(°C) Tre-shivering(°C) CIZ (°C)
I 37.13 37.13 0.00 37.24 37.15 0.09
II 37.59 37.13 0.46 37.41 37.21 0.20
III 37.01 36.48 0.53 36.99 36.58 0.41
IV 37.42 37.37 0.05 36.95 36.84 0.11
V 36.88 36.85 0.03 37.01 36.62 0.39
VI 37.22 37.00 0.22 37.15 36.33 0.82
VII 37.15 36.8 0.35 37.28 36.99 0.29
VII 36.76 36.75 0.01 36.79 36.56 0.23
IX 36.91 36.79 0.12 37.09 37.09 0.00
X 37.24 37.01 0.23 37.19 37.16 0.03
Mean ± SD 37.13 ± 0.27 36.95 ± 0.26 0.19 ± 0.20 37.11 ± 0.18 36.85 ± 0.31 0.26 ± 0.24
CIZ, core interthreshold zone; Tre-sw, sweating threshold; Tre-shivering, shivering threshold.
Table 3 Core interthreshold zones at 1000 lx under red and blue light conditions in the summer
Subject Red light Blue light
Tre-sw(°C) Tre-shivering(°C) CIZ (°C) Tre-sw(°C) Tre-shivering(°C) CIZ (°C)
A 37.08 37.00 0.08 37.20 37.10 0.10
B 37.37 37.14 0.23 37.83 37.15 0.68
C 37.18 36.83 0.35 36.62 36.62 0.00
D 37.08 36.96 0.12 37.15 37.01 0.14
E 37.35 37.28 0.07 37.6 37.13 0.23
F 37.77 37.58 0.19 39.95 36.87 0.08
G 37.15 36.78 0.37 37.04 36.92 0.12
H 37.09 34.77 0.32 37.15 37.08 0.07
I 37.13 37.12 0.01 37.19 37.12 0.07
J 36.76 36.75 0.01 37.53 37.48 0.05
Mean ± SD 3720 ± 0.26 37.02 ± 0.27 0.18 ± 0.14 37.20 ± 0.33 37.05 ± 0.22 0.15 ± 0.20
be expected to be higher than that under red light. As shown in Table 4, the mean Tre-sw under blue light was 0.2°C higher than that under red light and this was statistically significant (P<0.05). This result may support the assumption that change in autonomic function in response to color of light may induce a difference in the CIZ between two colors of light at 1000 lx in the winter.
A seasonal difference in the CIZ under red and blue light
The CIZs under red and blue light in the winter were significantly wider than those in the summer, unlike the seasonal change in the CIZ during exposure to 5000 K light, as shown in Figure 3b. Since Brück et al. [14] demonstrated a difference between the CIZs of
cold-acclimated versus cold- and heat-cold-acclimated subjects, Kakitsuba et al. [6] reported that the wider CIZ during exposure to 5000 K light may be due to a mitigating effect on the autonomic function as a result of acclima-tion to both cool and heat in the summer. However, the seasonal change in CIZ under the two colors of light was apparently different, suggesting that some other physiological function may come into play.
The effect of light on human physiology is quite com-plicated and is not yet fully understood. It is difficult to definitively explain changes in the dynamic functions that affect the sensor-to-effector pathways which are widely assumed to be dependent on season. However, it is interesting to note that the secretion of melatonin is Table 4 Core interthreshold zones at 1000 lx under red and blue light conditions in the winter
Subject Red light Blue light
Tre-sw(°C) Tre-shivering(°C) CIZ (°C) Tre-sw(°C) Tre-shivering(°C) CIZ (°C)
a 37.20 36.66 0.54 37.54 36.89 0.65
b 37.42 36.68 0.74 37.74 36.82 0.92
c 37.05 36.80 0.25 37.48 36.98 0.50
d 37.38 36.88 0.50 37.58 36.62 0.96
e 37.47 36.91 0.56 37.35 36.83 0.52
Mean ± SD 37.30 ± 0.18 36.79 ± 0.11 0.52 ± 0.18 37.54 ± 0.14 36.83 ± 0.13 0.71 ± 0.28
CIZ, core interthreshold zone; Tre-sw, sweating threshold; Tre-shivering, shivering threshold.
(a)
(b)
0 0.1 0.2 0.3 0.4 0.5 0.6 0.7 0.85000 K Red Blue
CI
Z
(
oC)
Summer
Winter
0 0.1 0.2 0.3 0.4 0.5 0.6 0.7 0.8 0.9 1
5000 K Red Blue
CI
Z
(
oC)
Summer
Winter **
*p<0.05 **p<0.01 *
*
suppressed by an action spectrum [15], which is associated with both light intensity [16] and duration of exposure [17,18]. Thus, the sensor-to-effector pathways may be influenced by an action spectrum.
A seasonal difference under the two colors of light may be based on a variation in autonomic function with season for specific peak wavelengths. If the spectra at 436 nm and 612 nm, that is the peak wavelengths of red and blue light, activate the parasympathetic nervous sys-tem in the winter more strongly than in the summer, the CIZ would be expected to widen due to lower Tre-shivering. As shown in Tables 3 and 4 at 1000 lx, the mean Tre-shivering under red light was 36.79°C in the winter, about 0.2°C lower than 37.02°C in the summer. In addition, the mean Tre-shivering under blue light was 36.83°C in the winter, likewise about 0.2°C lower than 37.05°C in the summer. This result may support the as-sumption that seasonal changes in autonomic function, in response to a specific spectrum of light, induce complicated seasonal differences in the CIZ.
The CIZ under red and blue light versus 5000 K light
Prior to the present study, we carried out experiments under exposure to 5000 K light in the winter and sum-mer using the same subjects who participated in this study [6]. For comparison, the CIZs obtained in that study are shown together with those obtained in the present study in Figure 3a,b. In addition, the spectral distribution curve of the 5000 K lamp reveals that the wavelength of the peak emission is 543 nm with subsid-iary peaks at 436 nm and 612 nm, as shown in Figure 2.
Unlike seasonal changes in the CIZ under red and blue light, the CIZ during exposure to 5000 K light is wider in the summer and narrower in the winter, suggesting that the effect of light on autonomic functions is reflected in a difference in the action spectra, since 5000 K light exhibits 543 nm as a peak wavelength. Compared with effects of red and blue light, exposure to 5000 K light in the summer may provide a stronger inhibitory drive, relative to an excitatory drive, at the onset of both shivering and sweating.
According to our previous work [6], the mean Tre-sw at 5000 K in the summer was 37.38°C (n = 10), 0.18°C higher than the present results of 37.20°C under red light and 37.20°C under blue light. In addition, the mean Tre-shivering was 36.89°C (n = 10), 0.13°C lower than the present results of 37.02°C under red light and 0.15°C higher than the present results of 37.05°C under blue light. These results suggest that the effect of light on autonomic function is reflected in the primary peak emission at 543 nm in the summer.
Compared with exposure to red or blue light, exposure to 5000 K light in the winter may provide a stronger ex-citatory drive in the heat loss sensor-to-effector pathway,
relative to an inhibitory drive in the heat production sensor-to-effector pathway, at the onset of shivering. The mean Tre-shiveringat 5000 K in the winter, as shown in the previous work [6], was 37.0°C (n = 5), about 0.2°C higher than the present results of 36.79°C under red light and 36.83°C under blue light. These results may also support the hypothesis that the effect of light on autonomic function is reflected in a difference in action spectra in the winter.
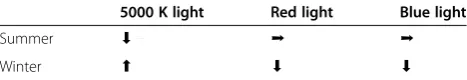
The manner of arousing and mitigating effects on autonomic functions against cold or heat stress is summarized in Table 5. Changes are described based on the CIZ at 500 lx. In particular, the effect of 5000 K light as opposed to colors of light can be clearly seen in Table 5.
Conclusions
The results of the present study demonstrate a sea-sonal change in the CIZ, as well as the effects of light intensity on the CIZ during exposure to red or blue light. It was also confirmed that a light intensity of 1000 lx is necessary to induce a significant difference in the CIZ. To understand changes in the CIZ under various light conditions, we propose that dynamic changes in the physiological effects of colors of light on autonomic functions via the non-visual pathway may be associated with the temperature regulation system.
Abbreviations
CIZ:Core interthreshold zone; Esk: Sweating rate; Tre: Rectal temperature;
Tre-shivering: Shivering threshold; Tre-sw: Sweating threshold;Tsk: Mean skin
temperature.
Competing interests
The authors declare that they have no competing interests.
Authors’contributions
NK wrote the manuscript, performed the experiments and analyzed the data. TK and IM were responsible for the coordination of the study, and overseeing data collection and analysis. All authors read and approved the final manuscript.
Acknowledgements
This study was supported in part by Grants-in-Aid for Scientific Research (#15107005 and #20370098) from the Japan Society for the Promotion of Science.
Table 5 The manner of arousing and mitigating effects on autonomic functions
5000 K light Red light Blue light
Summer ⬇ ➞ ➞
Winter ⬆ ⬇ ⬇
Author details
1
Department of Environment and Technology, School of Science and Technology, Meijo University, 468-8502 Shiogamaguchi 1-501, Tenpaku-ku, Nagoya, Aichi Prefecture, Japan.2Department of Automation, Biocybernetics and Robotics, Jozef Stefan Institute, Jamova 39, SI-1000, Ljubljana, Slovenia. 3
Graduate School of Engineering, Chiba University, 263-8522 Yayoi-cho 1-33, Inage-ku, Chiba Prefecture, Japan.
Received: 20 November 2012 Accepted: 13 March 2013 Published: 12 April 2013
References
1. Klein DC, Smoot R, Weller JL, Higa S, Markey SP, Greed GJ, Jacobowitz DM: Lesions of the paraventricular nucleus area of the hypothalamus disrupt the suprachiasmatic leads to spinal cord circuit in the melatonin rhythm generating system.Brain Res Bull1983,10(5):647–652.
2. Noguchi H, Sakaguchi T:Effect of illuminance and color temperature on lowering of physiological activity.Appl Human Sci1999,18(49):117–123. 3. Katsuura T, Yasuda T, Shimomura Y, Iwanaga K:Effects of monochromatic
light on time sense for short intervals.J Physiol Anthropol2007, 26(2):95–100.
4. Jacobs KW, Hustmyer FE Jr:Effects of dour psychological primary colors on GSR, heart rate and respiration rate.Percept Mot Skills1974, 38(3):763–766.
5. Kobayashi H, Sato M:Physiological responses to illuminance and color temperature of lighting.Ann Physiol Anthropol1992,11(1):45–49. 6. Kakitsuba N, Mekjavic IB, Katsuura T:The effect of season and light
intensity on the core interthreshold zone.J Physiol Anthropol2011, 30(4):161–167.
7. Takahashi Y, Katsuura T, Shimomura Y, Iwanaga K:Prediction model of light-induced melatonin suppression.J Light Vis Env2011,35(2):29–41. 8. Ali MR:Pattern of EEG recovery under photic stimulation by light of
different colors.Electroencephalogr Clin Neurophysiol1972,33(3):332–335. 9. Schäfer A, Kratky KW:The effect of colored illumination on heart rate
variability.Forsch Komplementmed2006,13(3):167–173.
10. Lee H, Katsuura T, Iwanaga K, Shimomura Y, Higashi H, Ichijo T:The effect of monochromatic light exposure on human physiological responses.
Japanese J Physiol Anthropol2008,13(2):75–78.
11. Kakitsuba N, Mekjavic IB, Katsuura T:The effect of season and light intensity on the core interthreshold.J Physiol Anthropol2009, 30(4):161–167.
12. Ramanathan NL:A new weighting system for mean surface temperature of the human body.J Appl Physiol1976,41:256–258.
13. Sherrington C:The integrative action of the nervous system.New Haven: Yale University Press; 1906.
14. Brück K, Wünnenberg W, Gallmeier H, Ziehm B:Shift of threshold temperature for shivering and heat polypnea as a mode of thermal adaptation.Pflugers Arch1971,321:159–172.
15. Brainard GC, Hanifin JP, Greeson JM, Byrne B, Glickman G, Gerner E, Rollag MD:Action spectrum for melatonin regulation in humans: evidence for a novel circadian photoreceptor.J Neurosci2001,21(16):6405–6412. 16. Thapan K, Arendt J, Skene DJ:An action spectrum for melatonin
suppression: evidence for a novel non-rod, non-cone photoreceptor system in humans.J Physiol2001,535(1):261–267.
17. McIntyre IM, Norman TR, Burrows GD, Armstrong SM:Quantal melatonin suppression by exposure to low intensity light in man.Life Sci1989, 45(4):327–332.
18. Aoki H, Yamada N, Ozeki Y, Yamane H, Kato N:Minimum light intensity required to suppress nocturnal melatonin concentration in human saliva.Neurosci Lett1998,252(2):91–94.
doi:10.1186/1880-6805-32-6
Cite this article as:Kakitsubaet al.:The core interthreshold zone during exposure to red and blue light.Journal of Physiological Anthropology2013
32:6.
Submit your next manuscript to BioMed Central and take full advantage of:
• Convenient online submission
• Thorough peer review
• No space constraints or color figure charges
• Immediate publication on acceptance
• Inclusion in PubMed, CAS, Scopus and Google Scholar
• Research which is freely available for redistribution