Open Access
Research article
The removal of multiplicative, systematic bias allows integration of
breast cancer gene expression datasets – improving meta-analysis
and prediction of prognosis
Andrew H Sims*
1,2, Graeme J Smethurst
3, Yvonne Hey
4,
Michal J Okoniewski
3,5, Stuart D Pepper
4, Anthony Howell
2, Crispin J Miller
3and Robert B Clarke
2Address: 1Applied Bioinformatics of Cancer Research Group, Breakthrough Research Unit, Edinburgh Cancer Research Centre, Western General Hospital, Crewe Road South, Edinburgh, EH4 2XR, UK, 2Breast Biology Group, School of Cancer and Imaging Sciences, University of Manchester, UK, 3Cancer Research UK Applied Computational Biology and Bioinformatics Group, 4Cancer Research UK Affymetrix Service, Paterson Institute for Cancer Research, Wilmslow Road, Manchester M20 4BX, UK and 5Functional Genomics Center, UNI ETH Zurich, Winterthurerstrasse 190, CH-8057 Zurich, Switzerland
Email: Andrew H Sims* - [email protected]; Graeme J Smethurst - [email protected]; Yvonne Hey - [email protected]; Michal J Okoniewski - [email protected]; Stuart D Pepper - [email protected];
Anthony Howell - [email protected]; Crispin J Miller - [email protected]; Robert B Clarke - [email protected] * Corresponding author
Abstract
Background: The number of gene expression studies in the public domain is rapidly increasing, representing a highly valuable resource. However, dataset-specific bias precludes meta-analysis at the raw transcript level, even when the RNA is from comparable sources and has been processed on the same microarray platform using similar protocols. Here, we demonstrate, using Affymetrix data, that much of this bias can be removed, allowing multiple datasets to be legitimately combined for meaningful meta-analyses.
Results: A series of validation datasets comparing breast cancer and normal breast cell lines (MCF7 and MCF10A) were generated to examine the variability between datasets generated using different amounts of starting RNA, alternative protocols, different generations of Affymetrix GeneChip or scanning hardware. We demonstrate that systematic, multiplicative biases are introduced at the RNA, hybridization and image-capture stages of a microarray experiment. Simple batch mean-centering was found to significantly reduce the level of inter-experimental variation, allowing raw transcript levels to be compared across datasets with confidence. By accounting for dataset-specific bias, we were able to assemble the largest gene expression dataset of primary breast tumours to-date (1107), from six previously published studies. Using this meta-dataset, we demonstrate that combining greater numbers of datasets or tumours leads to a greater overlap in differentially expressed genes and more accurate prognostic predictions. However, this is highly dependent upon the composition of the datasets and patient characteristics.
Conclusion: Multiplicative, systematic biases are introduced at many stages of microarray experiments. When these are reconciled, raw data can be directly integrated from different gene expression datasets leading to new biological findings with increased statistical power.
Published: 21 September 2008
BMC Medical Genomics 2008, 1:42 doi:10.1186/1755-8794-1-42
Received: 14 May 2008 Accepted: 21 September 2008
This article is available from: http://www.biomedcentral.com/1755-8794/1/42
© 2008 Sims et al; licensee BioMed Central Ltd.
Background
Successful microarray experiments are reliant on sufficient care being taken to minimize and account for experimen-tal variability. Formalization and control of all stages of the experimental pipeline is now routine, and the need to associate experiments with detailed descriptions of proto-cols and techniques is now widely accepted [1]. However, despite these efforts, it is still not possible to account for all potential sources of variation, and even identical exper-iments performed at different sites have been shown to produce significantly different results [2]. This makes it difficult to routinely compare gene expression data gener-ated from different experiments, even when using samples from comparable sources that have been processed on the same microarray platform using similar protocols.
Issues of experimental reproducibility have become increasingly important with the advent of microarray databases and repositories (e.g. ArrayExpress [1], GEO [3]), given the potential they offer for cross-experimental comparison and data mining. Even if it is possible to suc-cessfully control inter-experiment variation to a point where this might be possible, rapid developments in both the hybridization protocols and in the arrays themselves have also led to major improvements in the technology. Lower requirements for the amount of starting RNA have enabled gene expression profiling to be combined with cell sorting methods or laser capture microdissection, while increases in the number of features represented on the arrays have resulted in progressively more detailed coverage of the transcriptome. Since each advance in tech-nology leads to genuine improvements, there is a strong incentive to use the latest arrays and protocols whenever possible. This is however, tempered by a lack of backward compatibility between datasets produced using different array and protocol versions, and any decision to move to a newer (better) iteration of the technology must be made with an appreciation of the difficulty in maintaining com-patibility with previous studies.
In this study we first demonstrate, using an extended series of validation data, that Affymetrix datasets cannot in general be compared at the raw expression level due to systematic, multiplicative biases. Secondly, we show that simple batch mean-centering can significantly reduce the level of inter-experimental variation and that this allows raw transcript levels to be compared across datasets. The approach is then applied to a series of published breast cancer studies and we show that the integrated datasets possess increased statistical power and improved prog-nostic ability, compared to the individual datasets alone.
Results
Systematic bias in microarray data
All validation datasets (consisting of six GeneChips each) were produced by hybridizing triplicate RNA
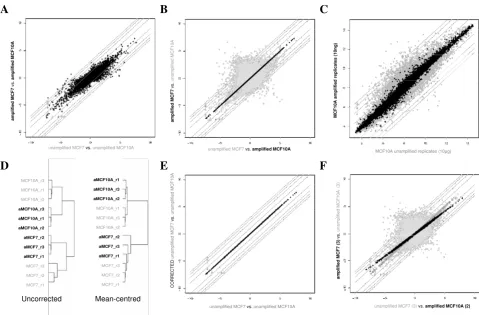
sam-ples from a breast cancer cell line (MCF7) and an immor-talised normal breast cell line (MCF10A) using a variety of different array types and sample preparation proto-cols. In all cases, the aim of the validation study was to assess the correspondence between the sets of differen-tially expressed probesets (or transcripts) identified when using different versions of the same underlying technology. In the hypothetical situation when all data-sets yield identical results, the same set of differentially expressed probesets would be identified, irrespective of the array type or protocol used to process the data; we considered how close the data approaches this ideal. For example, a comparison of the fold changes between data-sets (amplified/MCF10A-amplified vs. MCF7-unamplified/MCF10A-unamplified) generated using Affymetrix's small sample protocol and Affymetrix's standard protocol yields good, but not perfect corre-spondence (Fig 1A, Table 1). However, when fold changes are calculated across datasets (MCF7-amplified/ MCF10A-unamplified vs. MCF7-unamplified/MCF10A-amplified) correspondence falls dramatically (Fig. 1B grey dots, Table 1).
Batch mean-centering (see methods) of the amplified and unamplified datasets was found to dramatically increase the correspondence comparison across the datasets, with 100% of probesets having fold changes within two-fold between experimental branches (Fig. 1B black dots, Table 1). Similarly, when significance analysis of microarrays (SAM) was used to identify lists of probesets with statisti-cally significant changes between the same replicate groupings used to generate Fig. 1, the intersection between sets was also found to be greater following mean batch correction (Table 1) and Pearson correlation of raw intensities was also found to increase (Figs. 1C, 1D and Additional File 1). It is notable that while correction improves fold-change correspondence across protocols, fold changes between datasets are preserved (Fig. 1E, Table 1).
Integration of published breast tumour datasets
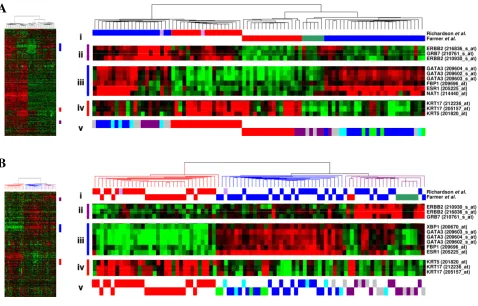
Breast tumours have been classified into five molecular subtypes; basal, luminal A, luminal B, ERBB2 and normal-like by identifying a set of genes with significantly greater variation in expression between different tumours than between paired samples from the same tumour [6-8]. Since members of this set appear to define properties 'intrinsic' to each subtype, the authors referred to the genes as an 'intrinsic gene set'. 640 Affymetrix probesets representing the 534 'intrinsic gene set' from [13] were identified using NetAffx [9]. These probesets were used to cluster MAS5 normalised expression data from two pub-lished Affymetrix gene expression studies [10,11] with similar numbers and composition of tumours. Despite using similar starting material (primary tumours) and the same microarray platform, when combined the two data-sets formed two distinct, independent clusters represent-ing the two datasets (Fig. 2A), suggestrepresent-ing a dataset-specific systematic bias as observed with the validation datasets described above. Although clusters of known luminal and basal-specific genes show similar patterns of differential expression in each of the two datasets (Figure 2A iii, iv), the majority of the probesets representing the full
'intrin-sic gene set' show greater differences in expression between the two studies than between the different classes of tumours. Following mean-centering as before, the 'basal-like tumours' from the Richardson et al. [10] dataset were found to cluster alongside the 'basal tumours' from Farmer et al. [11], and the 'non-basal tumours' with the 'luminal tumours' (Fig. 2B). A third cluster of tumours was identified with high expression of the ERBB2 cluster of probesets. This cluster contained all of the molecular apocrine tumours, plus a mixture of basal/basal-like and luminal/non-basal-like tumours. Using centroid predic-tion [12] as described previously, the tumours from both datasets were assigned to the five Norway/Stanford sub-types (basal, luminal A, luminal B, ERBB2 and normal-like [6-8]), one of the tumours in this third cluster was assigned to the luminal B subtype, thirteen to the ERBB2 subtype and 9 could not clearly be assigned to a subtype (Fig 2B v).
The greatest single difference between molecular subtypes has repeatedly been demonstrated to be between estrogen receptor-positive (ER+) luminal tumours and ER-negative basal tumours [6-8,13,14]. SAM analysis was used to
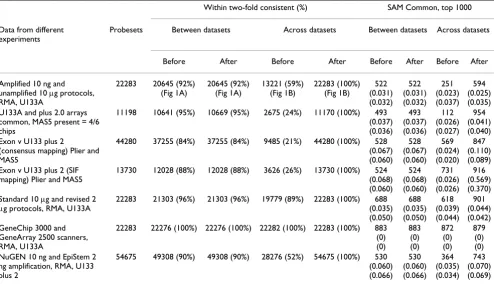
iden-Table 1: Summary of the effect of mean batch-centering on data generated from different experiments.
Within two-fold consistent (%) SAM Common, top 1000
Data from different experiments
Probesets Between datasets Across datasets Between datasets Across datasets
Before After Before After Before After Before After
Amplified 10 ng and unamplified 10 μg protocols, RMA, U133A
22283 20645 (92%) (Fig 1A)
20645 (92%) (Fig 1A)
13221 (59%) (Fig 1B)
22283 (100%) (Fig 1B)
522 (0.031) (0.032)
522 (0.031) (0.032)
251 (0.023) (0.037)
594 (0.025) (0.035) U133A and plus 2.0 arrays
common, MAS5 present = 4/6 chips
11198 10641 (95%) 10669 (95%) 2675 (24%) 11170 (100%) 493 (0.037) (0.036)
493 (0.037) (0.036)
112 (0.026) (0.027)
954 (0.041) (0.040) Exon v U133 plus 2
(consensus mapping) Plier and MAS5
44280 37255 (84%) 37255 (84%) 9485 (21%) 44280 (100%) 528 (0.067) (0.060)
528 (0.067) (0.060)
569 (0.024) (0.020)
847 (0.110) (0.089) Exon v U133 plus 2 (SIF
mapping) Plier and MAS5
13730 12028 (88%) 12028 (88%) 3626 (26%) 13730 (100%) 524 (0.068) (0.060)
524 (0.068) (0.060)
731 (0.026) (0.026)
916 (0.569) (0.370) Standard 10 μg and revised 2
μg protocols, RMA, U133A
22283 21303 (96%) 21303 (96%) 19779 (89%) 22283 (100%) 688 (0.035) (0.050)
688 (0.035) (0.050)
618 (0.039) (0.044)
901 (0.044) (0.042) GeneChip 3000 and
GeneArray 2500 scanners, RMA, U133A
22283 22276 (100%) 22276 (100%) 22282 (100%) 22283 (100%) 883 (0) (0)
883 (0) (0)
872 (0) (0)
879 (0) (0) NuGEN 10 ng and EpiStem 2
ng amplification, RMA, U133 plus 2
54675 49308 (90%) 49308 (90%) 28276 (52%) 54675 (100%) 530 (0.060) (0.066)
530 (0.060) (0.066)
364 (0.035) (0.034)
743 (0.070) (0.069)
tify probesets differentially expressed between the basal/ basal-like and non basal-like/luminal subtypes using the combined data from both sets of samples. It was only fol-lowing mean-centering that probesets were identified that represent genes that are known to characterize the differ-ences between these subtypes (Additional File 3), includ-ing the fundamental estrogen receptor alpha and GATA binding protein 3, which maintains differentiation into the luminal cell fate in the mammary gland [15]. In addi-tion, following mean-centering, a greater number of sta-tistically significant probesets were found to be differentially expressed between the tumour subtypes than were found between the two initial sets of samples (Additional File 4).
These results encouraged us to apply the approach to inte-grate six previously published datasets [16-21] (Table 2)
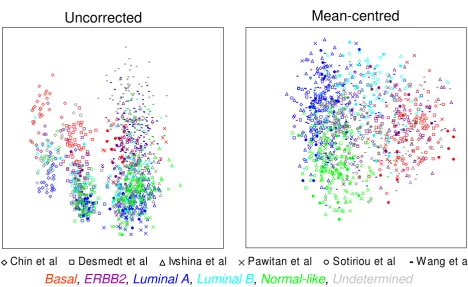
of primary breast cancer tumours processed on Affymetrix U133A, U133AA or plus 2.0 GeneChips. Multidimen-sional scaling of 1107 tumours based upon the expression of all common probesets between the three arrays (22,215) demonstrated that global gene expression is highly influenced by dataset, with tumours clustering by study (Fig. 3A), again suggesting a systematic, dataset-spe-cific bias. However, following mean-centering, the tumours appear to cluster by breast cancer subtype (assigned using centroid prediction [12]), regardless of the dataset from which they were generated (Fig. 3B).
A growing body of evidence has accumulated, supporting the notion that gene expression profiling of primary breast tumours can be used to stratify patients by subtype and the likelihood of disease progression (reviewed in [22]). The approaches have included both unsupervised
Comparison of Affymetrix gene expression data generated using amplified and unamplified protocols
Figure 1
Comparison of Affymetrix gene expression data generated using amplified and unamplified protocols. A, Com-paring fold changes between unamplified and amplified datasets demonstrates reasonable correlation. B, Comparing fold changes across datasets (unamplified MCF7 with amplified MCF10A and vice versa) is clearly impractical (grey spots), however following mean batch-centering there is excellent correlation across the datasets (black spots). C, Comparison of mean raw expression levels for amplified and unamplified MCF10A replicates before (grey) and after mean batch-centering (black). D, Pearson clustering of the GeneChips representing the same cell lines is tighter following mean-centering. E, Mean-centering has no effect on fold changes between datasets. F, Mean-centering of unbalanced datasets (duplicate rather than triplicate amplified MCF10A) results in a distortion of the comparison (black spots), however this is rectified with weighted mean-centering (open dark grey spots), both methods show a dramatic improvement over uncorrected data (light grey spots).
A
B
C
D
E
F
MCF10A unamplified replicates (10g)
unamplified MCF7vs. unamplified MCF10A
CO RRE CT E D un am pl ifi ed M C F 7 vs . un a m pl ifi ed M C F 10A MCF10A_r3 MCF10A_r1 MCF10A_r2 aMCF10A_r3 aMCF10A_r1 aMCF10A_r2 aMCF7_r2 aMCF7_r3 aMCF7_r1 MCF7_r3 MCF7_r2 MCF7_r1 aMCF10A_r1 aMCF10A_r3 aMCF10A_r2 MCF10A_r1 MCF10A_r3 MCF10A_r2 aMCF7_r2 aMCF7_r3 aMCF7_r1 MCF7_r3 MCF7_r2 MCF7_r1 Uncorrected Mean-centred M C F 10A amp li fi e d rep li c a tes (10n g ) a m plif ie d MC F7 vs . unam pl ifi ed M C F 10A
unamplified MCF7 vs.amplified MCF10A
a m p lif ie d M C F 7 vs . a m p lif ie d MC F1 0 A
unamplified MCF7 vs.unamplified MCF10A
a m p lif ie d MC F7 ( 3 ) vs . un am pl ifi ed M C F 10A ( 3 )
(intrinsic gene set [6-8]) and supervised (genes associated with patient follow up [17,21,23]) methods, along with studies of cancer-associated pathways or tumor character-istics [24-27], in all cases these signatures appear to pre-dict recurrence, despite the lack of overlap in their respective profiles or signatures [28]. In order to establish whether integrating multiple datasets can improve prog-nostic prediction, the six published datasets (described above) were used individually or in combination as 'train-ing sets' for supervised principal components analysis [29,30]. This method has been shown to produce more accurate predictions than several competing methods on both simulated and real microarray datasets [29,30]. Using the Superpc [30] package for R [31], a Cox propor-tional hazards model was fitted to each predictor (gener-ated for all combinations of one to five datasets used as the 'training set') and cross validation curves were plotted
to determine the optimum threshold for the predictor of survival as described previously [30]. The 1st supervised
principal component was found to be the most significant in the vast majority of cases, which is consistent with the hypothesis that recurrence is an inherent property of pri-mary tumour gene expression (examples of cross-valida-tion and survival curves are shown in Addicross-valida-tional File 5). The remaining dataset(s) were used as a test set for each predictor and an R2 statistic was computed to assess the
performance. Combining greater numbers of datasets or tumours significantly improves prediction of prognosis based upon gene expression data (Fig. 4). Mean-centering of the datasets significantly increased the correlation between the supervised principal components and clinical follow up, therefore improving prognostic performance. It is clear that the predictive power of some combinations of training and test sets is more reliable than others.
Comparison of breast tumour gene expression profiles generated by two published studies
Figure 2
Comparison of breast tumour gene expression profiles generated by two published studies. The Farmer et al.
study used U133A GeneChips with RNA amplification, whereas the Richardson et al. study used U133 plus 2.0 arrays and the standard labeling protocol. A, Before mean batch-centering. B, After mean batch-centering. Hierarchical clustering of tumours based upon 640 probesets representing Sorlie et al. [8] 'intrinsic' genes. Thumbnails show all 640 probesets. i) Tumours classi-fied by Richardson et al. [10] red = basal-like, blue = non-basal like, pink = BRCA1; tumours classified by Farmer et al. [11] red = basal, blue = luminal, green = apocrine. Clusters of genes associated with the 'Sorlie subtypes' are highlighted as follows; ii) ERBB2 gene cluster, iii) luminal A gene cluster, iv) basal gene cluster. v) Centroid prediction was used to assign the tumours to the five Norway/Stanford subtypes – basal (red), luminal A (dark blue), luminal B (light blue), ERBB2 (purple) and normal-like (green), unassigned (grey).
A
B
Richardson et al.
Farmer et al.
ERBB2 (210930_s_at) ERBB2 (216836_s_at) GRB7 (210761_s_at) XBP1 (200670_at) GATA3 (209603_s_at) GATA3 (209604_s_at) GATA3 (209602_s_at) FBP1 (209696_at) ESR1 (205225_at) KRT5 (201820_at) KRT17 (212236_at) KRT17 (205157_at) Richardson et al.
Farmer et al.
ERBB2 (216836_s_at) GRB7 (210761_s_at) ERBB2 (210930_s_at) GATA3 (209604_s_at) GATA3 (209602_s_at) GATA3 (209603_s_at) FBP1 (209696_at) ESR1 (205225_at) NAT1 (214440_at) KRT17 (212236_at) KRT17 (205157_at) KRT5 (201820_at)
i
ii
iii
iv
v
i ii
iii
iv
v
Richardson et al.
Farmer et al.
ERBB2 (210930_s_at) ERBB2 (216836_s_at) GRB7 (210761_s_at) XBP1 (200670_at) GATA3 (209603_s_at) GATA3 (209604_s_at) GATA3 (209602_s_at) FBP1 (209696_at) ESR1 (205225_at) KRT5 (201820_at) KRT17 (212236_at) KRT17 (205157_at) Richardson et al.
Farmer et al.
ERBB2 (216836_s_at) GRB7 (210761_s_at) ERBB2 (210930_s_at) GATA3 (209604_s_at) GATA3 (209602_s_at) GATA3 (209603_s_at) FBP1 (209696_at) ESR1 (205225_at) NAT1 (214440_at) KRT17 (212236_at) KRT17 (205157_at) KRT5 (201820_at)
i
ii
iii
iv
v
i ii
iii
iv
Table 2: Published breast cancer datasets used in this study.
Datasets No. Tumours Array express/
GEO ID
GeneChip ER+ Age Tumour Size
(cm)
FU (years) Reference
Chin et al. 2006 114 E-TABM U133AA 67% 51 2.3 6.1 [16] Desmedt et al.
2007
198 GSE7390 U133A 68% 47 2.0 13.6 [17]
Farmer et al 2005 49 GSE1561 U133A 58% - - - [11] Ivshina et al. 2006 249 GSE4922 U133A 85% 63 2.0 9.9 [18] Loi et al. 2007 119, 87 GSE6532 U133A, U133
plus2.0
100% 65, 62 2.4, 2.1 5.2, 11.4 [32]
Minn et al. 2007 58 GSE5327 U133A 0% - - 7.2 [33] Pawitan et al. 2005 159 GSE1456 U133A 83% 58$ 2.2$ 7.1 [19]
Richardson et al. 40 GSE3744 U133 plus2.0 38% - - - [10] Sotiriou et al. 2006 101* GSE2990 U133A 71% 60 2.0 5.8 [20] Wang et al. 2005 286 GSE2034 U133A 73% 52 - 7.2 [52]
Continuous variables (age, size and follow up) are given as median values, except where indicated $ the mean was given. The follow up (FU)
endpoints for the datasets Loi et al, Pawitan et al. and Sotoriou et al were recurrence-free survival, for datasets Desmedt et al. and Ivshina et al. it was disease-free survival and for datasets Minn et al. and Wang et al. it was distant metastasis-free survival. *The full dataset of Sotiriou et al. includes 189 tumours, but 88 of the Uppsala tumours are included in dataset Ivshina et al.
Dataset-specific bias in published Affymetrix breast cancer studies
Figure 3
Dataset-specific bias in published Affymetrix breast cancer studies. Multidimensional scaling for all common probesets (22,215) for 1107 breast tumours from six published studies [16-21] on U133A, U133AA and U133 plus 2.0 Gene-Chips. Tumours from different datasets are distinguished by symbol. Tumours assigned to one of the five Sorlie et al. subtypes by centroid prediction are discriminated by colours. With uncorrected data the tumours cluster by study, following mean-centering the tumours cluster by molecular subtype.
Chin et al
Desmedt et al
Ivshina et al
Pawitan et al
Sotiriou et al
W ang et al
Uncorrected
Mean-centred
Although only a limited number of patient and tumour characteristics were available (Table 2), it seems that the most accurate predictions are achieved for test datasets that have characteristics most similar to those of the indi-vidual or combined training dataset. R2 statistic and
p-val-ues (log rank) for all possible combinations of training datasets and test datasets are given in Additional File 6.
Dataset composition
We investigated the effect of altering the composition of luminal (ER+) and basal (ER-) tumours from the two
published datasets of Farmer et al. [11] and Richardson
et al. [10] compared above. Unbalancing the composi-tion of the datasets from a 1:1 ratio of basal to luminal tumours to a 2:1 or 5:1 ratio of tumours reduced corre-spondence between datasets and caused a distortion
across datasets (Additional File 7). Similar results were also observed with the MCF7/MCF10A datasets described above (Fig 1F, Table 3). Weighted-mean-centering for ER status removed the distortion but also reduced correspondence for the 2:1 ratio of luminal tumours, and increased correspondence in the 5:1 ratio
Combining datasets or tumours and mean-centering significantly increases prognostic prediction
Figure 4
Combining datasets or tumours and mean-centering significantly increases prognostic prediction. A, Before mean batch-centering. B, After mean batch-centering. The R2 statistic (Cox proportional hazards model) is an assessment of
the performance of the predictor generated using each combination of training datasets and the remaining test datasets, gener-ated using supervised principal components analysis. Median values are used where a training dataset was used to assess more than one test dataset (up to 5). R2 and p-value results for all possible combinations of training datasets and test datasets (1016)
are given in the matrix in Additional File 6.
0 0.02 0.04 0.06 0.08 0.1 0.12
0 200 400 600 800 1000 1200 Number of tumours
p=0.02
0 0.02 0.04 0.06 0.08 0.1 0.12
0 1 2 3 4 5 6
Number of datasets
p=0.002
R
2Stat
is
tic
(
C
ox
p
ropor
tional haz
a
rds
m
odel
)
A
B
R
2 Stat
is
tic
(
C
ox
p
ropor
tional haz
a
rds
m
odel
)
0 0.02 0.04 0.06 0.08 0.1 0.12
0 200 400 600 800 1000 1200 Number of tumours
p=0.002
0 0.02 0.04 0.06 0.08 0.1 0.12
0 1 2 3 4 5 6
Number of datasets
p=0.0006
R
2 Stat
is
tic
(
C
ox
p
ropor
tional haz
a
rds
m
odel
)
R
2 S
tat
is
tic
(
C
ox
p
ropor
tional
h
a
za
rd
s
m
odel
)
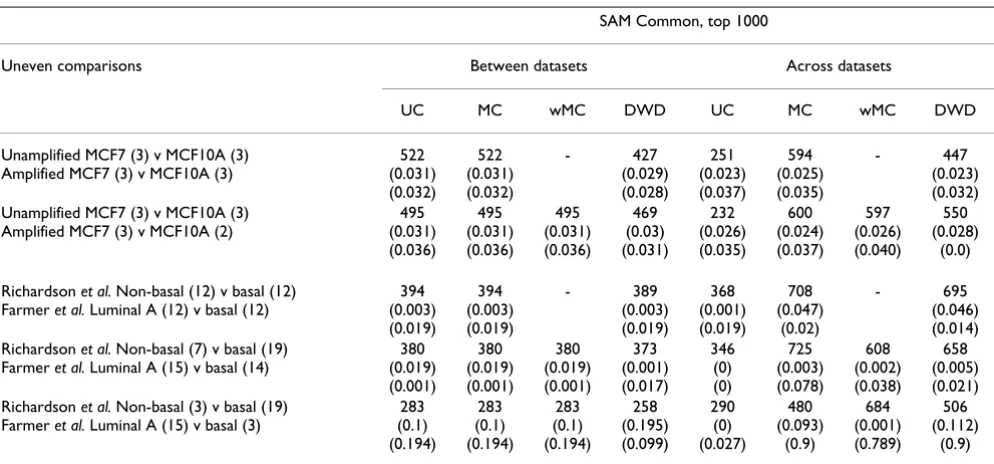
luminal to basal comparison, at the expense of high false discovery rates (Table 3). An extreme example of the effect of dataset composition was seen when looking at the expression level of the estrogen receptor in homoge-neous datasets from Loi et al. [32] and Minn et al. [33] composed wholly of ER+ or ER- tumours. Following mean-centering it appears that these datasets contain a mixture of ER+ and ER- tumours (Additional File 8A). Replacing any of the six heterogenous datasets above (containing 67–85% ER+ tumours) with homogeneous datasets (containing only ER+ or ER- tumours) showed a dramatic reduction in the correlation between dataset or tumour number and prediction of recurrence (Addi-tional File 8B). Using weighted mean-centering to account for the differences in the composition of ER+ tumours in five out of the six datasets (individual ER sta-tus by immunohistochemistry for tumours in the Paw-itan et al. dataset was not available) did not significantly improve prognostic performance over mean-centering alone (Additional File 9).
The mean-centering approach was compared with a previ-ously described method for integrating breast cancer tumour microarray data generated on different platforms, using a distance weighted discrimination (DWD) method to adjust for systematic microarray data biases [34]. For both the validation datasets and the published datasets,
mean-centering out-performed DWD (Table 3 and Addi-tional File 10).
Most variable genes
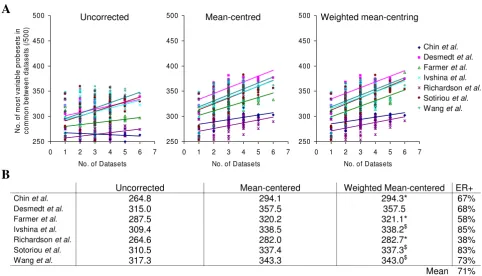
An alternative approach to assess whether mean-centering improves comparisons across published datasets was to identify lists of the five hundred most highly differentially expressed probesets across each dataset (those with the highest variance) and compare these gene lists with the most differentially expressed probesets from other single or combined datasets. Bringing together greater numbers of datasets or tumours increased the overlap in differen-tially expressed probesets (Figure 5). The number of probesets in common was significantly greater with mean-centering (p = 3.6 × 10-107) or weighted mean-centering (p
= 9.2 × 10-106) over uncorrected data, although there was
no significant improvement between the two methods (p = 0.5). The mean number of genes in common was higher following weighted mean-centering than mean-centering when the dataset was made up of less ER-positive tumours (Chin et al., Farmer et al. and Richardson et al.) and lower when the dataset was made up of more ER-positive tumours (Ivshina et al., Sotoriou et al., Wang et al.).
Discussion
Mean-centering has been widely used in the past to com-pare relative gene expression of high and lowly expressed
Table 3: Effect of dataset composition on differential gene expression.
SAM Common, top 1000
Uneven comparisons Between datasets Across datasets
UC MC wMC DWD UC MC wMC DWD
Unamplified MCF7 (3) v MCF10A (3) Amplified MCF7 (3) v MCF10A (3)
522 (0.031) (0.032) 522 (0.031) (0.032) - 427 (0.029) (0.028) 251 (0.023) (0.037) 594 (0.025) (0.035) - 447 (0.023) (0.032) Unamplified MCF7 (3) v MCF10A (3)
Amplified MCF7 (3) v MCF10A (2)
495 (0.031) (0.036) 495 (0.031) (0.036) 495 (0.031) (0.036) 469 (0.03) (0.031) 232 (0.026) (0.035) 600 (0.024) (0.037) 597 (0.026) (0.040) 550 (0.028) (0.0)
Richardson et al. Non-basal (12) v basal (12) Farmer et al. Luminal A (12) v basal (12)
394 (0.003) (0.019) 394 (0.003) (0.019) - 389 (0.003) (0.019) 368 (0.001) (0.019) 708 (0.047) (0.02) - 695 (0.046) (0.014) Richardson et al. Non-basal (7) v basal (19)
Farmer et al. Luminal A (15) v basal (14)
380 (0.019) (0.001) 380 (0.019) (0.001) 380 (0.019) (0.001) 373 (0.001) (0.017) 346 (0) (0) 725 (0.003) (0.078) 608 (0.002) (0.038) 658 (0.005) (0.021) Richardson et al. Non-basal (3) v basal (19)
Farmer et al. Luminal A (15) v basal (3)
283 (0.1) (0.194) 283 (0.1) (0.194) 283 (0.1) (0.194) 258 (0.195) (0.099) 290 (0) (0.027) 480 (0.093) (0.9) 684 (0.001) (0.789) 506 (0.112) (0.9)
genes together within a single dataset, particularly for heatmaps and clustering programs [35]. However, this is the first study to assess the utility of mean-centering for minimising the effects of dataset-specific bias and integra-tion of multiple datasets. An unknown, systematic, multi-plicative bias associated with each group of arrays processed together ('dataset') is simply removed when the GeneChips are considered relative to each other. The approach clearly shows significant improvements in the degree of correspondence found across datasets, without any loss of internal coherence within each of the initial datasets from which the integrated dataset is assembled. Relative intensities within each individual dataset are left unchanged (Figure 1D), with the consequence that both fold-changes and p-values produced by techniques such as SAM, remain identical to those found prior to correc-tion (Table 1). Therefore, balanced corrected datasets can be treated with at least as much confidence as the initial uncorrected data. We have also demonstrated that com-bining greater numbers of datasets or tumours increases the overlap in differentially expressed probesets between studies and that this is further improved with mean-centering.
A number of previous studies have also investigated the level of consensus found between different experimental datasets. The mean-centering approach out-performed a distance weighted discrimination method [34] that attempted to adjust for systematic microarray data biases for integrating breast cancer tumour microarray data gen-erated on different platforms. This group stated that they had also applied this technique to 'merge two distinct Affymetrix breast tumor datasets together' and 'saw simi-lar, but less dramatic results due to fewer systematic biases present in datasets performed on the same Affymetrix microarrays' [34]. Our results suggest that there are many sources of systematic biases in Affymetrix data, which are highly significant and multiplicative, but that these can be largely corrected for, allowing the integration of datasets. An empirical Bayes method to adjust for batch effects [36] (ComBat; http://statistics.byu.edu/johnson/ComBat/) has also been used to integrate published datasets for meta-analysis [37]. This approach generated plots analo-gous to those in Additional File 8 for mean-centering and weighted mean-centering when ER status was used as a covariate (data not shown). The mean-centering method described in this study was used in a recent meta-analysis
Combining greater numbers of datasets leads to a greater overlap in differentially expressed probesets
Figure 5
Combining greater numbers of datasets leads to a greater overlap in differentially expressed probesets. Lists of the five hundred probesets with the highest variance were generated for each dataset and combinations of up to six datasets and the number of probesets in common between these lists were plotted for each dataset. A, Plots show the number of com-mon probesets between each individual dataset and other single or combined datasets. B, Overall mean numbers of genes in common for each dataset.
Uncorrected Mean-centered Weighted Mean-centered ER+
Chin et al. 264.8 294.1 294.3* 67%
Desmedt et al. 315.0 357.5 357.5 68%
Farmer et al. 287.5 320.2 321.1* 58%
Ivshina et al. 309.4 338.5 338.2$ 85%
Richardson et al. 264.6 282.0 282.7* 38%
Sotoriou et al. 310.5 337.4 337.3$ 83%
Wang et al. 317.3 343.3 343.0$ 73%
Mean 71%
250 300 350 400 450 500
0 1 2 3 4 5 6 7
No. of Datasets
C D F I R S W
250 300 350 400 450 500
0 1 2 3 4 5 6 7
No. of Datasets
No.
o
f most
var
iab
le
pr
obe
set
s
in
common
be
tw
e
en
dat
aset
s (
/500
)
250 300 350 400 450 500
0 1 2 3 4 5 6 7
No. of Datasets
Uncorrected Mean-centred Weighted mean-centring
A
B
Chin et al.
Desmedt et al.
Farmer et al.
Ivshina et al.
Richardson et al.
Sotiriou et al.
whilst our manuscript was under review [38], although no attempt was made to account for differences in dataset composition.
Combining two published studies without mean-center-ing, clearly demonstrated how dataset-specific biases can mask the biological differences between breast cancer tumour subtypes (Figure 2). The Farmer et al. [11] dataset was generated from trucut tumour biopsies (4 × 2.5 μm sections), necessitating RNA amplification prior to hybridization to U133A GeneChips. By contrast, RNA in the Richardson et al. 2006 study [10] was derived from tumours following surgical removal, so amplification was not required prior to hybridisation to U133 plus 2.0 GeneChips. Despite the experimental differences between the studies, both of which have been shown above to lead to significant deviations in measured raw intensities in our validation datasets, mean-centering appears to recon-cile the data and leads to the identification of biologically plausible relationships not found when combining uncorrected data.
The gold standard for demonstrating the power of a gene expression classifier is to test it against independent data-sets. However, if the molecular profile of a set of tumours is representative of its patient characteristics, then any prognostic signature will be dependant upon the compo-sition of the patient cohort and therefore be dataset-spe-cific. Thus in order to generate accurate prognostic predictions, the characteristics of this second 'test' dataset must have similar characteristics to the first 'training' set [22]. Recently, strong time dependence was identified for a prognostic signature when comparing an independent validation dataset with a longer median follow-up time (14 years) compared to the original study (8 years) [17]. A number of recent microarray studies have been per-formed after increasing the size of a dataset with addi-tional samples [8,18,20,33], however it is unclear whether subsequent changes in the results are due to changes in the sample composition of the extended dataset or simply to technical effects arising from the microarrays being processed in different batches. Some studies have also based their findings upon combined data from more than one type of Affymetrix GeneChip without evaluating any GeneChip-specific effects.
By integrating six published datasets with patient follow-up information we have demonstrated that combining breast cancer datasets can increase the accuracy of progno-sis prediction and that this can be improved by removing systematic, multiplicative bias. The most accurate progno-sis predictions are generated when the test-sets closely share the patient and tumour characteristics of the train-ing-sets. An alternative approach to building ever larger
Conclusion
Systematic multiplicative biases are introduced at many stages of microarray experiments, however they can easily be accounted for, which can enable raw data to be directly integrated from different gene expression datasets in order to generate results with improved statistical power and greater biological significance.
Methods
RNA preparation
Generation and processing of RNA comparing the two breast cell lines, MCF7 (cancer) and MCF10A (normal immortalised mammary epithelial) was described previ-ously [45,46]. Briefly, cells were grown in Dulbecco's modified Eagle's medium (DMEM) with 10% fetal calf serum (MCF7) or DMEM/F12 with 5% horse serum, 2 ng/ ml, 0.5 μg/ml hydrocortisone, 0.5 μg/ml cholera toxin, and 5 μg/ml insulin (MCF10A). Minimally passaged cells (< 20) were obtained from the American Type Culture Collection ATCC. RNA was isolated using Trizol®
(Ambion) according to manufacturer's instructions, puri-fied using Qiagen RNeasy columns (Qiagen, Valencia, CA) and quantified using a Nanodrop spectrophotometer (Labtech). The quality and amount of starting RNA was confirmed with an Agilent Bioanalyzer 2100 (Agilent) prior to labelling and hybridisation to U133A, HG-U133 plus 2.0, or Human Exon 1.0ST GeneChips (Affymetrix) using either the Affymetrix standard or small sample preparation protocols as previously described [45].
GeneChip processing and analysis
Each experiment was repeated in triplicate, with three samples per cell line for each amount of starting total RNA, protocol or GeneChip used (1 dataset = 3 × MCF7 and 3 × MCF10A = 6 GeneChips). The HGU133A Gene-chips for the standard protocol and amplification experi-ments were scanned using a GeneArray 2500 scanner and the HG-U133 plus 2.0, and Exon 1.0ST Genechips were scanned using a GeneChip Scanner 3000. All MCF7 and MCF10A microarray data is MIAME compliant and acces-sible via MIAME VICE [47]. All protocols are described in full here, http://bioinformatics.picr.man.ac.uk/mbcf/ downloads/. Raw spot readings were processed using R [31] and Bionconductor [48]. Probeset summarisation was done using MAS 5.0 and RMA [49] as implemented in the Simpleaffy package [50] or plier algorithm from Affymetrix ExACT software. Mappings between the Exon and U133A plus 2.0 GeneChips were performed as
described previously [46]. Alternative cell description files, relating probesets to unigene sequences were imple-mented as described previously [5]. Lists of common sig-nificantly differentially expressed genes before and after mean batch-centering were identified using SAM [51] analysis (siggenes BioConductor package) by adjust Δ value to find the top 1000 differentially expressed probesets using each protocol, as described previously [46].
Correction by batch mean-centering
The mean expression level per probeset for a given dataset is subtracted from the individual GeneChip expression level on the Log2 scale. This can simply be performed in R using the 'rowMeans' function. Whilst preparing the man-uscript we also noticed that this can be achieved using the 'pamr.batchadjust' function within the pamr Bioconductor package.
Published data
Affymetrix data was downloaded from a total of ten data-sets from published studies listed in Table 2 from the Gene Expression Omnibus [3] or Array Express [1] repos-itories. Raw .cel files were not available for the Wang et al.
dataset, so all other datasets were normalized as in this study using the MAS 5.0 algorithm with a target intensity of 600 as implemented in the Simpleaffy package [50], using R [31] within BioConductor [48]. NetAffx [9] was used to identify Affymetrix probesets representing the 'intrinsic gene set' previously used to classify human breast tumours [8]. Centered average linkage clustering was performed using the Cluster [35] and TreeView pro-grams as described previously [7]. Supervised principal components analysis using the Superpc for R package was used as previously described [29,30], in order to compare the predictive power of combining different published datasets. The follow up endpoints for the Loi et al., Paw-itan et al. and Sotoriou et al. datasets were recurrence-free survival, for Desmedt et al. and Ivshina et al. datasets it was disease-free survival and for the Minn et al. and Wang
et al. datasets it was distant metastasis-free survival.
Competing interests
The authors declare that they have no competing interests.
Authors' contributions
AHS, CJM, AH and RBC drafted the manuscript. All authors read and approved the final manuscript.
Additional material
Additional file 1
Comparison of Affymetrix gene expression data generated using dif-ferent generations of GeneChips, scanning hardware and protocols. A, Comparing the fold change between replicates across datasets is clearly impractical (grey). However, following mean batch-centering there is good correlation (black). B, Comparison of mean raw expression levels for amplified and unamplified MCF10A replicates before (grey) and after mean batch-centering (black). C, Overall transcriptome similarity of indi-vidual GeneChips demonstrated with Pearson clustering. D, Fold changes are unaffected by mean batch-centering.
Click here for file
[http://www.biomedcentral.com/content/supplementary/1755-8794-1-42-S1.pdf]
Additional file 2
Concordance of mean expression values of data generated from differ-ent experimdiffer-ents. Pearson correlation coefficients are given for uncor-rected and mean batch-coruncor-rected data, for RMA and MAS5 data, and using alternative cdf files [5].
Click here for file
[http://www.biomedcentral.com/content/supplementary/1755-8794-1-42-S2.pdf]
Additional file 3
The top 50 differentially expressed probesets between basal and non basal-like/luminal tumours were identified across datasets. Those probesets in common are listed. Before: comparison was performed prior to mean batch-centering. After: comparison was performed following mean batch-centering.
Click here for file
[http://www.biomedcentral.com/content/supplementary/1755-8794-1-42-S3.pdf]
Additional file 4
Summary of the effect of mean batch-centering on data generated from published studies. Lists of the top 50 differentially expressed probesets between basal and non basal-like/luminal tumours were identi-fied within and across datasets, before and after mean batch-centering. SAM Common: for each column two different pairwise comparisons using SAM were performed, and the top 50 probesets identified for each com-parison. The number reported is the intersection between two lists. UC = uncorrected. MC = Mean centering correction.
Click here for file
[http://www.biomedcentral.com/content/supplementary/1755-8794-1-42-S4.pdf]
Additional file 5
Examples of cross-validation and survival curves from supervised prin-cipal components analysis. Cross validation plots (A, C) and Kaplan Meir recurrence curves (B, C) using the Wang et al. dataset as the test set and either a single (Pawitan et al.) dataset (A, B) or five (Chin et al., Desmedt et al., Ivshina et al., Pawitan et al. and Sotoriou et al.) datasets (C, D) combined as the training set. Values at the top of the cross valida-tion plots are the numbers of probesets used to create the profiles; the black, red and green lines represent the 1st, 2nd and 3rd principal components
respectively.
Click here for file
[http://www.biomedcentral.com/content/supplementary/1755-8794-1-42-S5.pdf]
Additional file 6
Full matrix of the 1109 R2 and p-values for all possible combinations of the six training and test sets. The R2 statistic (Cox proportional
haz-ards model) measures the percentage of the variation in time to recurrence that is explained by each combination of test datasets. The p-values are the associated log-rank statistic obtained when applying the test dataset to the training dataset.
Click here for file
[http://www.biomedcentral.com/content/supplementary/1755-8794-1-42-S6.xls]
Additional file 7
Comparison of published datasets composed of different ratios of basal and luminal tumours. The number of basal (red) and luminal (blue) tumours from The Farmer et al. (italics) and Richardson et al. studies was varied in order to compare the effect of dataset composition, between (A, B, C) and across (D, E, F) the studies. The datasets were either uncor-rected (light grey dots), mean-centered (black open squares) or weighted centered (dark grey open circles). UC = uncorrected, MC = mean-centered.
Click here for file
[http://www.biomedcentral.com/content/supplementary/1755-8794-1-42-S7.pdf]
Additional file 8
Effects of combining datasets composed solely of ER+ or ER- breast tumours. Datasets from Loi et al. [32] and Minn et al. [33] that are composed wholly of ER+ or ER- tumours have distorted levels of ESR1 transcript if integrated with datasets composed of both ER+ and ER- tumours. Replacing any of the six heterogenous datasets with homogene-ous datasets results in a dramatic reduction in the correlation between dataset or tumour number and the association with principal components and recurrence (B).
Click here for file
Acknowledgements
AHS is supported by Breakthrough Breast Cancer, RBC is funded by a Breast Cancer Campaign Fellowship, YH, GS, MJO, SDP and CJM are sup-ported by Cancer Research UK.
References
1. Brazma A, Kapushesky M, Parkinson H, Sarkans U, Shojatalab M: Data storage and analysis in ArrayExpress. Methods Enzymol
2006, 411:370-386.
2. Chu TM, Deng S, Wolfinger R, Paules RS, Hamadeh HK: Cross-site comparison of gene expression data reveals high similarity.
Environ Health Perspect 2004, 112(4):449-455.
3. Barrett T, Suzek TO, Troup DB, Wilhite SE, Ngau WC, Ledoux P, Rudnev D, Lash AE, Fujibuchi W, Edgar R: NCBI GEO: mining mil-lions of expression profiles – database and tools. Nucleic Acids Res 2005:D562-566.
4. Pepper SD, Saunders EK, Edwards LE, Wilson CL, Miller CJ: The util-ity of MAS5 expression summary and detection call algo-rithms. BMC Bioinformatics 2007, 8:273.
5. Dai M, Wang P, Boyd AD, Kostov G, Athey B, Jones EG, Bunney WE, Myers RM, Speed TP, Akil H, et al.: Evolving gene/transcript defi-nitions significantly alter the interpretation of GeneChip data. Nucleic Acids Res 2005, 33(20):e175.
6. Perou CM, Sorlie T, Eisen MB, Rijn M van de, Jeffrey SS, Rees CA, Pol-lack JR, Ross DT, Johnsen H, Akslen LA, et al.: Molecular portraits of human breast tumours. Nature 2000, 406(6797):747-752.
7. Sorlie T, Perou CM, Tibshirani R, Aas T, Geisler S, Johnsen H, Hastie T, Eisen MB, Rijn M van de, Jeffrey SS, et al.: Gene expression pat-terns of breast carcinomas distinguish tumor subclasses with clinical implications. Proc Natl Acad Sci USA 2001, 98(19):10869-10874.
8. Sorlie T, Tibshirani R, Parker J, Hastie T, Marron JS, Nobel A, Deng S, Johnsen H, Pesich R, Geisler S, et al.: Repeated observation of breast tumor subtypes in independent gene expression data sets. Proc Natl Acad Sci USA 2003, 100(14):8418-8423.
9. Liu G, Loraine AE, Shigeta R, Cline M, Cheng J, Valmeekam V, Sun S, Kulp D, Siani-Rose MA: NetAffx: Affymetrix probesets and annotations. Nucleic Acids Res 2003, 31(1):82-86.
10. Richardson AL, Wang ZC, De Nicolo A, Lu X, Brown M, Miron A, Liao X, Iglehart JD, Livingston DM, Ganesan S: X chromosomal abnormalities in basal-like human breast cancer. Cancer Cell
2006, 9(2):121-132.
11. Farmer P, Bonnefoi H, Becette V, Tubiana-Hulin M, Fumoleau P, Lar-simont D, Macgrogan G, Bergh J, Cameron D, Goldstein D, et al.: Identification of molecular apocrine breast tumours by microarray analysis. Oncogene 2005, 24(29):4660-4671. 12. Calza S, Hall P, Auer G, Bjohle J, Klaar S, Kronenwett U, Liu ET, Miller
L, Ploner A, Smeds J, et al.: Intrinsic molecular signature of breast cancer in a population-based cohort of 412 patients.
Breast Cancer Res 2006, 8(4):R34.
13. Sorlie T, Wang Y, Xiao C, Johnsen H, Naume B, Samaha RR, Borre-sen-Dale AL: Distinct molecular mechanisms underlying clini-cally relevant subtypes of breast cancer: Gene expression analyses across three different platforms. BMC Genomics 2006, 7(1):127.
14. Hu Z, Fan C, Oh DS, Marron JS, He X, Qaqish BF, Livasy C, Carey LA, Reynolds E, Dressler L, et al.: The molecular portraits of breast tumors are conserved across microarray platforms. BMC Genomics 2006, 7:96.
15. Kouros-Mehr H, Slorach EM, Sternlicht MD, Werb Z: GATA-3 maintains the differentiation of the luminal cell fate in the mammary gland. Cell 2006, 127(5):1041-1055.
16. Chin K, DeVries S, Fridlyand J, Spellman PT, Roydasgupta R, Kuo WL, Lapuk A, Neve RM, Qian Z, Ryder T, et al.: Genomic and tran-scriptional aberrations linked to breast cancer pathophysiol-ogies. Cancer Cell 2006, 10(6):529-541.
17. Desmedt C, Piette F, Loi S, Wang Y, Lallemand F, Haibe-Kains B, Viale G, Delorenzi M, Zhang Y, d'Assignies MS, et al.: Strong time dependence of the 76-gene prognostic signature for node-negative breast cancer patients in the TRANSBIG multi-center independent validation series. Clin Cancer Res 2007, 13(11):3207-3214.
18. Ivshina AV, George J, Senko O, Mow B, Putti TC, Smeds J, Lindahl T, Pawitan Y, Hall P, Nordgren H, et al.: Genetic reclassification of histologic grade delineates new clinical subtypes of breast cancer. Cancer Res 2006, 66(21):10292-10301.
19. Pawitan Y, Bjohle J, Amler L, Borg AL, Egyhazi S, Hall P, Han X, Hol-mberg L, Huang F, Klaar S, et al.: Gene expression profiling spares early breast cancer patients from adjuvant therapy: derived and validated in two population-based cohorts. Breast Cancer Res 2005, 7(6):R953-964.
20. Sotiriou C, Wirapati P, Loi S, Harris A, Fox S, Smeds J, Nordgren H, Farmer P, Praz V, Haibe-Kains B, et al.: Gene expression profiling in breast cancer: understanding the molecular basis of histo-logic grade to improve prognosis. J Natl Cancer Inst 2006, 98(4):262-272.
21. Wang Y, Klijn JG, Zhang Y, Sieuwerts AM, Look MP, Yang F, Talantov D, Timmermans M, Meijer-van Gelder ME, Yu J, et al.: Gene-expres-sion profiles to predict distant metastasis of lymph-node-negative primary breast cancer. Lancet 2005, 365(9460):671-679.
22. Sims AH, Ong KR, Clarke RB, Howell A: High-throughput genomic technology in research and clinical management of breast cancer. Exploiting the potential of gene expression profiling: is it ready for the clinic? Breast Cancer Res 2006, 8(5):214.
23. van 't Veer LJ, Dai H, Vijver MJ van de, He YD, Hart AA, Mao M, Peterse HL, Kooy K van der, Marton MJ, Witteveen AT, et al.: Gene expression profiling predicts clinical outcome of breast can-cer. Nature 2002, 415(6871):530-536.
Additional file 9
Weighted-mean centering does not significantly improve prognostic prediction when combining datasets or tumours of mean-centering. Five datasets with recorded ER status from immunohistochemistry were used to assess the correction methods as in Figure 4. The R2 statistic (Cox
proportional hazards model) is an assessment of the performance of the predictor generated using each combination of training datasets and the remaining test datasets, generated using supervised principal components analysis. Median values are used where a training dataset was used to asses more than one test dataset (up to 5). R2 and p-value results for all
possible combinations of training datasets and test datasets (1016) are given in the matrix in Additional Table 5.
Click here for file
[http://www.biomedcentral.com/content/supplementary/1755-8794-1-42-S9.pdf]
Additional file 10
Distance-weighted discrimination (DWD) method. Comparison of the DWD method (green dots) between (A, B) and across (C, D) validation (A, C) and published (B, D) datasets with mean-(red dots) and weighted mean-(blue circles) centering (see Table 3 for SAM analysis). E, DWD correction of the two breast tumour gene expression profiles generated by the two published studies as in Figure 2. Clustering of tumours based upon 640 probesets representing Sorlie et al. [8] 'intrinsic' genes. Thumbnail shows all 640 probesets. i) Tumours classified by Richardson et al. [10] red = basal-like, blue = non-basal like, pink = BRCA1; tumours classified by Farmer et al. [11] red = basal, blue = luminal, green = apocrine. Clus-ters of genes associated with the 'Sorlie subtypes' are highlighted as fol-lows; ii) ERBB2 gene cluster, iii) luminal A gene cluster, iv) basal gene cluster. v) Centroid prediction was used to assign the tumours to the five Norway/Stanford subtypes – basal (red), luminal A (dark blue), luminal B (light blue), ERBB2 (purple) and normal-like (green), unassigned (grey).
Click here for file
Publish with BioMed Central and every scientist can read your work free of charge "BioMed Central will be the most significant development for disseminating the results of biomedical researc h in our lifetime."
Sir Paul Nurse, Cancer Research UK
Your research papers will be:
available free of charge to the entire biomedical community
peer reviewed and published immediately upon acceptance
cited in PubMed and archived on PubMed Central
yours — you keep the copyright
Submit your manuscript here:
http://www.biomedcentral.com/info/publishing_adv.asp
BioMedcentral
24. Adler AS, Lin M, Horlings H, Nuyten DS, Vijver MJ van de, Chang HY: Genetic regulators of large-scale transcriptional signatures in cancer. Nat Genet 2006, 38(4):421-430.
25. Chang HY, Nuyten DS, Sneddon JB, Hastie T, Tibshirani R, Sorlie T, Dai H, He YD, Van't Veer LJ, Bartelink H, et al.: Robustness, scala-bility, and integration of a wound-response gene expression signature in predicting breast cancer survival. Proc Natl Acad Sci USA 2005, 102(10):3531-3532.
26. Chi JT, Wang Z, Nuyten DS, Rodriguez EH, Schaner ME, Salim A, Wang Y, Kristensen GB, Helland A, Borresen-Dale AL, et al.: Gene expression programs in response to hypoxia: cell type specif-icity and prognostic significance in human cancers. PLoS Med
2006, 3(3):e47.
27. Liu R, Wang X, Chen GY, Dalerba P, Gurney A, Hoey T, Sherlock G, Lewicki J, Shedden K, Clarke MF: The prognostic role of a gene signature from tumorigenic breast-cancer cells. N Engl J Med
2007, 356(3):217-226.
28. Fan C, Oh DS, Wessels L, Weigelt B, Nuyten DS, Nobel AB, van't Veer LJ, Perou CM: Concordance among gene-expression-based predictors for breast cancer. N Engl J Med 2006, 355(6):560-569.
29. Bair E, Hastie T, Debashis P, Tibshirani R: Prediction by supervised principal components. Stanford Tech Report 2004.
30. Bair E, Tibshirani R: Semi-supervised methods to predict patient survival from gene expression data. PLoS Biol 2004, 2(4):E108.
31. Ihaka R, Gentleman R: R: a language for data analysis and graph-ics. Journal of Computational and Graphical Statistics 1996, 5:299-314. 32. Loi S, Haibe-Kains B, Desmedt C, Lallemand F, Tutt AM, Gillet C, Ellis
P, Harris A, Bergh J, Foekens JA, et al.: Definition of clinically dis-tinct molecular subtypes in estrogen receptor-positive breast carcinomas through genomic grade. J Clin Oncol 2007, 25(10):1239-1246.
33. Minn AJ, Gupta GP, Padua D, Bos P, Nguyen DX, Nuyten D, Kreike B, Zhang Y, Wang Y, Ishwaran H, et al.: Lung metastasis genes couple breast tumor size and metastatic spread. Proc Natl Acad Sci USA 2007, 104(16):6740-6745.
34. Benito M, Parker J, Du Q, Wu J, Xiang D, Perou CM, Marron JS: Adjustment of systematic microarray data biases. Bioinformat-ics 2004, 20(1):105-114.
35. Eisen MB, Spellman PT, Brown PO, Botstein D: Cluster analysis and display of genome-wide expression patterns. Proc Natl Acad Sci USA 1998, 95(25):14863-14868.
36. Johnson WE, Li C, Rabinovic A: Adjusting batch effects in micro-array expression data using empirical Bayes methods. Biosta-tistics 2007, 8(1):118-127.
37. Acharya CR, Hsu DS, Anders CK, Anguiano A, Salter KH, Walters KS, Redman RC, Tuchman SA, Moylan CA, Mukherjee S, et al.: Gene expression signatures, clinicopathological features, and indi-vidualized therapy in breast cancer. Jama 2008, 299(13):1574-1587.
38. Ben-Porath I, Thomson MW, Carey VJ, Ge R, Bell GW, Regev A, Weinberg RA: An embryonic stem cell-like gene expression signature in poorly differentiated aggressive human tumors.
Nat Genet 2008, 40(5):499-507.
39. Zhang Z, Chen D, Fenstermacher DA: Integrated analysis of inde-pendent gene expression microarray datasets improves the predictability of breast cancer outcome. BMC Genomics 2007, 8(1):331.
40. Yau C, Fedele V, Roydasgupta R, Fridlyand J, Hubbard A, Gray JW, Chew K, Dairkee SH, Moore DH, Schittulli F, et al.: Aging impacts transcriptome but not genome of hormone-dependent breast cancers. Breast Cancer Res 2007, 9(5):R59.
41. Amend K, Hicks D, Ambrosone CB: Breast cancer in african-american women: differences in tumor biology from Euro-pean-american women. Cancer Res 2006, 66(17):8327-8330. 42. Carey LA, Perou CM, Livasy CA, Dressler LG, Cowan D, Conway K,
Karaca G, Troester MA, Tse CK, Edmiston S, et al.: Race, breast cancer subtypes, and survival in the Carolina Breast Cancer Study. Jama 2006, 295(21):2492-2502.
43. Millikan RC, Newman B, Tse CK, Moorman PG, Conway K, Smith LV, Labbok MH, Geradts J, Bensen JT, Jackson S, et al.: Epidemiology of basal-like breast cancer. Breast Cancer Res Treat 2007.
44. Yang XR, Sherman ME, Rimm DL, Lissowska J, Brinton LA, Peplonska B, Hewitt SM, Anderson WF, Szeszenia-Dabrowska N, Bardin-Mikolajczak A, et al.: Differences in risk factors for breast cancer
molecular subtypes in a population-based study. Cancer Epide-miol Biomarkers Prev 2007, 16(3):439-443.
45. Wilson CL, Pepper SD, Hey Y, Miller CJ: Amplification protocols introduce systematic but reproducible errors into gene expression studies. Biotechniques 2004, 36(3):498-506.
46. Okoniewski MJ, Hey Y, Pepper SD, Miller CJ: High correspond-ance between Affymetrix exon and standard expression arrays. Biotechniques 2007, 42(2):181-185.
47. MIAME VICE [http://bioinformatics.picr.man.ac.uk/vice] 48. Gentleman RC, Carey VJ, Bates DM, Bolstad B, Dettling M, Dudoit S,
Ellis B, Gautier L, Ge Y, Gentry J, et al.: Bioconductor: open soft-ware development for computational biology and bioinfor-matics. Genome Biol 2004, 5(10):R80.
49. Irizarry RA, Hobbs B, Collin F, Beazer-Barclay YD, Antonellis KJ, Scherf U, Speed TP: Exploration, normalization, and summa-ries of high density oligonucleotide array probe level data.
Biostatistics 2003, 4(2):249-264.
50. Wilson CL, Miller CJ: Simpleaffy: a BioConductor package for Affymetrix Quality Control and data analysis. Bioinformatics
2005, 21(18):3683-3685.
51. Tusher VG, Tibshirani R, Chu G: Significance analysis of micro-arrays applied to the ionizing radiation response. Proc Natl Acad Sci USA 2001, 98(9):5116-5121.
52. Bergamaschi A, Kim YH, Wang P, Sorlie T, Hernandez-Boussard T, Lonning PE, Tibshirani R, Borresen-Dale AL, Pollack JR: Distinct pat-terns of DNA copy number alteration are associated with different clinicopathological features and gene-expression subtypes of breast cancer. Genes Chromosomes Cancer 2006, 45(11):1033-1040.
Pre-publication history
The pre-publication history for this paper can be accessed here: