M E T H O D O L O G Y
Open Access
A two-stage microbial association mapping
framework with advanced FDR control
Jiyuan Hu
1,2, Hyunwook Koh
1, Linchen He
1, Menghan Liu
3, Martin J. Blaser
3and Huilin Li
1*Abstract
Background:In microbiome studies, it is important to detect taxa which are associated with pathological
outcomes at the lowest definable taxonomic rank, such as genus or species. Traditionally, taxa at the target rank are tested for individual association, followed by the Benjamini-Hochberg (BH) procedure to control for false discovery rate (FDR). However, this approach neglects the dependence structure among taxa and may lead to conservative results. The taxonomic tree of microbiome data represents alignment from phylum to species rank and
characterizes evolutionary relationships across microbial taxa. Taxa that are closer on the tree usually have similar responses to the exposure (environment). The statistical power in microbial association tests can be enhanced by efficiently employing the prior evolutionary information via the taxonomic tree.
Methods:We propose a two-stage microbial association mapping framework (massMap) which uses grouping information from the taxonomic tree to strengthen statistical power in association tests at the target rank. massMap first screens the association of taxonomic groups at a pre-selected higher taxonomic rank using a powerful
microbial group test OMiAT. The method then proceeds to test the association for each candidate taxon at the target rank within the significant taxonomic groups identified in the first stage. Hierarchical BH (HBH) and selected subset testing (SST) procedures are evaluated to control the FDR for the two-stage structured tests.
Results:Our simulations show that massMap incorporating OMiAT and the advanced FDR controlling methodologies largely alleviates the multiplicity issue. It is statistically more powerful than the traditional association mapping directly at the target rank while controlling the FDR at desired levels under most scenarios. In our real data analyses, massMap detects more or the same amount of associated species with smaller adjustedpvalues compared to the traditional method, which further illustrates the efficiency of the proposed framework. The R package of massMap is publicly available athttps://sites.google.com/site/huilinli09/softwareandhttps://github.com/JiyuanHu/.
Conclusions:massMap is a novel microbial association mapping framework and achieves additional efficiency by utilizing the intrinsic taxonomic structure of microbiome data.
Keywords:Microbiome, Two-stage microbial association mapping, Taxonomic tree, Microbial group association test, False discovery rate, Hierarchical BH, Selected subset testing
Background
The microbiome has important interactions in human health and disease [1]. Microbiota disturbance has been associated with human diseases including obesity,
dia-betes, Crohn’s disease, and numerous other conditions
[2–5]. With the development of next-generation sequen-cing techniques, it is feasible to extract all the micro-biota from multiple parts of the human body, assess
microbiome composition, and then link it with human
health/diseases [6]. Two high-throughput parallel
se-quencing approaches are widely used; one targeted to the 16S rRNA amplicon sequencing and the other to
metagenomic shotgun sequencing [7].
We introduce our method using microbiome data gen-erated from 16S rRNA sequencing studies. Based on 16S rRNA sequencing, the reads from the amplicons are clus-tered into operational taxonomic units (OTUs) according to sequence similarity, and then their read counts or rela-tive abundances are evaluated. OTUs are assigned to a
* Correspondence:[email protected]
1Division of Biostatistics, Department of Population Health, New York University School of Medicine, New York, NY 10016, USA
Full list of author information is available at the end of the article
taxonomic tree at the kingdom, phylum, class, order, fam-ily, genus, and species ranks [8,9], hierarchically using ei-ther the online Greengenes [10] or the RDP classifier [11] taxonomy assignments. The taxonomic tree displays the evolutionary relationship among the microbial taxa; taxa that are closer on the tree tend to have similar responses to environmental shifts [12,13].
There is general interest to detect association between traits and microbial taxa at the various taxonomic ranks. Researchers usually begin investigation for community-level analysis at the highest taxonomic rank to determine whether the overall microbial profiles are different between groups or associated or not with the trait. For example, the analyses of bacterial communities within (α-diversity) and between samples (β-diversity) [2,3, 14] are two commonly used approaches. Significant results at the community level lead to the further identification of the roles of specific mi-crobes to better understand the mechanisms involved in microbiome perturbations. Most often, investigators are in-terested in the association mapping of taxa at the lowest de-finable rank, such as genus or species, considered as the ‘target rank.’
Several statistical methods have been developed explicitly for microbiome data to examine for differential abundance among groups or to test for microbial association with con-tinuous traits at a specific taxonomic rank [15–18]. LEfSe [15] uses the Kruskal-Wallis test to detect significant differ-ential abundances among groups, but does not correct for multiple comparisons. Other association testing methods, such as metagenomeSeq-fit Zig [16] and STAMP [17], as-sume that the testing taxa are independent. They examine taxa individually and use the q value method [19] or the
Benjamini-Hochberg (BH) procedure [20] to control the
false discovery rate (FDR). Because of the sparse signal and large number of multiple comparisons, this usually leads to very few discoveries. However, the microbes in a commu-nity are usually dependent upon one another, and trait-associated taxa tend to be clustered evolutionarily in-stead of randomly distributed across the community [12]. Therefore, an association mapping framework which could exploit the known taxonomic structure, i.e., the microbial evolutionary relationships, to better target on associated taxa would have substantial potential.
In this study, we propose a powerful two-stage microbial association mapping framework (massMap), which incor-porates advanced FDR-controlling procedures based on the microbial dependence structures through the taxo-nomic tree. In the first stage, an upper-level taxotaxo-nomic rank is first pre-selected as the‘screening rank.’The asso-ciation for taxonomic groups at this selected rank is then tested by OMiAT, a new microbiome-based group associ-ation testing method, designed to discover significant as-sociation signals for an upper-level taxon considering various relative contributions from both microbial
abundance and phylogenetic information in its lower line-ages [18]. In the second stage, the association tests for taxa within the groups discovered in the first stage are per-formed at the‘target rank.’
The proposed framework constitutes three building components: (1) a pre-selected taxonomic rank for screen-ing; (2) a powerful microbial group test OMiAT, to iden-tify the taxonomic groups that contain the associated taxa; and (3) an advanced FDR-controlling methodology to re-solve the dependency among taxa. The taxonomic tree classifies the microbes in the bacterial kingdom into ranks from the most general rank phylum where each taxo-nomic group contains many taxa, to the most specific rank species with one member in each group. Selection of a screening rank balances the group testing power as well as proportion of truly associated taxa among the signifi-cant groups. The group association test for screening is more powerful at a higher rank regarding. However, as the groups classified by the higher rank have too many mem-bers, there is still a very high proportion of unassociated taxa within the groups, i.e., the signal has not condensed enough after screening. Thus, a middle taxonomic rank such as order or family is expected to perform best in the proposed two-stage framework. A highly powerful micro-bial group test guarantees a higher probability that it only eliminates not-associated microbial taxa and retains true signals to the target rank. The data-driven approach of OMiAT is a microbial group test designed for this purpose and it can efficiently detect microbial groups varying in as-sociation patterns. The hierarchical BH (HBH) [21, 22] and the selected subset testing (SST) procedures [23, 24] are two FDR-controlling procedures capable of handling multiple hypotheses with two-stage structures. These have been applied in microarray data analysis and permit greater discovery than the traditional BH procedure [25].
massMap fully utilizes the prior information from the taxonomic tree, in which the first stage eliminates less-promising taxa and therefore condenses the associ-ation signal. Through extensive simulassoci-ations and two real data analyses, we show that massMap achieves higher statistical power and detects more biologically meaning-ful taxa than the traditional one-stage microbial associ-ation test.
Methods
A two-stage microbial association testing framework: massMap
Suppose we have observed the microbial abundance
infor-mation of N subjects for M taxa at the target rank. We
propose to perform the screening test at a pre-selected higher screening rank, and its taxonomy assignment parti-tionsM taxa intoGtaxonomic groups. Let thegth group consist ofmg(mg≥1) taxa then∑gmg=M. For subjecti,
Yi, the abundance of taxa in the gth group as Zig ¼ ðZig1;Zig2;…;ZigmgÞ
0;
andpcovariates asXi= (Xi1,Xi2, …,Xip)′respectively.
At the screening rank, the group association test is used to examine the association between each group of taxa and the outcome trait. We use the logistic regres-sion model for a binary outcome:
Logit P½ ðYi¼1Þ ¼β0þα 0X
iþβ0gZig; ð1Þ
and the linear regression model for a continuous outcome:
Yi¼β0þα 0X
iþβ0gZigþϵi: ð2Þ
whereβ0is the intercept, α= (α1,…,αp)′is the vector of
coefficients of covariates, βg ¼ ðβg1;βg2;…;βgmgÞ 0
is the vector of coefficients for abundance of taxa from group
g, and ϵi is an error term with mean 0 and variance σ2.
The definition of a trait-associated group is that at least one of the taxa in the group is associated with the trait. Correspondingly, the screening hypothesis for the gth group is
H0g :βg1¼βg2¼…¼βgmg ¼0 v:s:H1g
:at least oneβgj≠0; j¼1;…;mg:
OMiAT is a powerful test specifically designed for the detection of varying association patterns for a group of
taxa and can accommodate multiple covariates [18].
Thus, it is a useful screening test for our two-stage asso-ciation mapping framework, and we employ it to test the associations between taxonomic groups and traits. The corresponding test statistic is
MgOMiAT ¼minPTgaSPU;QgOMiRKAT:
whereTgaSPUandQgOMiRKAT are two adaptive test statistics.
TgaSPU is useful for modulating different association pat-terns arising from highly imbalanced microbial abun-dances. It is adapted from the sum of score powered tests (SPU) [26] which was originally proposed for gene- or region-based association testing in genome-wide associ-ation studies [18]. QgOMiRKAT , advantageous in detecting microbial group associations utilizing phylogenetic tree in-formation, is tailored from the microbiome regression-based kernel association test (MiRKAT) [27], originally proposed as a microbial community association test. Please see Eq. (9) of [18] for notation and detailed explan-ation. OMiAT aims to detect varying association patterns which can be captured by either aSPU or OMiRKAT, using the minP procedure within the taxonomy group.
At the target rank, we are interested in the association between each taxon and the outcome trait. For taxonj(j = 1,…,mg) from the gth group, the model for binary,
and continuous trait are
Logit P½ ðYi¼1Þ ¼β0þα0XiþβgjZigj;
and
Yi¼β0þα 0
XiþβgjZigjþϵi:
respectively. Thus, the corresponding targeting hypoth-eses within groupgare
H0g1:βg1¼0 vs H1g1:βg1≠0;
…
H0gj:βgj¼0 vsH1gj:βgj≠0;
…
H0gmg :βgmg ¼0 vsH1gmg :βgmg≠0:
Denote the predicted value of Yi under H0gj by Y^i,
where Y^i¼^β0þα^
0X
i for continuous traits and Y^i
¼Logit−1ð^β 0þα^
0X
iÞ for binary traits, respectively; ^β0
and ^α are the maximum likelihood estimates (MLEs)
under H0gj. The association between the jth taxon and
the trait can be tested by the non-parametric score test statistic [18]:
Ugj¼
XN
i¼1 Yi−Y^i
Zigj;j¼1;…;mg: ð3Þ
We used the residual-permutation method to calculate pvalues of statistics as in [18].
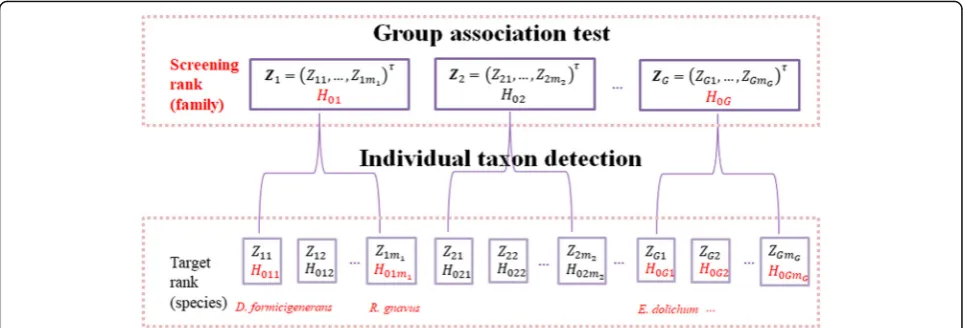
The two-stage microbial association mapping frame-work massMap is described as a two-level hierarchical tree in Fig.1. The group association test and the individ-ual taxon detection are performed at the screening rank and the target rank respectively. massMap screens out groups among which taxa are unlikely to be associated and only retains the more promising ones to the target rank. The association signal condenses after the screen-ing step so that the proportion of truly associated taxa is increased within the candidate groups. By utilizing the advanced FDR controlling procedures introduced below, we could further enhance the association mapping power. Next, we discuss how to implement the advanced FDR controlling procedures to move from the screening rank to the target rank to discover associated taxa.
Advanced FDR controlling procedures
We consider two advanced FDR-controlling procedures:
the hierarchical BH (HBH) procedure [21, 22] and the
selected subset testing with BH (SST) procedure [23,24] to accommodate the hierarchically structured hypoth-eses in massMap. Both procedures involve the assembly of multiple BH procedures. All of the BH procedures
below are conducted at level FDR =q without explicit
T0¼ fH01;…;H0g;…;H0Gg and the target hypotheses
organized into groups by T1¼ fH011;…;H01j;…;H01m1 g;…; TG¼ fH0G1;…;H0Gj;…;H0GmGg. Further, the
cor-responding raw p values are denoted by P0¼ fp01;…;
p0g;…;p0Gg, P1¼ fp011;…;p01j;…;p01m1g;…; and PG ¼ fp0G1;…;p0Gj;…;p0GmGg, respectively.
HBH procedure
The HBH procedure applies to p values arranged in a
tree of disjoint subfamilies and is conducted as follows:
At the screening rank: apply the BH procedure to P0. The groups with adjustedpvalues <qare called the discovered groups. Without loss of generality, we assume that the firstRgroups are discovered;
At the target rank: within thegth discovered group,g = 1, ,R, apply the BH procedure toPg. The taxa with
adjustedpvalues <qare reported as trait-associated taxa.
SST procedure
The SST procedure is to treat the two-level hierarchical tree simply as a two-stage structure, and it can be imple-mented as follows:
At the screening rank: same as in the HBH procedure;
At the target rank: pool the p values from R discovered groups into one set and denote it as Ppooled¼ fp011;…;p01m1;…;p0R1;…;p0RmRg. The
corresponding taxa are called the selected subset. Apply the BH procedure to the pooled p values. The taxa with adjusted p values <q are reported as trait-associated taxa.
The HBH procedure has merit since it reports
many discoveries [21, 22], but it sometimes has
higher FDR than the nominal level. In comparison, SST is more conservative than HBH. If tests between two stages are independent, either utilizing an inde-pendent source of data or testing unrelated hypoth-eses, SST procedure can control the FDR at the desired level. Notice that in our setting, we use the same data to implement the tests in both stages; the test statistics in the second stage might thus not be independent of those in the first stage. As the SST procedure is commonly implemented in microarray analysis where tests from both stages use the same
data [25], we ignore the minor dependence among
tests from both stages and apply the SST procedure to the microbial association mapping analysis. For convenience, we denote the two-stage framework with OMiAT as the screening test and HBH or SST as the FDR-control procedures as OMiAT-HBH or OMiAT-SST, respectively.
Aggregated methods
Apart from OMiAT [18], there are other methods to
de-tect microbial group associations which are termed ag-gregated methods in this article, including commonly
used programs such as LEfSe [15], metagenomeSeq-fit
Zig [16], and STAMP [17]. Even though the modeling
techniques and test statistics used are different, they all assume that the effect sizes and directions of all taxa within the tested group are the same. Under this as-sumption, the abundance within each tested group is summed and regressed towards the outcome. Here, we investigate a representative aggregated method, as illus-trated in [18]. Specifically, for the gth group, the corre-sponding logistic regression model for binary outcome is
Logit P½ ðYi¼1Þ ¼β0þα0Xiþβg
X
jZigj;
and the linear regression model for the continuous out-come is
Yi¼β0þα 0X
iþβg
X
j
Zigjþϵi
where βg is the shared coefficient for the taxa in group
g, which reflects the assumption of the aggregated methods: the effect sizes and directions of all taxa within the tested group are the same. Then, its screening hy-pothesis is
H0g :βg ¼0 vs H1g :βg≠0:
The non-parametric score test statistic from Eq. (3) is used to test this screening hypothesis. As a comparison, we include this test in the simulations and real data ana-lyses and refer to it as the aggregated method. We denote the two-stage framework with the aggregated method as the screening test and HBH or SST as FDR-control proce-dures as AGG-HBH or AGG-SST, respectively.
Traditional one-stage method
The traditional microbial association tests do not require a screening step, rather directly conducting the associ-ation test between the trait and taxa one by one at the target rank. Therefore, the hypotheses set is the union of
hypotheses from G groups, i.e., T ¼ T1∪…∪TG. The
corresponding p value set are denoted by P ¼ P1∪…∪
PG, and are calculated from the non-parametric score
statistics in Eq. (3). In traditional methods, the BH pro-cedure is most commonly used to control FDR for mul-tiple comparisons. We used the traditional method as the benchmark method in both the simulations and real data analyses, and denoted it as BH.
Results
We first conducted comprehensive simulations to evaluate
the performance of OMiAT-HBH, OMiAT-SST,
AGG-HBH, AGG-SST, and BH methods in relation to their false discovery rates (FDR) and true positive rates (TPR) for identifying the associated taxa at the target rank. Then, we further applied those methods to two real microbiome stud-ies to compare their practical performance: one involving
the American Gut Project (AGP) (www.americangut.org)
and the other, a two-group murine study [28].
Simulation settings
The simulation settings were similar to those used in prior studies [18,27,29]. In those studies, the abundance tables were first generated from the Dirichlet-multinomial (DM) distribution based on a real microbiome dataset. Then, the generalized linear model was utilized to generate the
value of outcome traits. OTUs were partitioned into ters using the partitioning-around-medoids (PAM) clus-tering algorithm [30], where OTUs from a certain number of clusters were further assigned to be trait-associated. Following those prior studies, we generated our simula-tion data as below. The taxonomic and phylogenetic tree
information and OTU table from AGP’s baseline
micro-biome data are the basis of our simulated data. In our AGP data analysis, there are 174 OTUs retained after the filtering. We generated the OTU abundance from the DM distribution with 15,000 total reads per sample, using function dirmult() from the R package“dirmult”[31]. The corresponding proportion means and dispersion
parame-ters of the DM distribution were estimated from AGP’s
baseline microbiome data.
The continuous and binary traits were generated under the following linear model (4) and logistic regres-sion model (5), respectively,
Yi¼
X
j∈Λβjscale Zij þϵi ð4Þ
Logit P½ ðYi¼1jZiÞ ¼
X
j∈Λβjscale Zij ð5Þ
where ϵi∼N(0, 1) is the error term, and Zij is the OTU abundance for subject i= 1,…,N. β=(β1,…,βj,…,β|Λ|)′ is a vector of coefficients for the associated OTU.Λis a
set of the indices of truly associated OTU and ∣Λ∣ is
the number of associated OTU.
To estimate the empirical false discovery rate (FDR) and true positive rate (TPR) at the target rank, i.e., the OTU level, we assigned 17 OTUs (10%) as the truly as-sociated taxa as follows. We first partitioned the phylo-genetic tree of AGP data into 10 groups based on the co-phenetic distance matrix using the PAM algorithm. Then, we randomly selected two groups. If the total number of OTUs in the selected groups was greater than 17, we would stop. Otherwise, we would continue select-ing the group randomly without replacement until there
are≥17 OTUs in the selected groups. Lastly, we pooled
all the OTUs in the selected groups together and ran-domly assigned 17 OTUs as trait-associated. As the PAM algorithm partitions OTUs based on their phylo-genetic distances, the associated OTUs from the clusters are phylogenetically closer to each other. This procedure is believed to be more realistic to represent the situation when associated taxa are phylogenetically related [6, 12, 27,30,32]. Also note that the PAM clusters are only for assigning the associated taxa, and we used the original taxonomic structure from AGP data while implementing the massMap.
(βj∼uniform (0, 2)), modest (βj∼uniform (0, 3)) or large effect sizes (βj∼uniform (0, 4)). In contrast, the effect di-rections were mixed in scenario 2, i.e., βj∼ uniform (−2, 2), uniform (−3,3), or uniform(−4, 4). As sensitivity stud-ies, we generated data where only 5% OTUs are trait-associate. This represents the condition when a much smaller proportion of OTUs are associated with the out-come. We also simulated data when associated taxa spread among the taxonomic tree. We partitioned the phylogenetic tree into 50 small groups using the PAM al-gorithm. Then 10% trait-associated OTUs are selected from the 50 groups instead of from the 10 groups. In the sensitivity studies, we only consider scenario 1 for the bin-ary outcome as an illustration. In each simulation, we
gen-eratedN=200 subjects and control the FDR at 0.05. Two
thousand independent replications are conducted for each setting. Thepvalues at screening rank and the target rank are estimated based on 1 × 10⁵permutations.
Simulation results
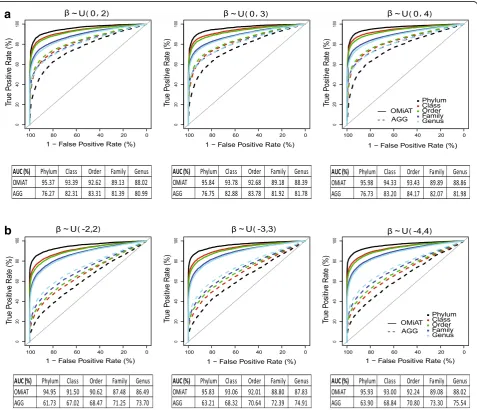
In this section, we present the result for the binary out-come and defer the result for the continuous outout-come in Additional files 1, 2 and 3: Figures S1–S3. We first evaluate the screening performance of OMiAT and the aggregated method using the receiver operating charac-teristic (ROC) curves and the area under the curves (AUCs) at the phylum, class, order, family, and genus ranks, respectively (Fig. 2). From the ROC, it is evident that OMiAT’s curves are consistently higher than those from the aggregated method for all ranks under both
a
b
scenarios (Fig.2afor the same effect direction and Fig.2b for mixed directions). When we look into the AUC, we observe that OMiAT’s performance as a screening test is consistent between two scenarios and its AUC is highest at the phylum rank, and decreases as the taxonomic rank descends. This is explainable since OMiAT is more powerful when the group size is larger and the upper rank (such as phylum) groups consist of more target level taxa than do the lower rank groups. In contrast, the screening performance of the aggregated method is less satisfactory when the associated taxa within the test-ing group are more in mixed directions (Fig.2b) than in
the same direction (Fig. 2a), because the aggregation
cancels the mixed-effect signals. Further, unlike OMiAT, the AUC of the aggregated method increases as the taxonomic rank descends because in theory the aggre-gated method achieves the highest power when all taxa within the group have the same effect size and direction. As groups become smaller at lower taxonomic ranks,
the taxa within the group are more homogeneous, which increases the power of the aggregated method. In sum-mary, through simulations, we verified that the aggre-gated method is not optimal for screening microbial associated groups at the upper rank. As expected, OMiAT exhibits marked performance as screening test statistics in the proposed two-stage framework.
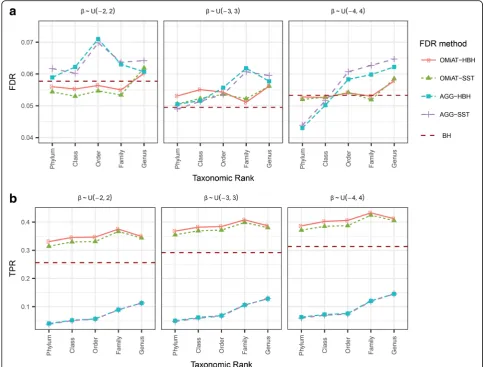
Figures3and4report the empirical FDR and the TPR at
the target rank for OMiAT-HBH, OMiAT-SST,
AGG-HBH, and AGG-SST two-stage tests, when their screening tests are conducted at different taxonomic ranks for two association scenarios, respectively. The traditional one-stage method with BH procedure is considered as the benchmark in this simulation. The empirical FDR is de-fined as the proportion of the false discoveries among all discoveries at the target rank. From Figs.3aand4a, we
ob-serve that OMiAT-HBH and OMiAT-SST’s empirical FDRs
are well-controlled around the nominal level 0.05, except when the screening test is conducted at genus rank in
Scenario 2 with small effect size (empirical FDR = 0.064 and 0.062 for OMiAT-HBH and OMiAT-SST, respectively). Both AGG-HBH and AGG-SST can control the empirical FDR when the associated taxa are in the same direction (Fig.3a), but they are susceptible to having inflated FDRs when the associated taxa are in mixed directions especially at the lower rank (Fig.4a).
The TPR (power) is defined as the proportion of true positives among the true associated taxa at the target rank. Both AGG-HBH and AGG-SST suffer from poor power in both scenarios, owing to the inferior screening performance of the aggregated method. So we just focus on comparing the two-stage OMiAT-HBH and OMiAT-SST with the traditional BH method in the following. The proposed two-stage framework using OMiAT as the screening test has substantial power gain against the traditional BH method, no matter which rank is selected as the screening
rank (Figs3band 4b). Noticeably, both OMiAT-HBH and
OMiAT-SST reach the highest power when family rank is selected as the screening rank. This is a result of the bal-ance between the screening test’s power and proportion of truly associated taxa among the significant groups. Com-paring the results of HBH and SST for controlling FDR, we can see that HBH has relatively higher power than SST, since at the target rank, HBH corrects for the multiple comparisons within each discovered group. In comparison, SST pools candidate taxa from discovered groups together, leading to a higher penalty for multiple comparisons. When the rank of family is chosen as the screening stage, the re-sults for HBH and SST are similar.
The result for the continuous outcome is consistent with that for the binary outcome, as shown in Additional files1, 2 and3: Figures S1-S3. Results of sensitivity studies show that OMiAT-HBH/OMiAT-SST has the FDR well con-trolled around the nominal level and has marked improve-ment on statistical power compared with BH and
AGG-HBH/AGG-SST, when a much smaller proportion of OTUs are associated with the outcome (Additional file 4: Figure S4) and when associated taxa spread among the taxonomic tree (Additional file5: Figure S5). In summary, two implementations of massMap, i.e., OMiAT-HBH and OMiAT-SST control the FDR around the nominal level for most of the simulation scenarios. They achieve substantial statistical power gain over the aggregated method based on the two-stage method and the traditional one-stage method, as they successfully incorporate the dependence structure into the microbial association mapping; their stat-istical powers peak when the screening is performed at the middle taxonomic rank family. Based on the simulation re-sults, we recommend conducting the screening at the fam-ily rank using massMap.
Real data applications
Here, we apply OMiAT-HBH, OMiAT-SST, AGG-HBH,
AGG-SST, and traditional BH methods to the
population-based American Gut Project (AGP) study and a murine gut microbiome dataset [28] to further compare their performance.
American Gut Project
The American Gut Project (www.americangut.org) is a
crowd-sourced project aimed at creating a comprehensive map of the human microbiome. The data include 16S rRNA V4 region sequences from 8610 fecal samples using Illumina MiSeq platform as well as the subjects’metadata, as described in [33]. The full data set includes 22,891 OTUs from 7293 baseline samples. In our analyses, we excluded subjects who (1) were not USA resident; (2) had missing values in variables: sex, gender, body mass index (BMI), or antibiotic history (ABH); (3) were alcoholics; or (4) had BMI≥80. After filtering, 1134 unique baseline samples were retained for analysis. Next, OTUs aligned to the bacteria kingdom were further filtered if (1) they could not be aligned to a family rank, or (2) they are presented in less than 3 individuals, or (3) average relative abundance <0.1%. After filtering, the abundance data related to 90 species were used for our analyses. We performed the microbial as-sociation mapping at the species rank on a binary outcome antibiotic history (ABH) and a continuous outcome body mass index (BMI), respectively. Sex and age are adjusted in both analyses.
Antibiotic history (ABH)
The ABH was coded into a binary response to indicate
whether the subject had (ABH = 1, n= 761) or had not
had (ABH = 0, n= 373) antibiotic usage in the preceding year. The logistic regression model in Eq. (1) was used to fit the data. As suggested by the simulation results, family rank was selected to conduct the screening test. With FDR = 0.05, 12 family groups (consisting of 37 species)
were significantly associated with ABH by OMiAT, while only four groups (consisting of 5 species) are reported by the aggregated method (Additional file 6: Table S1). This indicates that OMiAT is much more powerful as a screen-ing test compared with the aggregated method.
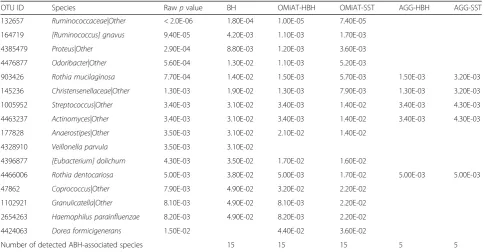
OMiAT-HBH, OMiAT-SST, and traditional BH methods each identified 15 ABH-associated species, among which 14
species are common (Table1). In contrast, AGG-HBH and
AGG-SST only identified five ABH associated species due to the miss-hits of the aggregated method at the screening rank. One possible reason that OMiAT-HBH/OMiAT-SST and the traditional BH method had similar performance was that the antibiotic effect was sufficiently strong to pass the stringent multiple comparison corrections in the trad-itional BH method in this study. However, OMiAT-HBH
and OMiAT-SST produced much smaller FDR-adjusted p
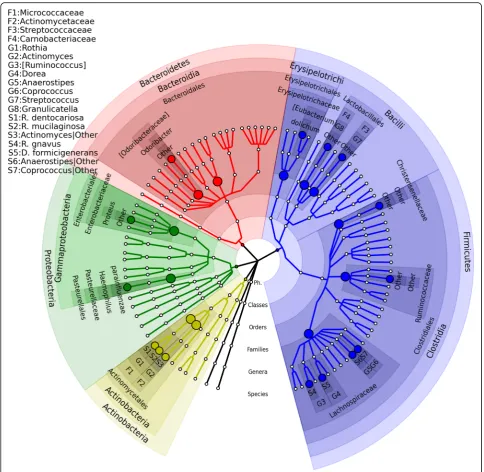
values than did the traditional BH method, which implies that OMiAT-HBH and OMiAT-SST are more efficient. The microbial association mapping results of OMiAT-HBH/ OMiAT-SST are illustrated on a taxonomic tree (Fig. 5). There are four ABH associated microbial species clustered in familyLachnospiraceaeand two species clustered in fam-ily Micrococcaceae. These observations are consistent with the hypothesis that evolutionarily closer taxa usually have similar responses to exposures. Additional file7: Figure S6 shows the relative abundance distributions for discovered species.[Ruminococcus] gnavus,Proteus|Other,Rothia muci-laginosa,Streptococcus|Other,Actinomyces|Other, [Eubacter-ium] dolichum, Rothia dentocariosa, Granulicatella|Other, and Haemophilus parainfluenzae are more abundant in ABH = 1 group; andRuminococcaceae|Other, Odoribacter|-Other, Christensenellaceae|Other, Anaerostipes|Other, Coprococcus|Other, and Dorea formicigenerans are more abundant in ABH = 0 group.
Body mass index (BMI)
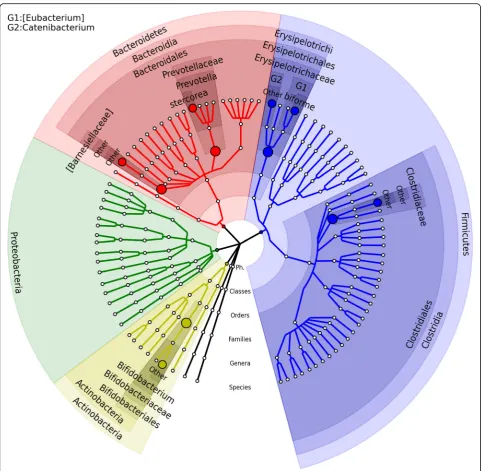
The OMiAT-HBH/OMiAT-SST identified species: [Eu-bacterium] biforme,Bifidobacterium|Other, Catenibacter-ium|Other, and Prevotella stercorea (bold highlighted in Table2) were also reported to be associated with BMI or related phenotypes in other studies [34–36]. Our results
show that the abundances of [Eubacterium] biforme,
Catenibacterium|Other, and Prevotella stercorea were positively associated with BMI; and the abundance of Bifidobacterium|Other was negatively associated with BMI (Additional file9: Figure S7). In two separate studies [33, 34], genus Bifidobacterium was present at higher abundance in normal-weight than in overweight women. In another study, twoBifidobacteriumstrains have signifi-cant effects on obesity in high-fat diet induced rats [34]. Zhang et al. (2008) [35] reported that the
Erysipelotricha-ceae (from phylum Firmicutes) and Prevotellaceae (from
phylumBacteroidetes) families are more abundant in the obesity group than in the normal weight group. In our analyses, identifying microbial associations at the species
level,Catenibacterium|Otherwith OTU ID 4480861 from
family Erysipelotrichaceae, and Prevotella stercorea with
OTU ID 513664 from family Prevotellaceae were
posi-tively associated with BMI.
As a sensitivity analysis, the traditional BH, OMiAT-HBH, OMiAT-SST, AGG-HBH, and AGG-SST methods detected 1, 3, 3, 0, and 0 significant species associated with BMI re-spectively with FDR = 0.05 (Additional file10: Table S3). All methods identified fewer species when a more stringent
FDR threshold was used, but OMiAT-HBH and
OMiAT-SST discovered more.
The effects of early-life antibiotics on murine intestinal microbiota
Livanos et al. (2016) [28] has conducted a longitudinal
microbiome study to examine whether early-life
sub-therapeutic antibiotic treatment (STAT) would alter the gut microbiota and accelerate T1D onset in non-obese dia-betic (NOD) mice. DNA samples from feces were analyzed by targeting the V4 region of the bacterial 16S rRNA genes as described in [37]. Using the QIIME pipeline [38], OTU table and phylogenetic tree were created for 28 control and 21 STAT male mice. Compared with the observational AGP data, the number of observed OTUs and the size of the phylogenetic tree are both much smaller in this experimen-tal mouse study. We re-examined the antibiotic effect on the fecal microbiome immediately after weaning (week 3). Originally, 75 species were observed. After filtering species that were present in≤3 mice, 36 were retained for analysis.
The logistic regression model in Eq. (1) was employed to detect differentially abundant species between the STAT and control groups. The screening test was con-ducted at the family rank in massMap. With FDR = 0.05, OMiAT and the aggregated method identified four and two groups associated with the antibiotic treat-ment, respectively (Additional file 11: Table S4). At the target species rank, the traditional BH, OMiAT-HBH, OMiAT-SST, AGG-HBH, and AGG-SST methods de-tected 9, 11, 11, 4, and 4 significant species associated with antibiotic treatment respectively (Table 3). mass-Map using OMiAT, i.e., OMiAT-HBH and OMiAT-SST,
reported two more significant species than the
Table 1The raw and FDR-adjustedpvalues for the detected ABH-associated species using the AGP data (FDR = 0.05). Adjustedp
values≥0.05 are left blank
OTU ID Species Rawpvalue BH OMiAT-HBH OMiAT-SST AGG-HBH AGG-SST
132657 Ruminococcaceae|Other < 2.0E-06 1.80E-04 1.00E-05 7.40E-05
164719 [Ruminococcus] gnavus 9.40E-05 4.20E-03 1.10E-03 1.70E-03
4385479 Proteus|Other 2.90E-04 8.80E-03 1.20E-03 3.60E-03
4476877 Odoribacter|Other 5.60E-04 1.30E-02 1.10E-03 5.20E-03
903426 Rothia mucilaginosa 7.70E-04 1.40E-02 1.50E-03 5.70E-03 1.50E-03 3.20E-03
145236 Christensenellaceae|Other 1.30E-03 1.90E-02 1.30E-03 7.90E-03 1.30E-03 3.20E-03
1005952 Streptococcus|Other 3.40E-03 3.10E-02 3.40E-03 1.40E-02 3.40E-03 4.30E-03
4463237 Actinomyces|Other 3.40E-03 3.10E-02 3.40E-03 1.40E-02 3.40E-03 4.30E-03
177828 Anaerostipes|Other 3.50E-03 3.10E-02 2.10E-02 1.40E-02
4328910 Veillonella parvula 3.50E-03 3.10E-02
4396877 [Eubacterium] dolichum 4.30E-03 3.50E-02 1.70E-02 1.60E-02
4466006 Rothia dentocariosa 5.00E-03 3.80E-02 5.00E-03 1.70E-02 5.00E-03 5.00E-03
47862 Coprococcus|Other 7.90E-03 4.90E-02 3.20E-02 2.20E-02
1102921 Granulicatella|Other 8.10E-03 4.90E-02 8.10E-03 2.20E-02
2654263 Haemophilus parainfluenzae 8.20E-03 4.90E-02 8.20E-03 2.20E-02
4424063 Dorea formicigenerans 1.50E-02 4.40E-02 3.60E-02
traditional BH method, whereas the aggregated method
had the fewest findings. Two speciesLactobacillus
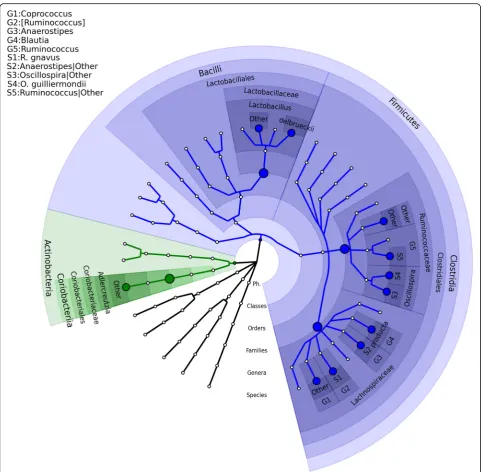
del-brueckii and Oscillospira guilliermondii explicitly re-ported by OMiAT-HBH and OMiAT-SST have much lower relative abundances in STAT mice than in con-trol mice (Additional file12: Figure S8). The associated species reported by the OMiAT-HBH and OMiAT-SST are presented in the taxonomic tree (Fig.7), and they indi-cate a clear clustering association pattern. From the figure,
we observe that there are four associated species clustered
in family Lachnospiraceae and four species clustered in
family Ruminococcaceae that are differentially presented in STAT and control groups. With clustered signals, mass-Map achieves higher power as expected.
Discussion
massMap can easily be extended to examine survival outcome. A highly adaptive microbial group association
test for survival outcome (OMiSA) has been separately developed by our group [39]. Upon publication, it will be added to our massMap software. Furthermore, the concepts underlying massMap can be generalized to the functional pathway analysis of metagenomics data. Con-fronting numerous pathways, one can first test for differ-ential microbial abundance at the pathway level and then proceed to test for differential microbial abundance
at the gene family level. In practice, to implement mass-Map, it is required to pre-determine the screening rank. Based on the simulation results and our practical experi-ence with the real data analyses, we recommend con-ducting the screening at the middle taxonomic rank family. We should note that massMap is an association mapping tool and does not make causal inference. It provides candidate microbial taxa for the follow-up
validation studies, where additional experiments could elucidate the causal role of the discovered taxa on the outcome trait.
massMap uses the relative abundance of taxa to perform the association analysis. The relative abun-dance data is compositional as the summation in
each sample is constrained to one [40]. The log-ratio
transformation of relative abundances have been used to relieve the compositionality issue [6] in vari-ous methods. However, since the compositional ef-fect is attenuating as the number of taxa increases and our goal is to detect which taxa (instead of ratio of taxa) are associated with the outcome, we prefer to work on the relative abundance for better inter-pretation. A school of statistical methods working on the relative abundance data have been developed,
in-cluding differential abundance analyses [41–43] and
association mapping analyses [18, 27, 29].
We shed light on the usage of advanced FDR
control-ling methodologies [21–24] in the two-stage microbial
association analysis. Our simulations were based on the
large-scale population-level microbiome AGP study with
174 OTUs after filtering. The HBH and SST
FDR-controlling procedures can control the FDR in most scenarios while among few scenarios, we did ob-serve minor FDR inflation in HBH and/or SST proce-dures. Similar two-stage analysis has been studied in analyzing microarray data; when there are a large num-ber of hypotheses (usually in the thousands) at the target level in microarray studies, an inflated FDR for the HBH procedure has been reported [21]. Reiner-Benaim et al. (2007) [25] presented a corrected threshold q∗ for both stages to control the FDR around the nominal level in the microarray data analysis setting. A similar correction can be considered if the number of hypotheses in the application is very large.
Sankaran and Holmes (2014) [44] applied the HBH
procedure to an environmental microbiome dataset based on phylogenetic tree of the microbes, which is different from the proposed massMap based on the taxonomic tree. The phylogenetic tree is deeper than the taxonomic tree with complex structure. It consists
Table 2The raw and FDR-adjustedpvalues for the detected BMI-associated species using the AGP data (FDR = 0.10). Adjusted
pvalues≥0.10 are left blank. Note that there is no associated species reported by the aggregated method. The biological evidence
for the bold highlighted taxa has been found in the literature [34–36] and discussed in the text
OTU ID Species Raw p-value BH OMiAT-HBH OMiAT-SST
297635 [Eubacterium] biforme 1.90E-04 1.70E-02 7.60E-04 2.50E-03
824876 Bifidobacterium|Other 2.70E-03 5.30E-03 1.70E-02
4319938 Clostridiaceae|Other 1.00E-02 2.00E-02 3.50E-02
840279 [Barnesiellaceae]|Other 1.10E-02 1.10E-02 3.50E-02
4480861 Catenibacterium|Other 1.50E-02 3.10E-02 4.00E-02
513664 Prevotella stercorea 2.00E-02 8.00E-02 4.30E-02
Number of detected BMI-associated species 1 6 6
Table 3The raw and FDR-adjustedpvalues for the detected STAT-associated species using the murine data (FDR = 0.05). Adjusted
pvalues≥0.05 are left blank
OTU ID Species Rawpvalue BH OMiAT-HBH OMiAT-SST AGG-HBH AGG-SST
33701 Adlercreutzia| Other 2.90E-04 1.00E-02 2.90E-04 5.10E-03
37580 Lactobacillus| Other 1.70E-03 2.40E-02 6.90E-03 1.20E-02
9867 Ruminococcaceae| Other 2.00E-03 2.40E-02 9.20E-03 1.20E-02 9.20E-03 6.90E-03
50804 Ruminococcus| Other 3.70E-03 3.00E-02 9.20E-03 1.50E-02 9.20E-03 8.00E-03
47849 Oscillospira| Other 4.60E-03 3.00E-02 9.20E-03 1.50E-02 9.20E-03 8.00E-03
34428 Coprococcus| Other 5.40E-03 3.00E-02 1.30E-02 1.50E-02
195457 Blautia producta 6.80E-03 3.00E-02 1.30E-02 1.50E-02
35567 [Ruminococcus] gnavus 7.00E-03 3.00E-02 1.30E-02 1.50E-02
2416 Anaerostipes| Other 7.60E-03 3.00E-02 1.30E-02 1.50E-02
10675 Lactobacillus delbrueckii 1.70E-02 3.30E-02 3.00E-02
20780 Oscillospira guilliermondii 2.30E-02 3.50E-02 3.80E-02 3.50E-02 3.20E-02
of many levels and every parent node has a maximum of two daughter nodes. It is not clear whether the HBH procedure applied to the phylogenetic tree
pro-posed in [38] can control FDRs or not. Xiao et al.
(2017) [45] also proposed an FDR-controlling method
based on the hierarchical tree (TreeFDR), with the underlying assumption that associated taxa have the same effect direction and are clustered in the phylo-genetic tree. When this assumption is violated such
as in scenario 2 of our simulation study, TreeFDR would suffer great power loss as the aggregated method did.
Conclusions
In this paper, we focus on developing a two-stage microbial association mapping framework called mass-Map for binary and continuous outcomes. Massmass-Map in-corporates the highly powerful microbial group test
OMiAT for screening and HBH/SST for the control of FDR. Compared with the traditional one-stage method, massMap achieves marked improvements in statistical power while well controlling FDR under most scenarios. Consequently, we recommend that massMap can be ex-tensively used for microbiome-wide association analyses as a highly efficient method.
Additional files
Additional file 1:Figure S1.The ROC curves and area under the ROC curves (AUCs) for OMiAT and the aggregated method for identifying the associated groups at the phylum, class, order, family, and genus ranks, respectively, in relation to the continuous outcome variable. Panel (A) scenario 1: analysis of associated taxa that have the same positive effect direction. (B) Scenario 2: analysis of associated taxa that have mixed effect directions. (PDF 13004 kb)
Additional file 2:Figure S2.The false discovery rate (A) and true positive rate (power) (B) of massMap and the traditional BH method for the continuous outcome variable. Scenario 1: the associated taxa have the same effect direction, with small (β∼uniform(0, 2), left panel), modest (β∼uniform(0, 3), middle panel), and large (β∼uniform(0, 4), right panel) effect sizes. (PNG 397 kb)
Additional file 3:Figure S3.The false discovery rate (A) and true positive rate (power) (B) of massMap and the traditional BH method for the continuous outcome variable. Scenario 2: the associated taxa have mixed effect directions, with small (β∼uniform(−2, 2), left panel), modest (β∼uniform(−3, 3), middle panel), and large (β∼uniform(−4, 4), right panel) effect sizes. (PNG 370 kb)
Additional file 4:Figure S4.The false discovery rate (A) and true positive rate (power) (B) of massMap and the traditional BH method for the binary outcome variable. Five percent OTUs are assigned as the truly associated taxa and have the same effect direction, with small (β∼ uniform(0, 2), left panel), modest (β∼uniform(0, 3), middle panel), and large (β∼uniform(0, 4), right panel) effect sizes. (PNG 135 kb)
Additional file 5:Figure S5.The false discovery rate (A) and true positive rate (power) (B) of massMap and the traditional BH method for the binary outcome variable. We partitioned the phylogenetic tree into 50 groups using PAM algorithm. Ten percent OTUs are assigned as trait-associated, with small (β∼uniform(0, 2), left panel), modest (β∼uniform(0, 3), middle panel), and large (β∼uniform(0, 4), right panel) effect sizes. (PNG 140 kb)
Additional file 6:Table S1.Candidate taxonomic groups at the family rank associated with a history of recent antibiotic use (ABH) in the AGP data analysis. Groups were detected either by OMiAT or by the aggregate method, respectively. FDR = 0.05. (PDF 91 kb)
Additional file 7:Figure S6.Relative abundances of ABH-associated species present in the fecal samples from AGP subjects without (indicated as 0) or with (indicated as 1) recent antibiotic use (ABH). The species were detected by the proposed two-stage framework HBH and OMiAT-SST. The groups with/without recent antibiotic exposure had 761 and 373 subjects, respectively. (PDF 930 kb)
Additional file 8:Table S2.The family groups that were associated with BMI detected by OMiAT in AGP data (FDR = 0.10). The aggregated method did not identify any significant groups at the family rank. (PDF 143 kb)
Additional file 9:Figure S7.The relative abundances of BMI-associated species for AGP subjects grouped by their BMI quantile. The species shown had been detected by the proposed two-stage framework OMiAT-HBH and OMiAT-SST (FDR = 0.10). (PDF 309 kb)
Additional file 10:Table S3.The unadjusted and FDR-adjustedpvalues for the detected BMI-associated species using the AGP data (FDR = 0.05). Adjustedpvalues≥0.05 are left blank. There were no associated species identified by the aggregated method. (PDF 155 kb)
Additional file 11:Table S4.Candidate groups (at the family rank) associated with STAT exposure, detected by OMiAT or by the aggregated
method, respectively, using data from a murine experiment [28] (FDR = 0.05). (PDF 85 kb)
Additional file 12:Figure S8.Comparison of the relative abundances (RA) of the significant species between control (CONT) and STAT (STAT) groups. The species were detected by massMap: HBH and OMiAT-SST (FDR = 0.05). (PDF 1883 kb)
Abbreviations
ABH:Antibiotic history; AGG: The aggregated method; AGP: American Gut Project; BH: Benjamini-Hochberg; BMI: Body mass index; DM: Dirichlet-multinomial; FDR: False discovery rate; HBH: Hierarchical BH; MiRKAT: Microbiome regression-based kernel association test; NOD mice: Non-obese diabetic mice;
OMiAT: Optimal microbiome-based association test; OTU: Operational taxonomic unit; RA: Relative abundance; SPU: Sum of score powered tests; SST: Selected subset testing; STAT: Sub-therapeutic antibiotic treatment; T1D: Type 1 diabetes; TPR: True positive rate
Funding
The study was supported in part by NIH grants, R01 DK090989, R01DK110014, U01AI22285, the Diane Belfer Program in Human Microbial Ecology, and the C&D Fund.
Availability of data and materials
The raw data and metadata of the American Gut Project is publicly available at the ftp website (ftp://ftp.microbio.me/AmericanGut/). Version 07/29/2016 is used in our analyses. 16S rRNA sequencing data of the T1D mice is publicly available at EBI with accession number ERP016357.
The R package massMap implementing the two-stage microbial association mapping framework is publicly available at https://sites.google.com/site/hui-linli09/softwareandhttps://github.com/JiyuanHu/.
Authors’contributions
JH developed the two-stage microbial association mapping framework, performed simulation analyses, real data analyses and manuscript writing. HK performed simulation analyses and manuscript writing. LH performed real data analyses and manuscript writing. ML performed real data analyses and provided the biological insights and interpretation. MJB contributed to the biological insights and interpretation, and to manuscript writing. HL contributed to the methodological ideas for the proposed framework, simulations, real data analyses, and manuscript writing. All authors read and approved the final manuscript.
Ethics approval and consent to participate
All utilized microbiome datasets are publicly available. No ethics approval or consent to participate was required for this study.
Consent for publication
Not applicable. All utilized microbiome datasets are publicly available. No consent for publication was required for this study.
Competing interests
The authors declare that they have no competing interests.
Publisher’s Note
Springer Nature remains neutral with regard to jurisdictional claims in published maps and institutional affiliations.
Author details
1Division of Biostatistics, Department of Population Health, New York University School of Medicine, New York, NY 10016, USA.2Shanghai Center for Mathematical Sciences, Fudan University, Shanghai 200433, China. 3Department of Medicine, New York University School of Medicine, New York, NY 10016, USA.
Received: 23 February 2018 Accepted: 11 July 2018
References
2. Cho I, Yamanishi S, Cox L, Methé BA, Zavadil J, Li K, Gao Z, Mahana D, Raju K, Teitler I. Antibiotics in early life alter the murine colonic microbiome and adiposity. Nature. 2012;488:621–6.
3. Cox LM, Yamanishi S, Sohn J, Alekseyenko AV, Leung JM, Cho I, Kim SG, Li H, Gao Z, Mahana D. Altering the intestinal microbiota during a critical developmental window has lasting metabolic consequences. Cell. 2014;158: 705–21.
4. Bokulich NA, Chung J, Battaglia T, Henderson N, Jay M, Li H, Lieber AD, Wu F, Perez-Perez GI, Chen Y. Antibiotics, birth mode, and diet shape microbiome maturation during early life. Sci Transl Med. 2016;8:343ra382. 5. Halfvarson J, Brislawn CJ, Lamendella R, Vázquez-Baeza Y, Walters WA,
Bramer LM, D'Amato M, Bonfiglio F, McDonald D, Gonzalez A. Dynamics of the human gut microbiome in inflammatory bowel disease. Nat Microbiol. 2017;2:17004.
6. Li H. Microbiome, metagenomics, and high-dimensional compositional data analysis. Annu Rev Stat Appl. 2015;2:73–94.
7. Kuczynski J, Lauber CL, Walters WA, Parfrey LW, Clemente JC, Gevers D, Knight R. Experimental and analytical tools for studying the human microbiome. Nat Rev Genet. 2012;13:47–58.
8. Liu Z, DeSantis TZ, Andersen GL, Knight R. Accurate taxonomy assignments from 16S rRNA sequences produced by highly parallel pyrosequencers. Nucleic Acids Res. 2008;36:e120.
9. Shi P, Li H. A model for paired-multinomial data and its application to analysis of data on a taxonomic tree. Biometrics. 2017;73(4):1266–78. 10. DeSantis TZ, Hugenholtz P, Larsen N, Rojas M, Brodie EL, Keller K, Huber T,
Dalevi D, Hu P, Andersen GL. Greengenes, a chimera-checked 16S rRNA gene database and workbench compatible with ARB. Appl Environ Microbiol. 2006;72:5069–72.
11. Cole JR, Chai B, Marsh TL, Farris RJ, Wang Q, Kulam S, Chandra S, McGarrell DM, Schmidt TM, Garrity GM. The ribosomal database project (RDP-II): previewing a new autoaligner that allows regular updates and the new prokaryotic taxonomy. Nucleic Acids Res. 2003;31:442–3.
12. Chen J, Bushman FD, Lewis JD, Wu GD, Li H. Structure-constrained sparse canonical correlation analysis with an application to microbiome data analysis. Biostatistics. 2012;14:244–58.
13. Purdom E. Analysis of a data matrix and a graph: metagenomic data and the phylogenetic tree. Ann Appl Stat. 2011:2326–58.
14. Nobel YR, Cox LM, Kirigin FF, Bokulich NA, Yamanishi S, Teitler I, Chung J, Sohn J, Barber CM, Goldfarb DS. Metabolic and metagenomic outcomes from early-life pulsed antibiotic treatment. Nat Commun. 2015;6:7486. 15. Segata N, Izard J, Waldron L, Gevers D, Miropolsky L, Garrett WS,
Huttenhower C. Metagenomic biomarker discovery and explanation. Genome Biol. 2011;12:R60.
16. Paulson JN, Stine OC, Bravo HC, Pop M. Differential abundance analysis for microbial marker-gene surveys. Nat Methods. 2013;10:1200–2.
17. Parks DH, Tyson GW, Hugenholtz P, Beiko RG. STAMP: statistical analysis of taxonomic and functional profiles. Bioinformatics. 2014;30:3123–4. 18. Koh H, Blaser MJ, Li H. A powerful microbiome-based association test and a
microbial taxa discovery framework for comprehensive association mapping. Microbiome. 2017;5:45.
19. Storey JD, Tibshirani R. Statistical significance for genomewide studies. Proc Natl Acad Sci U S A. 2003;100:9440–5.
20. Benjamini Y, Hochberg Y. Controlling the false discovery rate: a practical and powerful approach to multiple testing. J R Stat Soc Series B Stat Methodol. 1995;57(1):289–300.
21. Yekutieli D. Hierarchical false discovery rate–controlling methodology. J Amer Statistical Assoc. 2008;103:309–16.
22. Yekutieli D, Reiner-Benaim A, Benjamini Y, Elmer GI, Kafkafi N, Letwin NE, Lee NH. Approaches to multiplicity issues in complex research in microarray analysis. Stat Neerl. 2006;60:414–37.
23. Benjamini Y, Yekutieli D. The false discovery rate approach to quantitative trait loci analysis. Genetics. 2005;171:783–9.
24. Zehetmayer S, Bauer P, Posch M. Two-stage designs for experiments with a large number of hypotheses. Bioinformatics. 2005;21:3771–7.
25. Reiner-Benaim A, Yekutieli D, Letwin NE, Elmer GI, Lee NH, Kafkafi N, Benjamini Y. Associating quantitative behavioral traits with gene expression in the brain: searching for diamonds in the hay. Bioinformatics. 2007;23: 2239–46.
26. Pan W, Kim J, Zhang Y, Shen X, Wei P. A powerful and adaptive association test for rare variants. Genetics. 2014;197:1081–95.
27. Zhao N, Chen J, Carroll IM, Ringel-Kulka T, Epstein MP, Zhou H, Zhou JJ, Ringel Y, Li H, Wu MC. Testing in microbiome-profiling studies with MiRKAT, the microbiome regression-based kernel association test. Am J Hum Genet. 2015;96:797–807.
28. Livanos AE, Greiner TU, Vangay P, Pathmasiri W, Stewart D, McRitchie S, Li H, Chung J, Sohn J, Kim S. Antibiotic-mediated gut microbiome perturbation accelerates development of type 1 diabetes in mice. Nat Microbiol. 2016;1:16140. 29. Wu C, Chen J, Kim J, Pan W. An adaptive association test for microbiome
data. Genome Med. 2016;8:56.
30. Reynolds AP, Richards G, de la Iglesia B, Rayward-Smith VJ. Clustering rules: a comparison of partitioning and hierarchical clustering algorithms. JMMR. 2006;5:475–504.
31. Tvedebrink T. dirmult: estimation in Dirichlet-multinomial distribution. R Package Version 01; 2009. p. 3.
32. Chen J, Li H. Kernel methods for regression analysis of microbiome compositional data. New York, NY: In: Topics in Applied Statistics: Springer; 2013. p. 191–201.
33. Liu M, Koh H, Kurtz ZD, Battaglia T, PeBenito A, Li H, Nazzal L, Blaser MJ. Oxalobacter formigenes-associated host features and microbial community structures examined using the American Gut Project. Microbiome. 2017;5:108.
34. Yin Y-N, Yu Q-F, Fu N, Liu X-W, Lu F-G. Effects of four Bifidobacteria on obesity in high-fat diet induced rats. World J Gastroenterol. 2010;16:3394. 35. Zhang H, DiBaise JK, Zuccolo A, Kudrna D, Braidotti M, Yu Y, Parameswaran
P, Crowell MD, Wing R, Rittmann BE. Human gut microbiota in obesity and after gastric bypass. Proc Natl Acad Sci U S A. 2009;106:2365–70. 36. Cani PD, Delzenne NM. Interplay between obesity and associated
metabolic disorders: new insights into the gut microbiota. Curr Opin Pharm. 2009;9:737–43.
37. Caporaso JG, Lauber CL, Walters WA, Berg-Lyons D, Huntley J, Fierer N, Owens SM, Betley J, Fraser L, Bauer M. Ultra-high-throughput microbial community analysis on the Illumina HiSeq and MiSeq platforms. ISME J. 2012;6:1621.
38. Caporaso JG, Kuczynski J, Stombaugh J, Bittinger K, Bushman FD, Costello EK, Fierer N, Peña AG, Goodrich JK, Gordon JI. QIIME allows analysis of high-throughput community sequencing data. Nat Methods. 2010;7:335–6. 39. Koh H, Livanos A, Blaser M, Li H: A highly adaptive microbiome-based
association test for survival traits. BMC Genomics (under second review with minor revision) 2018.
40. Aitchison J: The statistical analysis of compositional data. 1986.
41. Peng X, Li G, Liu Z. Zero-inflated beta regression for differential abundance analysis with metagenomics data. J Comput Biol. 2016;23:102–10. 42. Chen EZ, Li H. A two-part mixed-effects model for analyzing longitudinal
microbiome compositional data. Bioinformatics. 2016;32:2611–7. 43. Ospina R, Ferrari SL. A general class of zero-or-one inflated beta regression
models. Comput Stat Data Anal. 2012;56:1609–23.
44. Sankaran K, Holmes S. structSSI: simultaneous and selective inference for grouped or hierarchically structured data. J Stat Softw. 2014;59:1. 45. Xiao J, Cao H, Chen J. False discovery rate control incorporating
phylogenetic tree increases detection power in microbiome-wide multiple testing. Bioinformatics. 2017;33:2873–81.