https://doi.org/10.5194/gmd-11-2841-2018 © Author(s) 2018. This work is distributed under the Creative Commons Attribution 4.0 License.
EDDA 2.0: integrated simulation of debris flow initiation and
dynamics considering two initiation mechanisms
Ping Shen1, Limin Zhang1, Hongxin Chen2, and Ruilin Fan1
1Department of Civil and Environmental Engineering, The Hong Kong University of Science and Technology,
Clear Water Bay, Hong Kong
2Key Laboratory of Geotechnical and Underground Engineering of Ministry of Education, Department of Geotechnical
Engineering, Tongji University, China
Correspondence:Limin Zhang ([email protected])
Received: 22 August 2017 – Discussion started: 16 November 2017 Revised: 7 May 201 – Accepted: 15 June 2018 – Published: 13 July 2018
Abstract.Climate change is resulting in more frequent rain-storms and more rain-induced debris flows in mountainous areas. The prediction of likely hazard zones is important for debris flow risk assessment and management. Existing nu-merical methods for debris flow analysis often require the input of hydrographs at prescribed initiation locations, ig-noring the initiation process and leading to large uncertain-ties in debris flow initiation locations, times, and volumes when applied to regional debris flow analysis. The evolu-tion of the flowing mixture in time and space is also barely addressed. This paper presents a new integrated numerical model, EDDA 2.0, to simulate the whole process of debris flow initiation, motion, entrainment, deposition, and prop-erty changes. Two physical initiation mechanisms are mod-elled: transformation from slope failures and surface erosion. Three numerical tests and field application to a catastrophic debris flow event are conducted to verify the model compo-nents and evaluate the model performance. The results in-dicate that the integrated model is capable of simulating the initiation and subsequent flowing process of rain-induced de-bris flows, as well as the physical evolution of the flowing mixture. The integrated model provides a powerful tool for analysing multi-hazard processes, hazard interactions, and regional debris flow risk assessment in the future.
1 Introduction
Debris flows are one of the most catastrophic hazards in mountainous areas (e.g. Zhang et al., 2013; Raia et al., 2014), and can pose high risks to society (e.g. Tang et al., 2011; Gao et al., 2016). They are often triggered by heavy rainfall and sensitive to climate change (e.g. Wong, 2009; Lee et al., 2010). As extreme rainstorms become more frequent, coping with rain-induced debris flows becomes more critical in de-bris flow prone regions such as Italy, Japan, Hong Kong, and earthquake-affected areas in Sichuan, China.
During a storm, debris flows may be initiated by surface erosion, slope failures, or dam breaching (e.g. Takahashi, 2007), and enlarged during the subsequent flowing process (e.g. Iverson, 1997). The debris flow mixture finally deposits in a flatter area, while the interstice fluid still flows along the debris flow track without further material entrainment as rainfall continues. The evolution of the flowing mixture includes three phases in terms of sediment concentration: clear water flow, hyperconcentrated flow, and debris flow. The transition of the flowing mixture between any two phases occurs spatially and temporally during the whole rainfall pro-cess.
DebrisInterMixing (von Boetticher et al., 2016), and As-chFlow (Quan Luna et al., 2016). These programs can simu-late the debris flow movement with either constant or varying properties of the flowing mixture. The entrainment and depo-sition processes can also be considered, such as in EDDA 1.0 (Chen and Zhang, 2015).
Until now, numerical simulation of the physical process of debris flow initiation has been largely avoided in the lit-erature. Moreover, little attempt has been made to simulate the entire process from the initiation to the subsequent de-bris flow motion and deposition in an integrated manner. We address these two research gaps in this paper.
Experimental studies and field monitoring have been con-ducted to study the initiation mechanics of rain-induced de-bris flows (e.g. Johnson and Sitar, 1990; Cui, 1992; Cannon et al., 2001). A few physical models have been proposed (e.g. Takahashi, 1981; Iverson et al., 1997) to reveal the mecha-nisms of initiation using infinite slope stability models which are mathematically one-dimensional and statically determi-nate, leading to unambiguous quantitative results. However, these models do not simulate the debris flow initiation pro-cess, particularly the transformation from a slope failure to a debris flow. Statistical models have also been proposed to re-late debris flow initiation to rainfall (e.g. Caine, 1980; Wiec-zorek, 1987; Chen et al., 2005; Godt et al., 2006; Cannon et al., 2008; Coe et al., 2008; Guzzetti et al., 2008; Baum and Godt, 2010; Berti et al., 2012; Staley et al., 2013; Zhou and Tang, 2014; De Luca and Versace, 2017a, b; Gao et al., 2017a) and other parameters such as surface runoff discharge (Berti and Simoni, 2005) or clay content (Chen et al., 2010). These models are not physically based.
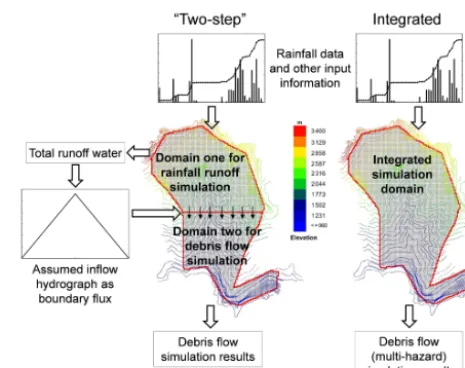
Many of the existing computer programs do not simulate the initiation of debris flows. Instead, they require a prede-fined empirical hydrograph, created based on the estimated volumes of rainfall runoff and source materials, to initiate a debris flow, which is so-called “two-step” analysis (Fig. 1). Two-step analysis leads to large uncertainties in debris flow initiation locations, times, and volumes when applied to re-gional debris flow analysis. For instance, Shen et al. (2017) simulated hillslope debris flows initiated from surface ero-sion, in which the initiation location is artificially intervened (Fig. 1) and the slope failure mechanisms are not included. The integrated simulation of the whole process of debris flow (Fig. 1) remains an open challenge. In addition, the physical rainfall runoff and overland flow processes before the initi-ation of debris flows are overlooked. Currently, the study of the full evolution of the flowing mixture in time and space is limited.
Numerical tools have been developed for simulating sin-gle types of hazards (e.g. H. X. Chen et al., 2015; Shen et al., 2017). However, multiple types of hazards may be in-duced by a rainstorm (i.e. slope failures, debris flows, and flooding) (e.g. Zhang et al., 2014; Zhang and Zhang, 2017). One hazard can be the cause of another (e.g. rainfall trig-gers slope failures that in turn trigger debris flows). Different
Figure 1. Comparison between “two-step” simulation and inte-grated simulation of rain-induced debris flows.
types of hazards can also interact with each other (e.g. sev-eral small debris flows from sub-channels can merge into a larger one). Therefore, hazard risk assessment requires hy-drological, landslide, and debris flow analyses at a regional scale (e.g. Formetta et al., 2011; Archfield et al., 2013). The simulation of the complete processes of possible hazards and their interactions at a regional scale can be a powerful tool to help identify likely hazards, potentially affected areas, and elements at risk. However, the ability to numerically analyse hazard interactions is still limited (e.g. Kappes et al., 2012; Marzocchi et al., 2012). Using the existing “two-step” tools (Fig. 1) to analyse potential regional hazards can be chal-lenging, as they involve tremendous uncertainties and it is time-consuming to conduct “two-step” analyses for each of all potential hazard locations (e.g. Chen and Zhang, 2015; Gao et al., 2016; Shen et al., 2017). Hence, the development of an integrated model for simulating multi-hazard processes and interactions (Fig. 1) is of great theoretical and practical importance.
The objectives of this paper are as follows: (1) to physi-cally incorporate debris flow initiation into the debris flow motion simulation to enable the simulation of the whole pro-cess of rain-induced debris flows, (2) to study the full evo-lution of the flowing mixture in time and space during the whole rainfall process, and (3) to develop a tool to simulate multi-hazard processes and analyse hazard interactions.
2 Methodology
2.1 Strategy of modelling initiation, dynamics, and deposition of debris flows
Figure 2.Conceptual model of a rain-induced debris flow and three typical initiation mechanisms of debris flows: bed erosion, transfor-mation from landslide, and dam breach.
A conceptual model for rain-induced debris flows and likely initiation mechanisms are shown in Fig. 2. Debris flows can be initiated by three mechanisms: transformation from land-slides, surface erosion, and dam breaching. Due to rainfall infiltration the hillslope gradually becomes saturated, and the soil loses its strength, causing shallow seated slope failures (Zhang et al., 2011). During a rainstorm, slope failures can occur at different times in space within a catchment. Some of the detached material may move into channels and form landslide dams, and some may directly transform into debris flows. As the surface runoff accumulates the landslide dam formed earlier in the channel may break, initiating a chan-nelized debris flow (e.g. Liu et al., 2009; Chen et al., 2012; Peng and Zhang, 2012). At the same time, the surface runoff may cause bed erosion and initiate hillslope debris flows (e.g. Cannon et al., 2001). Some of the separate debris flows may merge in the main channel of the drainage basin, forming a larger catastrophic debris flow event (e.g. Iverson et al., 1997). The final magnitude of a debris flow could be many times that of its initial volume due to entrainment of materi-als along the path from additional slope failures, bed erosion, or bank collapses (e.g. Iverson et al., 2011; Chen et al., 2012; Ouyang et al., 2015). If the debris flow reaches a flat residen-tial area downstream in the basin, it can cause severe loss of life and property.
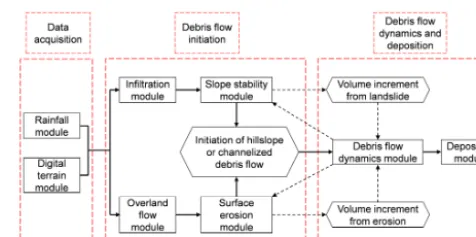
Based on the conceptual model for the whole process of debris flow in Fig. 2 the strategy of the integrated model, in-cluding two debris flow initiation mechanisms (i.e. bed ero-sion and transformation from landslides), is shown in Fig. 3. The integrated model consists of a digital terrain module, a rainfall module, an infiltration module, an overland flow module, a slope stability module, a surface erosion module, a debris flow dynamics module, and a deposition module. The digital terrain module discretizes the study area into a grid system with geological, hydrological, and geotechnical information assigned for each cell. All the computations are based on the concept of cell. As the primary triggering factor,
Figure 3.Framework of the integrated simulation of debris flows.
rainfall is simulated in the rainfall module. Water infiltration into the ground is then simulated to analyse the pore water pressure profile and compute the surface runoff. The slope stability and surface erosion are then evaluated in the slope stability module and surface erosion module, respectively. Once debris flows are initiated by the two physical mecha-nisms, the motion of the flowing mixture is analysed through the debris flow dynamics module. Material entrainment may occur along the flow path, incorporating solid materials from additional slope failures and surface erosion. Finally, the de-position process is assessed through the dede-position module. The runout distance, inundation area, and deposition volume of the debris flows can all be assessed.
2.2 Debris flow dynamics
The core of the proposed integrated analysis is the debris flow dynamics simulation and constitutive modelling of the flowing mixture. The governing equations for debris flow dy-namics describe the mixture movement and changes in debris flow properties, which are depth-integrated mass conserva-tion equaconserva-tions (Eqs. 1 and 2) and momentum conservaconserva-tion equations (Eq. 3) (Chen and Zhang, 2015):
∂h ∂t +
∂(hv)
∂x = (1)
i[Cv* +(1−Cv*)sb] +A[CvA+(1−CvA)sA]
∂(Cvh)
∂t +
∂(Cvhv)
∂x + =iCv* +ACvA (2)
∂v
∂t +v ∂v
∂x = (3)
g
−sgn(v)Sf −
∂(zb+h)
∂x
−v{i[Cv* +(1−Cv*)sb] +A[CvA+(1−CvA)sA]}
h ,
of solids in the flowing mixture;Cv* andCvAare the volume
fraction in the erodible bed and in the entrained materials, re-spectively;sbandsAare the degree of saturation of solids in
the erodible bed and in the entrained materials, respectively; Sf is the energy slope;zb is the bed elevation (m); and the
sgn (i.e. signum) function is used to ensure that the direction of the flow resistance is opposite to that of the flow direction. One of the requirements of the integrated analysis is mod-elling different flowing mixtures simultaneously. The flow-ing mixture can be classified into three types: clear wa-ter flow, hyperconcentrated flow, and fully developed debris flow based on sediment concentration, combining grain-size distribution and particle densities (Pierson, 2005). In this study, the flowing types of mixtures are classified using the volumetric solid concentrationCv, following FLO-2D
Soft-ware Inc. (2009):
1. IfCv<0.2, the fluid mixture is deemed clear water flow
which has a negligible yield stress and a dynamic vis-cosity similar to water.
2. If 0.2< Cv<0.45, a hyperconcentrated flow develops
with a certain level of increased yield stress and dy-namic viscosity.
3. If 0.45< Cv<0.6, the flowing mixture becomes a full
debris flow with substantially increased yield stress and dynamic viscosity.
Therefore, a proper rheological model must involveCvto
account for the changing properties of the flowing mixture. We adopt different rheological models for different ranges of Cvto deal with this problem. For clear water flow, whereCv
is less than 0.2, the energy slopeSf is based on the Manning
equation. If Cv>0.2, a quadratic rheological model
devel-oped by O’Brien et al. (1993) is used:
Sf =
τy
ρgh+ KµV 8ρgh2+
n2tdV2
h4/3 , (4)
whereρis the mass density of the flowing mixture (kg m−3); τy, µ, and ntd are the yield stress (Pa), dynamic viscosity
(Pa s), and the equivalent Manning coefficient of the mix-ture, respectively; andKis the laminar flow resistance.ntdis
expressed as follows (FLO-2D Software Inc., 2009):
ntd=0.0538ne6.0896Cv, (5)
wherenis the Manning coefficient. The following empirical relationships are adopted to estimateτyandµ(O’Brien and
Julien, 1988):
τy=α1eβ1Cv (6)
µ=α2eβ2Cv, (7)
whereα1,α2,β1, andβ2are empirical coefficients.
2.3 Rainfall infiltration and convolution
Under heavy rainfall, excess rainwater becomes surface runoff when the rainfall intensity exceeds the infiltration ca-pacity. In EDDA 2.0, the infiltration capacity is assumed to be the saturated permeability of the surface soil. The surface runoff process is simulated by solving the governing equa-tions (Eqs. 1–3) and the Manning equation withi,A, andCv
equal to zero. The runoff water may cause surface erosion, or mix with landslide mass or flowing mixture, which will be described later.
Water infiltration will increase the subsurface pore water pressure, causing slope failures that are normally shallow-seated. The infiltration process is simulated in EDDA 2.0 by solving the Richards equation with a forward-time central-difference numerical solution. A non-uniform grid is created along the soil depth to enhance the accuracy of the solution near boundaries and interfaces. The integrated program cal-culates the instant pore water pressure profile to facilitate evaluating the slope stability of each cell at each time step. 2.4 Initiation of debris flows from slope failures
A debris flow may be initiated by the transformation of a mass flow of slope failure material at any location and at any time during a storm. The possible locations and approximate failing time can be identified in a cell-based slope stability analysis, if the topography, geology, soil properties etc. are properly defined. To consider this initiation mechanism, the slope instability evaluation must be performed over all the computational cells at each time step.
With the knowledge of real-time pore water pressure pro-files provided by the infiltration module, a real-time slope instability analysis can follow. Considering that these rain-induced slope failures are shallow seated, the thickness of the failure mass is small compared to the large plan dimen-sions of these slopes. Therefore, an infinite slope model for two-layer soil slopes is a reasonable option to evaluate the factor of safety (Fs)(Wu et al., 2016). Following Chen and
Zhang (2014), the search for the minimum Fs goes from
the ground surface to the wetting front where the volumet-ric water content changes significantly. If the minimumFsis
smaller than one, slope failure will occur at the depth corre-sponding to the minimumFs. The landslide mass is assumed
to be a free-flowing mixture immediately after slope failure, with a predefined Cv value for the soil deposit and a flow
depth the same as the failure depth.
2.5 Initiation of debris flows due to bed erosion
To consider this initiation mechanism, the erosion process is analysed within each computational cell at each time step.
We consider the occurrence of erosion under the condition that the bed shear stress is equal to or larger than the critical erosive shear stress of the bed material and the volumetric sediment concentration is smaller than an equilibrium value. The equilibrium value proposed by Takahashi et al. (1992) is adopted in this study:
Cv∞=
ρwtanθ
(ρs−ρw)(tanφbed−tanθ )
, (8)
whereφbedis the internal friction angle of the erodible bed;
ρsis the density of soil particles (kg m−3);ρwis the density
of water (kg m−3); andθis the slope angle.
Many researchers have studied the relationship between the soil erosion rate and shear stress. A form of exponen-tial expression has been used for bed erosion in the literature (e.g. Roberts et al., 1998; Z. Chen et al., 2015). More widely used is a linear function of shear stress (e.g. Graf, 1984; Han-son and Simon, 2001; Julian and Torres, 2006; Chang et al., 2011; Chen and Zhang, 2015):
i=Ke(τ−τc), (9)
whereiis the erosion rate (m s−1);τ is the shear stress at the soil–water interface (Pa);Ke is the coefficient of erodibility
(m3N-s−1); andτc is the critical erosive shear stress at the
initiation of bed erosion (Pa). The latter two parameters de-scribe the erosion resistance of the bed soil and are related to soil index properties (e.g. Chang et al., 2011; Zhu and Zhang, 2016). The shear stress acting on the bed can be expressed as follows (e.g. Graf, 1984):
τ =ρghSf, (10)
whereSf is the energy slope.
2.6 Material exchange: entrainment and deposition Material exchange occurs as a debris flow marches along its flowing path, including material entrainment (solid mass gain from outside of the flowing mixture) and deposition (solid mass loss from inside of the flowing mixture).
Entrainment from additional bed erosion or slope failure materials along its trajectory plays a significant role in debris flow volume amplification. The final volume of the debris flow deposit can be many times that of its initial volume. An excellent example of this is the 1990 Tsing Shan debris flow, which was the largest ever observed in Hong Kong. An orig-inally small slip of 350 m3developed into a final volume of 20 000 m3by entraining colluvium along its flow path (King, 1996). In the integrated model, the landslide mass and sur-face erosion are considered as the sources of material entrain-ment. The slope stability and surface erosion evaluation mod-ule will be called for every computational cell at every time
step; hence, the entrainment process is automatically consid-ered once the two modules are called.
After flowing into a flatter area, deposition of some solid material will occur. Deposition is deemed to occur if the flow velocity is smaller than a critical value andCvis larger than
the equilibrium value described in Eq. 8. The deposition rate can be expressed as
i=δd
1− V
pVe
C
v∞−Cv
Cv*
V , (11)
whereVeis the critical flow velocity following Takahashi et
al. (1992);δdis a coefficient of deposition rate;p(<1) is a
coefficient accounting for the location difference, and a value of 0.67 is recommended (Takahashi et al., 1992);V is the flow velocity; and Cv* is the volume fraction of solids in
the erodible bed. The deposition condition is also detailed in Chen and Zhang (2015).
2.7 Numerical scheme
The terrain is discretized into a grid of cells. Each cell is as-signed with the input data, including topography, soil depth, geotechnical soil properties, rheological model parameters, and so on. There are eight flow directions in each cell: four compass directions and four diagonal directions. In each time step, the infiltration is first evaluated to compute the surface runoff and slope stability at each cell. Then changes in flow depth h and volumetric sediment concentration Cv within
each cell are evaluated considering the surface runoff, slope failure mass entrainment, erosion, and deposition. This is fol-lowed by computing the flow velocity, discharge, and density along the eight flow directions of all the cells, with the aver-aged surface roughness and slope between two cells com-puted. The changes inhandCvdue to the flow exchange are
finally evaluated at each cell.
After all the computations have been completed in each time step, numerical stability criteria are checked for each cell to limit the time step and avoid surging while allowing for large time steps. Three convergence criteria are adopted:
1. The Courant–Friedrichs–Lewy (CFL) condition, with the physical interpretation that a particle of fluid should not travel more than the cell size in one time step (Fletcher, 1990), is mostly used in explicit schemes. The time step is limited by
1t≤C1x/(βV+c), (12)
whereC is the Courant number (C is not smaller than or equal to one);mis a coefficient (5/3 for a wide chan-nel); andcis the computed wave celerity.
2. The percent change of flow depth in one time step should not exceed a specified tolerant value, TOLP(h). 3. The change in flow depth in one time step should not
ap-Figure 4.A satellite image of the study area taken shortly after the Xiaojiagou debris flow on 14 August 2010.
plied when the flow moves to a cell with zero flow depth.
Adjusting these three criteria, the computational time and accuracy could reach a good balance. If all the numerical stability criteria are successfully satisfied, the time step can be increased for the next computational cycle. Otherwise the time step is reduced and the computation restarted. The vol-ume conservation is computed at the end of each time step for the inflow, outflow, grid system storage, and infiltration loss.
3 Model verification
The previous version, EDDA 1.0 (Chen and Zhang, 2015), passed several verification tests including debris flow dynam-ics, erosion, and deposition. In this new version of integrated analysis, the new modules for surface runoff, coupled infil-tration, and slope stability analysis, and the integrated pro-gram require further verification. The response of Xiaojiagou Ravine during a rainstorm in August 2010 is used to ver-ify the new modules. The in situ conditions shortly after the 2010 Xiaojiagou debris flow event are shown in Fig. 4. The Xiaojiagou Ravine has an area of 7.84 km2. The elevation of the ravine ranges between 1100 and 3200 m. The hillslopes within the ravine are very steep with an average slope angle of 46◦. There is one main drainage channel and four branches within the Xiaojiagou Ravine. The loose soil deposits on the hillslopes and channels of the ravine before the debris flow event are identified based on field investigations and inter-pretation of a satellite image (e.g. Chen and Zhang, 2014).
Figure 5.Rainfall process of the August 2010 rainstorm.
The rainstorm process triggering the catastrophic Xiaojiagou debris flow is presented in Fig. 5. The rainstorm lasted about 40 h with a total precipitation of 220 mm. In this study, the rainfall is assumed to be uniformly distributed. Spatially vari-able rainfall data can be used when a large area is consid-ered, as spatial rainfall variation and the potential of trigger-ing landslides are correlated (Gao et al., 2017b).
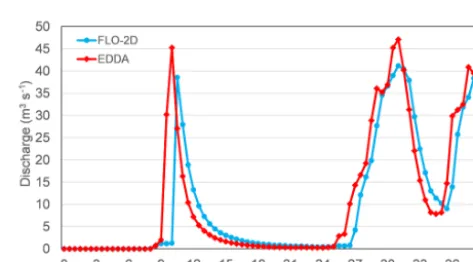
First the performance of the rainfall runoff module of the integrated program is compared with a commonly used pro-gram FLO-2D (FLO-2D Software Inc., 2009). The infiltra-tion module is then checked against an analytical soluinfiltra-tion under steady rainfall. The slope stability analysis is verified by comparing it with the landslide satellite image and the computation results by Chen and Zhang (2014). Finally, the performance of the integrated model is checked against the 2010 Xiaojiagou debris flow event in Sect. 4.
3.1 Verification test 1: rainfall runoff
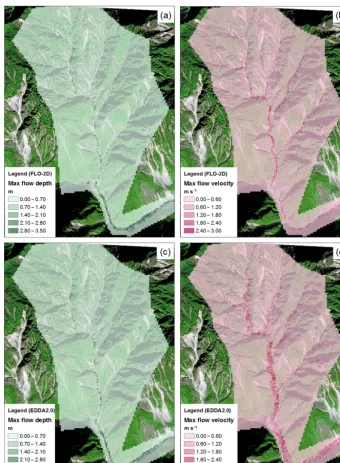
The same input data are used in EDDA 2.0 and FLO-2D, in-cluding the digital elevation model, the Manning coefficient (n=0.3), the limiting Froude number (Lf=0.8), the
satu-rated permeability of the surface soil (kst=3.6 mm h−1 or
10−6m s−1), and the rainfall data (Fig. 5). Other
Figure 6.Comparison of the maximum surface runoff flow depths and flow velocities simulated using FLO-2D(a, b)and EDDA 2.0(c, d).
3.2 Verification test 2: infiltration process and resulting pore water pressure changes
Before applying the infiltration module to compute the pore water pressure profiles under the actual rainfall event, four cases of infiltration under steady rainfall are adopted to verify the infiltration module. The results are compared with those from an analytical solution by Srivastava and Yeh (1991) and Zhan et al. (2013). The scenario of two-layer soil is con-sidered, which is also used in the field application. Table 1 presents the input parameters for the four cases. Four combi-nations are set up to represent likely in situ conditions. The results from the numerical infiltration module and the
ana-lytical solution are compared in Fig. 8. For all the four cases, the module performance is satisfactory.
3.3 Verification test 3: slope stability analysis
rain-Table 1.Parameters used in the infiltration module verification.
Case Vertical depth (cm) α(cm−1) θs θr ks(cm h−1) qa qb γ(◦) Rainfall duration (h)
1 100 0.1 0.40 0.06 10 0.1 0.9 0 20
100 1
2 100 0.01 0.40 0.06 1 0.1 0.9 0 20
100 10
3 400 0.01 0.42 0.18 3.6 0 0.4kst 40 20
100 0.30 0.10 0.036
4 400 0.01 0.42 0.18 3.6 0 kst 40 20
100 0.30 0.10 0.036
Notes:αis the constitutive parameter;θsis the saturated water content;θris the residual water content;ksis the saturated permeability;qais the
antecedent rainfall intensity;qbis the rainfall intensity for time greater than zero; andγis the slope angle. Parametersα,θsandθrare used in the
constitutive relations between the hydraulic conductivity and moisture content and the pressure head (Srivastava and Yeh, 1991).
Table 2.Properties of four types of superficial materials.
Geological type c0(kPa) φ0(◦) γsat(kN m−3) Ks(m s−1) α(cm−1) θs θr
Vegetated land 10.5 37 21 1×10⁻⁶ 0.8 0.40 0.25
Bedrock – – – 0 – – –
Loose soil deposit 4 37 21 1×10⁻⁵ 0.8 0.42 0.18
Riverbed – – – 1×10⁻³ – – –
Notes:c0is the true cohesion of soil;φ0is the friction angle of soil;γsatis the unit weight of solid particles; andKsis the saturated
permeability of soil.
Table 3.Soil properties for debris flow simulation.
d50(mm) ρs(kg m−3) Cv* sb τc(Pa) Ke(m3N-s−1)
35 2650 0.65 1 8.7 78.5×10⁻⁹
Notes:d50is the mean grain size;ρsis the density of solid particles;Cv*is the volume
fraction of solids in the erodible bed;sbis the degree of saturation of the erodible bed;τc
is the critical erosive shear stress; andKeis the coefficient of erodibility.
Table 4.Constitutive (rheological) parameters for debris flow sim-ulation.
α1(Pa) β1 α2(Pa s) β2 K δd n
3.8 3.51 0.02 2.97 2500 0.02 0.16
Notes:α1,β1are the empirical coefficients for calculatingτy;α2,β2are the
empirical coefficients for calculatingµ;Kis the laminar flow resistance coefficient;δdis the deposition coefficient; andnis the Manning coefficient.
storm conditions from August 2010 (Fig. 5) by Chen and Zhang (2014), who evaluated the slope stability of a 164.5 km2area near the epicentre. All the parameters in this research are the same as those in Chen and Zhang (2014), with the only difference being that the focus area in this study is Xiaojiagou Ravine (Fig. 4). The loose soil deposits are as-sumed to be two layers. Given the same parameters such as the topography, layer thicknesses, and soil properties, the un-stable cells when rainfall terminates are computed using the slope failure module. Comparing the simulation results with the observation (Fig. 9), the computed unstable cells
gen-Figure 7.Comparison of the outflow hydrographs at the ravine mouth using FLO-2D and EDDA 2.0.
Figure 8.Pore water pressure profiles at various times:(a)case 1;(b)case 2;(c)case 3; and(d)case 4.
4 Field application
4.1 Xiaojiagou debris flow on 14 August 2010
A heavy rainstorm swept the epicentre of the event, Yinxiu town, and its vicinity. The rainstorm lasted about 40 h from 12 to 14 August 2010, delivering a total of about 220 mm of precipitation (Fig. 5). A catastrophic debris flow was trig-gered by the storm in Xiaojiagou Ravine (Fig. 4). The de-bris flow was witnessed at the ravine mouth at approximately 05:00 LT on 14 August and lasted about 30 min. Roughly 1.17×10⁶m3of the soil deposit was brought out of the Xi-aojiagou Ravine mouth in a form of a channelized debris flow. The runout material deposited in front of the mouth, burying 1100 m of Province Road 303 (PR303), blocking Yuzixi River, forming a debris flow barrier, and raising the river bed by at least 15 m.
4.2 Input information
In EDDA 1.0, the study area has to be divided into two do-mains for rainfall runoff simulation and debris flow runout simulation respectively. However, in the integrated simula-tion by EDDA 2.0, only one grid of 9500 30×30 m cells is created (Fig. 1). After the Xiaojiagou debris flow, de-tailed field investigations and laboratory tests were con-ducted (Chen et al., 2012), as well as numerical back analysis (Chen et al., 2013). The study area is divided into four zones
Figure 10.Simulation results of the Xiaojiagou debris flow:(a)final shape and depth of the erosion zone;(b)maximum flow velocity.
Figure 11.Comparison of the simulated and observed deposition zones:(a)simulation result;(b)enlarged view of the observed deposition area (Chen and Zhang, 2015).
by satellite interpretation: bare soil, vegetated soil, bedrock, and river bed (Chen and Zhang, 2014). The soil properties of each zone and the constitutive (or rheological) parameters used in the integrated simulation are determined following EDDA 1.0 (Chen and Zhang, 2015), shown in Tables 2–4. The erosion resistance parametersτcandKeof the soils are
determined using the empirical equations based on field tests
in the Wenchuan earthquake zone (Chang et al., 2011): τc=6.8PI1.68P−1.73e−0.97 (13)
Ke=0.020075e4.77Cu−0.76, (14)
wheree is the void ratio; “PI” is the plasticity index;P is the fines content (<0.063 mm); andCuis the coefficient of
Figure 12.Outflow hydrograph and changes inCvat the Xiaojiagou Ravine mouth during the simulation period.
al. (2011). Therefore, τc andKe are estimated to be 8.7 Pa
and 7.85×10⁻⁸m3N-s−1, respectively. Uncertainties in the soil properties may also be included when considering soil spatial variability (Xiao et al., 2017).
4.3 Integrated simulation results
We examine the final output of the integrated simulation first. Erosion plays an important role in the volume magnifica-tion of debris flows. The final erosion depths in the eroded areas are shown in Fig. 10a. The most eroded areas during the Xiaojiagou debris flow event were in channels, where a huge amount of loose solid material was present (Chen et al., 2012). Loose deposits on the hillslopes also eroded after the landslide bodies detached from their original locations and slid down the slopes. The distribution of the eroded areas reflects that the debris flows were initiated from both slope failures and surface erosion, then developed along the chan-nels by further erosion and entrainment of the slope failure materials; these are the two mechanisms considered in the integrated model. The distribution of the maximum flow ve-locity is shown in Fig. 10b, with the maximum value being 9.5 m s−1. This value is very close to that from EDDA 1.0 (9.1 m s−1). The slightly larger value of flow velocity from EDDA 2.0 is attributed to the consideration of the extra sur-face runoff within domain two created when using EDDA 1.0 (Fig. 1). The maximum velocity occurs in the ravine chan-nels, indicating that the debris flow moves very rapidly.
The simulated and observed deposition areas are com-pared in Fig. 11. It is seen that the simulation results (Fig. 11a) match the observation (Fig. 11b) reasonably well. The simulated deposition depth is approximately 20 m, very close to that of the observed thickness of the deposit fan during the field investigations. The total volume of the ob-served deposition fan is about 1.17×10⁶m3, while the sim-ulated deposition volume of the debris flow is 0.9×10⁶m3. The integrated model evaluates a smaller debris flow volume
and the difference is about 23 %. The main uncertainty arises from the slope failure module and surface erosion module.
The changes in the volumetric sediment concentrationCv
and the discharge hydrograph at leg 1-1 (see Fig. 4) are recorded during the simulation of the whole rainfall process, shown in Fig. 12. The integrated model simulates two peaks in the discharge process throughout the rainfall with a pre-cursory boulder front arriving in advance. At around 12 h, the value ofCvincreases very quickly to a peak value of 0.6,
indicating the arrival of the debris flow. Afterwards,Cv
de-creases, which can be viewed as a hyperconcentrated flow or a clear water flow after the debris flow passes. Another large debris flow surge is simulated at around 32 h with the same pattern as the first one. The debris flow passes through leg 1-1 (see Fig. 4) first and continues to develop for some time. After most of the solid materials are carried away by the debris flow surge, the flow at leg 1-1 becomes a hyper-concentrated flow. The flowing mixture then gradually be-comes a clear water flow as the rainwater continues to gener-ate surface runoff without further mgener-aterial entrainment. The integrated simulation is capable of simulating multiple debris flow surges and the changes in the flowing mixture properties throughout a rainfall event.
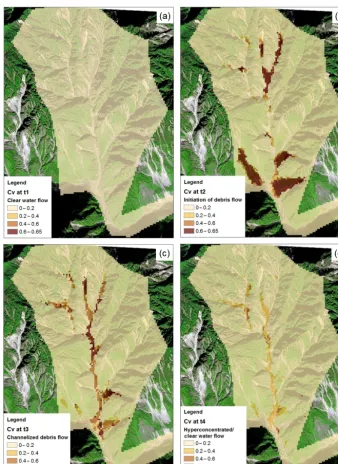
To demonstrate the evolution of the flowing mixture within the drainage basin, the distributions ofCvat four snapshots
during the storm are shown in Fig. 13. The recording times of these four figures span a complete evolution cycle, i.e. clear water flow (Fig. 13a), debris flow initiation (Fig. 13b), debris flow motion (Fig. 13c), and hyperconcentrated flow/clear wa-ter flow (Fig. 13d). This evolution cycle could occur within the basin several times in different branch channels, which can be captured by the integrated model.
5 Limitations of EDDA 2.0
We have successfully extended the “two-step” debris flow simulation to an integrated simulation of the whole process of rain-induced debris flows. However, there are still limita-tions in the underlying assumplimita-tions and simplificalimita-tions:
1. EDDA 2.0 considers the initiation of debris flows from the transformation of slope failures and surface erosion. However, the initiation from dam breaching has not yet been tested.
2. The studies consider material entrainment from surface erosion and slope failure detachment, but the entrain-ment from bank failures can only be considered using an empirical rate, instead of via a three-dimensional phys-ical model.
Figure 13.Distributions ofCvat different times during the storm event:(a)clear water flow;(b)initiation of debris flows;(c)channelized debris flows; and(d)post hyperconcentrated/clear water flow.
4. The rheological models for the hyperconcentrated flow, fully developed debris flow, and slope failure mass flow need further study. The slope failure mass movement is particularly critical for estimating the transformation rate from a slope failure to a debris flow.
6 Summary and conclusions
A new integrated simulation model is developed for simulat-ing rain-induced debris flow initiation, motion, entrainment, deposition, and property changes. The model is unique in
that it simulates the whole process of rain-induced debris flow evolution and two physical initiation mechanisms (i.e. transformation from landslides and surface erosion). Previ-ous “two-step analysis” with an assumed inflow hydrograph and an inflow location can now be conducted at once, scien-tifically, and without subjective assumptions.
from the two models are very close, which indicates that EDDA 2.0 simulates rainfall runoff well. In test 2, an ana-lytical solution for evaluating the pore water pressure profile under infiltration is adopted. Comparison between the model solution and the analytical solution indicates that the inte-grated model evaluates the infiltration process well. The re-gional slope stability within the study area under the same rainstorm was evaluated using the integrated model in test 3. The computed unstable cells compare well with the observa-tions from the satellite image and the results from previous studies.
The new integrated model was finally applied to reproduce the Xiaojiagou debris flow event. The model can simulate the entire evolution process of rain-induced debris flows, and es-timates the volume, inundated area, and runout distance of the debris flow reasonably well . It is concluded that the new integrated debris flow simulation model, EDDA 2.0, is ca-pable of (1) simulating the whole process of rain-induced debris flow from debris flow initiation to post-initiation de-bris flow motion, entrainment and deposition, and (2) tracing the evolution of the flowing mixture in time and space dur-ing the whole process of rainfall. The integrated model will serve as a powerful tool for analysing multi-hazard processes and hazard interactions, and the assessment of regional de-bris flow risks in the future.
Code and data availability. EDDA 2.0 is written in FORTRAN, which can be compiled using Intel FORTRAN compilers. A doi has been generated for the source code and the source code is available online at https://doi.org/10.5281/zenodo.1033377. The source code is also available online as a Supplement to this paper. The main subroutine is “dfs.F90”, which presents the numerical solution al-gorithm for evaluating debris flow initiation from erosion and slope failures, and for solving the governing equations of the dynamics of the flowing mixture. An input file is needed (“edda_in.txt”) for inputting material properties, hydrological and rheological param-eters, and control settings. As an integrated program, EDDA 2.0 can be used to analyse regional slope failures, so the “edda_in.txt” file also includes the material properties and controlling options for slope stability analysis. Another input file (“outflow.txt”) is required to define the outflow cell. Digital terrain data (e.g. surface elevation, slope gradient, and erodible layer thickness) are included in sepa-rate ASCII grid files and enclosed in the data folder. Output files are stored in the results folder and output variables at selected points are stored in “EDDALog.txt”.
Supplement. The supplement related to this article is available online at: https://doi.org/10.5194/gmd-11-2841-2018-supplement.
Author contributions. LZ and PS conceived the methodology and formulated the model. PS programmed the analysis code and per-formed the analysis. HC and RF evaluated the model results. All authors contributed to the writing of the manuscript.
Competing interests. The authors declare that they have no conflict of interest.
Acknowledgements. The authors acknowledge support from the Research Grants Council of the Hong Kong SAR (grant numbers C6012-15G and 16206217).
Edited by: Bethanna Jackson
Reviewed by: two anonymous referees
References
Archfield, S. A., Steeves, P. A., Guthrie, J. D., and Ries III, K. G.: Towards a publicly available, map-based regional software tool to estimate unregulated daily streamflow at ungauged rivers, Geosci. Model Dev., 6, 101-115, https://doi.org/10.5194/gmd-6-101-2013, 2013.
Baum, R. L. and Godt, J. W.: Early warning of rainfall-induced shal-low landslides and debris fshal-lows in the USA, Landslides, 7, 259– 272, https://doi.org/10.1007/s10346-009-0177-0, 2010. Bartelt, P., Buehler, Y., Christen, M., Deubelbeiss, Y., Graf, C.,
McArdell, B., Salz, M., and Schneider, M.: A numerical model for debris flow in research and practice, User Manual v1.5 De-bris Flow, WSL Institute for Snow and Avalanche Research SLF, Switzerland, 2013.
Beguería, S., Van Asch, Th. W. J., Malet, J.-P., and Gröndahl, S.: A GIS-based numerical model for simulating the kinematics of mud and debris flows over complex terrain, Nat. Hazards Earth Syst. Sci., 9, 1897–1909, https://doi.org/10.5194/nhess-9-1897-2009, 2009.
Berti, M. and Simoni, A.: Experimental evidences and numerical modelling of debris flow initiated by channel runoff, Landslides, 2, 171–182, https://doi.org/10.1007/s10346-005-0062-4, 2005. Berti, M., Martina, M. L. V., Franceschini, S., Pignone, S.,
Si-moni, A., and Pizziolo, M.: Probabilistic rainfall thresholds for landslide occurrence using a Bayesian approach, J. Geophys. Res.-Earth, 117, F04006, https://doi.org/10.1029/2012JF002367, 2012.
Boss Corporation: DAMBRK-User’s manual, Boss International Inc., Madison, Wisconsin, USA, 1989.
Caine, N.: The rainfall intensity: duration control of shallow landslides and debris flows, Geogr. Ann. A, 62, 23–27, https://doi.org/10.2307/520449, 1980.
Cannon, S. H., Kirkham, R. M., and Parise, M.:
Wildfire-related debris-flow initiation processes, Storm King
Mountain, Colorado, Geomorphology, 39, 171–188,
https://doi.org/10.1016/S0169-555X(00)00108-2, 2001. Cannon, S. H., Gartner, J. E., Wilson, R., Bowers, J., and
Laber, J.: Storm rainfall conditions for floods and de-bris flows from recently burned areas in southwestern Col-orado and southern California, Geomorphology, 96, 250–269, https://doi.org/10.1016/j.geomorph.2007.03.019, 2008. Chang, D. S., Zhang, L. M., Xu, Y., and Huang, R. Q.: Field
Chen, C. Y., Chen, T. C., Yu, F. C., Yu, W. H., and Tseng, C. C.: Rainfall duration and debris-flow initiated stud-ies for real-time monitoring, Environ. Geol., 47, 715–724, https://doi.org/10.1007/s00254-004-1203-0, 2005.
Chen, H. X. and Zhang, L. M.: A physically-based
dis-tributed cell model for predicting regional
rainfall-induced shallow slope failures, Eng. Geol., 176, 79–92, https://doi.org/10.1016/j.enggeo.2014.04.011, 2014.
Chen, H. X. and Zhang, L. M.: EDDA 1.0: integrated simula-tion of debris flow erosion, deposisimula-tion and property changes, Geosci. Model Dev., 8, 829–844, https://doi.org/10.5194/gmd-8-829-2015, 2015.
Chen, H. X., Zhang, L. M., Chang, D. S., and Zhang, S.: Mech-anisms and runout characteristics of the rainfall-triggered debris flow in Xiaojiagou in Sichuan Province, China, Nat. Hazards, 62, 1037–1057, https://doi.org/10.1007/s11069-012-0133-5, 2012. Chen, H. X., Zhang, L. M., Zhang, S., Xiang, B., and Wang, X.
F.: Hybrid simulation of the initiation and runout character-istics of a catastrophic debris flow, J. Mt. Sci., 10, 219–232, https://doi.org/10.1007/s11629-013-2505-z, 2013.
Chen, H. X., Zhang, L. M., Gao, L., Zhu, H., and Zhang, S.: Presenting regional shallow landslide movement on three-dimensional digital terrain, Eng. Geol., 195, 122–134, https://doi.org/10.1016/j.enggeo.2015.05.027, 2015.
Chen, N. S., Zhou, W., Yang, C. L., Hu, G. S., Gao, Y. C., and Han, D.: The processes and mechanism of failure and debris flow initi-ation for gravel soil with different clay content, Geomorphology, 121, 222–230, https://doi.org/10.1016/j.geomorph.2010.04.017, 2010.
Chen, Z., Ma, L., Yu, S., Chen, S., Zhou, X., Sun, P., and Li, X.: Back analysis of the draining process of the Tangjiashan barrier lake, J. Hydraul. Eng., 141, 05014011, https://doi.org/10.1061/(ASCE)HY.1943-7900.0000965, 2015. Coe, J. A., Kinner, D. A., and Godt, J. W.: Initiation
con-ditions for debris flows generated by runoff at Chalk
Cliffs, central Colorado, Geomorphology, 96, 270–297,
https://doi.org/10.1016/j.geomorph.2007.03.017, 2008. Cui, P.: Study on condition and mechanisms of debris flow initiation
by means of experiment, Chinese Sci. Bull., 37, 759–763, 1992. De Luca, D. L. and Versace, P. A.: Comprehensive framework for empirical modeling of landslides induced by rainfall: the Generalized FLaIR Model (GFM), Landslides, 14, 1009–1030, https://doi.org/10.1007/s10346-016-0768-5, 2017a.
De Luca, D. L. and Versace, P.: Diversity of Rainfall Thresholds for early warning of hydro-geological disasters, Adv. Geosci., 44, 53–60, https://doi.org/10.5194/adgeo-44-53-2017, 2017b. Fletcher, C. A. J.: Computational Techniques for Fluid Dynamics,
vol. I, 2nd edn., Springer-Velag, New York, 1990.
FLO-2D Software Inc.: FLO-2D reference manual, Nutrioso, Ari-zona, USA, 2009.
Formetta, G., Mantilla, R., Franceschi, S., Antonello, A., and Rigon, R.: The JGrass-NewAge system for forecasting and managing the hydrological budgets at the basin scale: models of flow gener-ation and propaggener-ation/routing, Geosci. Model Dev., 4, 943–955, https://doi.org/10.5194/gmd-4-943-2011, 2011.
Gao, L., Zhang, L. M., Chen, H. X., and Shen, P.: Simulating de-bris flow mobility in urban settings, Eng. Geol., 214, 67–78, https://doi.org/10.1016/j.enggeo.2016.10.001, 2016.
Gao, L., Zhang, L. M., and Cheung, R. W. M.: Relationships be-tween natural terrain landslide magnitudes and triggering rain-fall based on a large landslide inventory in Hong Kong, Land-slides, 15, 727–740, https://doi.org/10.1007/s10346-017-0904-x, 2017a.
Gao, L., Zhang, L., and Lu, M.: Characterizing the spatial variations and correlations of large rainstorms for landslide study, Hydrol. Earth Syst. Sci., 21, 4573–4589, https://doi.org/10.5194/hess-21-4573-2017, 2017b.
Godt, J. W., Baum, R. L., and Chleborad, A. F.: Rainfall character-istics for shallow landsliding in Seattle, Washington, USA, Earth Surf. Proc. Land., 31, 97–110, https://doi.org/10.1002/esp.1237, 2006.
Graf, W. H.: Hydraulics of sediment transport, Water Resources Publications, Colorado, 1984.
Guzzetti, F., Peruccacci, S., Rossi, M., and Stark, C. P.: The rainfall intensity-duration control of shallow landslides and debris flows: An update, Landslides, 5, 3–17, https://doi.org/10.1007/s10346-007-0112-1, 2008.
Hanson, G. J. and Simon, A.: Erodibility of cohesive streambeds in the loess area of the midwestern USA, Hydrol. Process., 15, 23–38, https://doi.org/10.1002/hyp.149, 2001.
Hungr, O.: A model for the runout analysis of rapid flow slides, debris flows, and avalanches, Can. Geotech. J., 32, 610–623, https://doi.org/10.1139/t95-063, 1995.
Hungr, O. and McDougall, S.: Two numerical models for landslide dynamic analysis, Comput. Geosci., 35, 978–992, https://doi.org/10.1016/j.cageo.2007.12.003, 2009.
Iverson, R. M.: The physics of debris flows, Rev. Geophys., 35, 245–296, https://doi.org/10.1029/97RG00426, 1997.
Iverson, R. M., Reid, M. E., and LaHusen, R. G.: Debris-flow mo-bilization from landslides, Annu. Rev. Earth Pl. Sc., 25, 85–138, https://doi.org/10.1146/annurev.earth.25.1.85, 1997.
Iverson, R. M., Reid, M. E., Logan, M., LaHusen, R. G., Godt, J. W., and Griswold, J. P.: Positive feedback and momentum growth during debris-flow entrainment of wet bed sediment, Nat. Geosci., 4, 116–121, https://doi.org/10.1038/ngeo1040, 2011. Johnson, K. A. and Sitar, N.: Hydrologic conditions
lead-ing to debris-flow initiation, Can. Geotech. J., 27, 789–801, https://doi.org/10.1139/t90-092, 1990.
Julian, J. P. and Torres, R.: Hydraulic erosion of
co-hesive riverbanks, Geomorphology, 76, 193–206,
https://doi.org/10.1016/j.geomorph.2005.11.003, 2006. Kappes, M. S., Keiler, M., von Elverfeldt, K., and Glade, T.:
Chal-lenges of analyzing multi-hazard risk: a review, Nat. Hazards, 64, 1925–1958, https://doi.org/10.1007/s11069-012-0294-2, 2012. King, J. P.: Tsing Shan debris flow, Special Project Report SPR
6/96, Geotechnical Engineering Office, Hong Kong Government, 133 pp., 1996.
Kwan, J. S. and Sun, H.: An improved landslide mobility model, Can. Geotech. J., 43, 531–539, https://doi.org/10.1139/t06-010, 2006.
Liu, K. F. and Huang, M. C.: Numerical simulation of debris flow with application on hazard area mapping, Comput. Geosci., 10, 221–240, https://doi.org/10.1007/s10596-005-9020-4, 2006. Liu, N., Zhang, J. X., Lin, W., Cheng, W. Y., and Chen, Z. Y.:
Drain-ing Tangjiashan Barrier Lake after Wenchuan Earthquake and the flood propagation after the dam break, Sci. China Ser. E., 52, 801–809, https://doi.org/10.1007/s11431-009-0118-0, 2009. Marzocchi, W., Garcia-Aristizabal, A., Gasparini, P., Mastellone,
M. L., and Di Ruocco, A.: Basic principles of multi-risk as-sessment: a case study in Italy, Nat. Hazards, 62, 551–573, https://doi.org/10.1007/s11069-012-0092-x, 2012.
Medina, V., Hürlimann, M., and Bateman, A.: Application of FLAT-Model, a 2-D finite volume code, to debris flows in the north-eastern part of the Iberian Peninsula, Landslides, 5, 127–142, https://doi.org/10.1007/s10346-007-0102-3, 2008.
O’Brien, J. S. and Julien, P. Y.: Laboratory analysis of
mudflow properties, J. Hydraul. Eng., 114, 877–887,
https://doi.org/10.1061/(ASCE)0733-9429(1988)114:8(877), 1988.
O’Brien, J. S., Julien, P. Y., and Fullerton, W. T.: Two-dimensional water flood and mudflow simulation, J. Hy-draul. Eng., 119, 244–261, https://doi.org/10.1061/(ASCE)0733-9429(1993)119:2(244), 1993.
Ouyang, C., He, S., and Tang, C.: Numerical
analy-sis of dynamics of debris flow over erodible beds in Wenchuan earthquake-induced area, Eng. Geol., 194, 62– 72, https://doi.org/10.1016/j.enggeo.2014.07.012, 2015. Pastor, M., Haddad, B., Sorbino, G., Cuomo, S., and Drempetic, V.:
A depth-integrated, coupled SPH model for flow-like landslides and related phenomena, Int. J. Numer. Anal. Met., 33, 143–172, https://doi.org/10.1002/nag.705, 2009.
Peng, M. and Zhang, L.M.: Breaching parameters of landslide dams, Landslides, 9, 13–31, https://doi.org/10.1007/s10346-011-0271-y, 2012.
Pierson, T. C.: Hyperconcentrated flow - transitional process be-tween water flow and debris flow, in: Debris-flow hazards and re-lated phenomena, edited by: Jakob, M. and Hungr, O., Springer-Praxis, Chichester, UK, 159–202, https://doi.org/10.1007/3-540-27129-5_8, 2005.
Quan Luna, B., Blahut, J., van Asch, T., van Westen, C., and Kappes, M.: ASCHFLOW-A dynamic landslide run-out model for medium scale hazard analysis, Geoenvironmental Disasters, 3, 29, https://doi.org/10.1186/s40677-016-0064-7, 2016. Raia, S., Alvioli, M., Rossi, M., Baum, R. L., Godt, J.
W., and Guzzetti, F.: Improving predictive power of phys-ically based rainfall-induced shallow landslide models: a probabilistic approach, Geosci. Model Dev., 7, 495–514, https://doi.org/10.5194/gmd-7-495-2014, 2014.
Roberts, J., Jepsen, R., Gotthard, D., and Lick, W.: Effects of parti-cle size and bulk density on erosion of quartz partiparti-cles, J. Hydraul Eng., 124, 1261–1267, https://doi.org/10.1061/(ASCE)0733-9429(1998)124:12(1261), 1998.
Shen, P., Zhang, L. M., Chen, H. X., and Gao, L.: Role
of vegetation restoration in mitigating hillslope
ero-sion and debris flows, Eng. Geol., 216, 122–133,
https://doi.org/10.1016/j.enggeo.2016.11.019, 2017.
Srivastava, R. and Yeh, T. C. J.: Analytical solutions for one-dimensional, transient infiltration toward the water table in
ho-mogeneous and layered soils, Water Resour. Res., 27, 753–762, https://doi.org/10.1029/90WR02772, 1991.
Staley, D. M., Kean, J. W., Cannon, S. H., Schmidt, K.
M., and Laber, J. L.: Objective definition of rainfall
intensity–duration thresholds for the initiation of post-fire de-bris flows in southern California, Landslides, 10, 547–562, https://doi.org/10.1007/s10346-012-0341-9, 2013.
Takahashi, T.: Debris flow, Annu. Rev. Fluid Mech., 13, 57–77, 1981.
Takahashi, T.: Debris flow: mechanics, prediction and countermea-sures, Taylor & Francis, London, UK, 2007.
Takahashi, T., Nakagawa, H., Harada, T., and Yamashiki, Y.: Routing debris flows with particle segregation, J. Hydraul. Eng., 118, 1490–1507, https://doi.org/10.1061/(ASCE)0733-9429(1992)118:11(1490), 1992.
Tang, C., Rengers, N., van Asch, Th. W. J., Yang, Y. H., and Wang, G. F.: Triggering conditions and depositional characteristics of a disastrous debris flow event in Zhouqu city, Gansu Province, northwestern China, Nat. Hazards Earth Syst. Sci., 11, 2903– 2912, https://doi.org/10.5194/nhess-11-2903-2011, 2011. Van Den Eeckhaut, M., Vanwalleghem, T., Poesen, J., Govers, G.,
Verstraeten, G., and Vandekerckhove, L.: Prediction of landslide susceptibility using rare events logistic regression: a case-study in the Flemish Ardennes (Belgium), Geomorphology, 76, 392– 410, https://doi.org/10.1016/j.geomorph.2005.12.003, 2006. von Boetticher, A., Turowski, J. M., McArdell, B. W., Rickenmann,
D., and Kirchner, J. W.: DebrisInterMixing-2.3: a finite vol-ume solver for three-dimensional debris-flow simulations with two calibration parameters – Part 1: Model description, Geosci. Model Dev., 9, 2909–2923, https://doi.org/10.5194/gmd-9-2909-2016, 2016.
Wieczorek, G. F.: Effect of rainfall intensity and duration on de-bris flows in central Santa Cruz Mountains, California, Rev. Eng. Geol., 7, 93–104, https://doi.org/10.1130/REG7-p93, 1987. Wong, H. N.: Rising to the challenges of natural terrain landslides,
Natural Hillsides: Study and Risk Management Measures, Proc., 29th Annual Seminar of the HKIE Geotechnical Division, Hong Kong Institution of Engineers, Hong Kong, 15–53, 2009. Wu, L. Z., Selvadurai, A. P. S., Zhang, L. M., Huang,
R. Q., and Huang, J.: Poro-mechanical coupling influ-ences on potential for rainfall-induced shallow landslides in unsaturated soils, Adv. Water Resour., 98, 114–121, https://doi.org/10.1016/j.advwatres.2016.10.020, 2016. Xiao, T., Li, D. Q., Cao, Z. J., and Tang, X. S.: Full
prob-abilistic design of slopes in spatially variable soils using simplified reliability analysis method, Georisk, 11, 146–159, https://doi.org/10.1080/17499518.2016.1250279, 2017. Zhan, T. L., Jia, G. W., Chen, Y. M., Fredlund, D. G., and
Li, H.: An analytical solution for rainfall infiltration into an unsaturated infinite slope and its application to slope sta-bility analysis, Int. J. Numer. Anal. Met., 37, 1737–1760, https://doi.org/10.1002/nag.2106, 2013.
Zhang, L. L., Zhang, J., Zhang, L. M., and Tang, W. H.: Stabil-ity analysis of rainfall-induced slope failure: a review, P. I. Civil Eng.-Geotec., 164, 299–316, 2011.
Zhang, S. and Zhang, L. M.: Impact of the 2008 Wenchuan earthquake in China on subsequent long-term debris flow ac-tivities in the epicentral area, Geomorphology, 276, 86–103, https://doi.org/10.1016/j.geomorph.2016.10.009, 2017. Zhang, S., Zhang, L. M., Chen, H. X., Yuan, Q., and Pan,
H.: Changes in runout distances of debris flows over time in the Wenchuan Earthquake zone, J. Mt. Sci., 10, 281–292, https://doi.org/10.1007/s11629-012-2506-y, 2013.
Zhang, S., Zhang, L. M., Lacasse, S., and Nadim, F.: Evo-lution of mass movements near epicentre of Wenchuan earthquake, the first eight years, Sci. Rep-UK., 6, 36154, https://doi.org/10.1038/srep36154, 2016.
Zhou, W. and Tang, C.: Rainfall thresholds for debris flow initi-ation in the Wenchuan earthquake-stricken area, southwestern China, Landslides, 11, 877–887, https://doi.org/10.1007/s10346-013-0421-5, 2014.