Ann. Geophys., 28, 1183–1198, 2010 www.ann-geophys.net/28/1183/2010/ doi:10.5194/angeo-28-1183-2010
© Author(s) 2010. CC Attribution 3.0 License.
Annales
Geophysicae
Are there optical differences between storm-time substorms and
isolated substorms?
R. A. Hoffman1, J. W. Gjerloev2, L. A. Frank3, and J. W. Sigwarth1
1Heliophysics Science Division, NASA/Goddard Space Flight Center, Greenbelt, MD 20771, USA 2Applied Physics Laboratory, Johns Hopkins University, Laurel, MD 20723, 0771, USA
3The University of Iowa, Department of Physics and Astronomy, Iowa City, IO, 52242, USA
Received: 5 November 2009 – Revised: 25 March 2010 – Accepted: 17 May 2010 – Published: 28 May 2010
Abstract. We have performed an extensive analysis of au-roral optical events (substorms) that occurred during the de-velopment of the main phase of magnetic storms. Using im-ages from the Earth Camera on the Polar spacecraft (Frank et al., 1995), we compared the optical emission features of substorms occurring during 16 expansion phases of mag-netic storms with the features of isolated substorms occur-ring duoccur-ring non-storm times. The comparison used two tech-niques, visual inspection and statistical comparisons. The comparisons were based on the common characteristics seen in isolated substorms that were initially identified by Aka-sofu (1964) and quantified by Gjerloev et al. (2008). We find that when auroral activity does occur during main phase development the characteristics of the aurora are very dis-similar to those of the classical isolated substorm. The pri-mary differences include the lack of a surge/bulge, lack of bi-furcation of the aurora, much shorter expansion phases, and greater intensities.
Since a surge/bulge and bifurcation of the aurora are char-acteristics of the existence of a substorm current wedge, a key component of the magnetosphere-ionosphere current system during substorms, the lack of this component would indicate that the classical substorm model does not apply to the storm time magnetosphere-ionosphere current system. Rather sev-eral of the analyses suggest that the storm-time substorms are associated more closely with the auroral oval, at least spa-tially, and, therefore, probably with the plasma sheet dynam-ics during the main phase development. These results then must call into question the widely held assumption that there is no intrinsic difference between storm-time substorms and classical isolated substorms.
Correspondence to: J. W. Gjerloev ([email protected])
Keywords. Magnetospheric physics (Auroral phenomena; Magnetosphere-ionosphere interactions; Storms and sub-storms)
1 Introduction
Kan (2006) recently summarized the status of the issue of storm-substorm relationships in a report of the Storm-Substorm Relations Workshop in Banff, Albert, Canada. The consensus position seemed to accept the conclusion of Kamide (1992) that substorms are not a necessary condi-tion for the occurrence of a magnetic storm. This conclu-sion evolved over several decades of study from the original hypothesis by Chapman (1962) that “a magnetic storm con-sists of sporadic and intermittent polar disturbances” that “I call polar substorms”, which “appear also during rather quiet periods”.
which a significant amount of energy derived from the solar wind-magnetosphere interaction is deposited in the auroral ionosphere and magnetosphere” (Rostoker et al., 1980). This statement remains perhaps the most inclusive and generally accepted description of the term substorm and we adopt it for this analysis.
While the existence of multiple substorms is no longer considered a necessary condition for the development of magnetic storms (e.g., Kamide, 1992; McPherron, 1997), their role in magnetic storms is still not clear. One thought is that transient electric fields associated with substorms may help trap plasma carried from the tail into the ring current by the global electric field, which in a static field would drift out the dayside magnetopause (McPherron, 1997). This type of concept must assume that the magnetospheric electrodynam-ics of the substorm occurring during the main phase develop-ment of the magnetic storms are comparable to those of iso-lated substorms (Kamide, 1992), since it is the electrodynam-ics of the isolated substorm that has received primary study. In fact, Kamide (1992) stated explicitly that: “There is no intrinsic difference between storm time substorms and usual substorms”, a concept repeated by Gonzalez et al. (1994) in a review paper on magnetic storms.
In the ionosphere/thermosphere region the isolated sub-storm shows specific characteristics, not only in the optical emission patterns, but also in the patterns of the conductiv-ities, electric field, ionospheric currents, and field-aligned currents (e.g., Kan et al., 1991; Fujii et al., 1994; Kamide et al., 1996; Gjerloev and Hoffman, 2000, 2002). How-ever, to our knowledge, the comparability of the electrody-namics of isolated substorms and storm-time substorms has never been observationally proven. In fact, when Baumjo-hann et al. (1996) compared tail magnetic signatures during isolated substorms and storm-time “substorms” they found considerable differences. While they raised the question whether there are two types of substorms, they suggested that they could have different physical processes in the magneto-sphere, but yet could still show the same aurora and elec-trodynamics in the ionosphere. The dubious basis for the conclusion that the two types of events have no apparent dif-ferences in the ionosphere suggests that additional investiga-tions on the commonality of the electrodynamics might be of value. We argue that if we find an electrodynamic param-eter during storm-time events that has different characteris-tics than during isolated events, it would not be appropriate to assume that the remaining electrodynamic characteristics are the same as the electrodynamic characteristics of isolated substorms.
To initiate an investigation of this assumption of common-ality, we initially take a perspective of the substorm-storm relationship based solely on optical observations. We will compare the optical signatures of substorms that occurred during the development of the main phase magnetic storm with the optical signatures of the isolated substorm as defined by Akasofu (1964) and subsequently observed and quantified
by global auroral images (Fujii et al., 1994; Gjerloev et al., 2007). Two types of comparative analyses will be performed, a detailed visual comparison and a statistical comparison. Gjerloev et al. (2007) found that the Akasofu-type substorm is by far the predominant type of large-scale isolated auroral event during non-magnetic storm periods. After excluding pseudo-breakups and pressure pulse auroras, their analysis found 116 substorms after having to discard only about 20 additional events that did not display the classical character-istics. While these latter events would also be classified as substorms under the currently accepted definition (Rostoker et al., 1980), we will use the term “isolated substorm” to refer to the 116 events that displayed the Akasofu-type character-istics. However, in spite of the fact that the optical signatures of these 116 events had large variations in their locations and temporal development, Gjerloev et al. (2007) found that the auroral emission patterns of the individual substorms could be normalized temporally and spatially to an average sub-storm pattern with surprisingly high correlation coefficients. We do point out that this approach is a partial perspec-tive of whether the electrodynamics of the isolated substorm also pertains to the substorms during the storm main phase, since global auroral images only provide indications of the locations of electron (and proton) precipitation and the re-sulting patterns of ionospheric conductivity (Germany et al., 1994). However, we showed that this normalization success enabled the development of normalized patterns of the con-vection electric field and field-aligned currents for the iso-lated substorms (Fujii et al., 1994; Gjerloev and Hoffman, 2001, 2002).
We emphasize that this analysis does not use any ground magnetic data to identify storm-time auroral events. Only Sym-H is used to mark the onset time of the main phase storm and the time of minimum in Sym-H, providing the time periods of our study, so accuracy issues of the ring current parameters are of no consequence (Ohtani et al., 2005).
2 Data from storm-times
R. A. Hoffman et al.: Optical differences between storm-time substorms and isolated substorms 1185
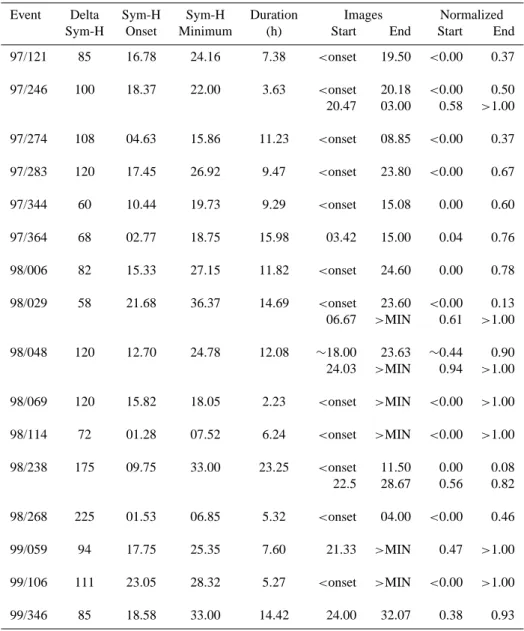
Table 1. Coverage by global auroral images of main phase development for 16 storms. Times are in decimal hours.
Event Delta Sym-H Sym-H Duration Images Normalized Sym-H Onset Minimum (h) Start End Start End
97/121 85 16.78 24.16 7.38 <onset 19.50 <0.00 0.37 97/246 100 18.37 22.00 3.63 <onset 20.18 <0.00 0.50 20.47 03.00 0.58 >1.00
97/274 108 04.63 15.86 11.23 <onset 08.85 <0.00 0.37
97/283 120 17.45 26.92 9.47 <onset 23.80 <0.00 0.67 97/344 60 10.44 19.73 9.29 <onset 15.08 0.00 0.60
97/364 68 02.77 18.75 15.98 03.42 15.00 0.04 0.76
98/006 82 15.33 27.15 11.82 <onset 24.60 0.00 0.78
98/029 58 21.68 36.37 14.69 <onset 23.60 <0.00 0.13 06.67 >MIN 0.61 >1.00 98/048 120 12.70 24.78 12.08 ∼18.00 23.63 ∼0.44 0.90 24.03 >MIN 0.94 >1.00
98/069 120 15.82 18.05 2.23 <onset >MIN <0.00 >1.00
98/114 72 01.28 07.52 6.24 <onset >MIN <0.00 >1.00 98/238 175 09.75 33.00 23.25 <onset 11.50 0.00 0.08 22.5 28.67 0.56 0.82
98/268 225 01.53 06.85 5.32 <onset 04.00 <0.00 0.46
99/059 94 17.75 25.35 7.60 21.33 >MIN 0.47 >1.00
99/106 111 23.05 28.32 5.27 <onset >MIN <0.00 >1.00 99/346 85 18.58 33.00 14.42 24.00 32.07 0.38 0.93
the visible images were limited in spatial extent, they had seven times the spatial resolution, making them valuable for verifying the interpretation of the EC images. Unfortunately, the various VIS cameras had to share the same telemetry al-location, so the EC temporal resolution decreased from one image per minute to about one every five minutes when the visible cameras were active. To recover the higher time res-olution, especially to obtain the onset times of events and to assure continuity in development, we supplemented the VIS data with images from the Ultraviolet Imaging system (UVI) (Torr et al., 1995). For our analysis we preferred to use the VIS data over the UVI data because of its global coverage and increased spatial accuracy. Due to an imbal-ance of the Polar spacecraft apparently resulting from an
in-complete erection of one of the spacecraft masts following launch, the spacecraft attained a slight wobble, which sig-nificantly smeared the acquisition of the optical data in one direction. The VIS data acquisition scheme was able to be modified in flight to eliminate most of this smearing (Frank and Sigwarth, 1997).
Figure 1
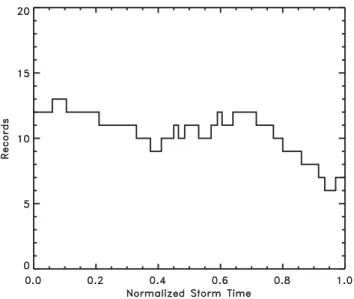
Fig. 1. Number of magnetic storms with auroral imaging as afunc-tion of normalized time during storm main-phase development, with
T=0 when Sym-H begins to decrease toT=1 at Sym-H minimum.
determinations and not spatial locations, any impacts of the differences in the data sets were minimized.
Sixteen magnetic storms during 1997 through 1999 were selected for inclusion in this study (Table 1). Criteria for selection included Sym-H minimum of at least−50 nT, a de-crease in Sym-H from onset without considerable recovery before reaching its minimum, and a single Sym-H minimum or an end to the period of study at the first minimum. Our set of storms contained many selected by Wu et al. (2004) in their study of “substorms” within storms, though their size criterion was Dst<30 nT, were associated only with mag-netic clouds, and included the storm recovery phase. We did not use the storm shown as their example (their Figs. 1 and 3) because of the near recovery of Sym-H part way through the event. Most of the storms used in this study had a main phase between−60 and−120 nT, with two considerably larger at 175 and one at 225 nT. Main phase development times ranged from 2.25 h to nearly an entire day.
For some of the statistical analyses of this study it is impor-tant that coverage of the main phase development by auroral imaging be relatively uniform from onset to Sym-H min and with a sufficient number of events to draw generalized con-clusions. Coverage from the 16 storms can be tested by nor-malizing storm timeT for each storm between 0 and 1 from onset to Sym-H min. and counting the number of storms hav-ing auroral coverage as a function ofT. Coverage for each storm is listed in Table 1 with the sum as a function of time T shown in Fig. 1. Time from onsetT=0 toT=almost 0.8 has 10 storms or more, but falls off to seven towards Sym-H min, still an adequate number for our purposes.
3 Storm-time substorm selection
The selection of an auroral optical event to be included in this study, or substorm per the Rostoker et al. (1980) definition, was based only on its optical characteristics that could be identified in the EC images:
– Onset during the expansion phase of a selected magnetic storm;
– An onset distinguishable from any existing auroras, but not necessarily localized (“point source”), as we re-quired for isolated substorms (Gjerloev et al., 2008); – Expansion in area;
– Brightening of the aurora during expansion; – Maximum in area/intensity;
– Decay in intensity (but our analysis ends at the maxi-mum);
– At least the expanded region in darkness, and preferably most of the oval;
– A new event distinguished from an ongoing event if the two are clearly separated in magnetic local time, allow-ing two events to overlap in time.
We did not establish any quantitative threshold for the storm-time substorms, so we may not be totally self-consistent in the inclusion of smaller events. There were many weak and short-lived optical brightenings during the magnetic storm main phases that are not included. Since small, short events are not comparable temporally to isolated substorms, their neglect is not pertinent to our analyses. If a re-brightening leading to a new maximum occurred in the same MLT re-gion as a maximum, provided there was not a considerable decay, the two brightenings were considered a single event. We identified 54 events that had acceptable image coverage during the portions of the 16 storms.
From the images of a substorm, we determined the on-set time and the maximum time. If onon-set appeared to be localized (see Gjerloev et al., 2008, for examples), we mea-sured the MLT and invariant latitude of the center of the area. While we record the values to the nearest tenth of an hour in MLT and 0.5◦ in ILat the accuracies highly depend on the
R. A. Hoffman et al.: Optical differences between storm-time substorms and isolated substorms 1187
Figure 2
Straight Line Straight Line
Oval Aurora Oval Aurora Bifurcation
Surge Head Surge Head
Substorm Bulge Substorm Bulge
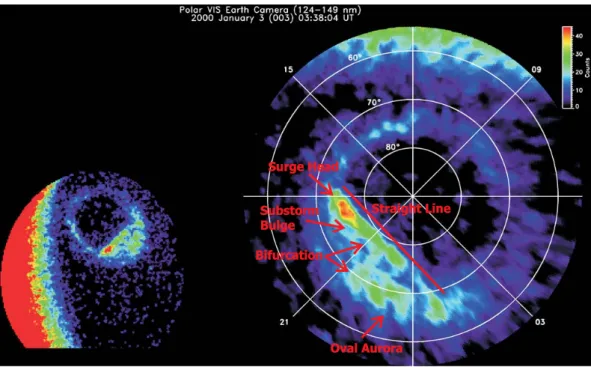
Fig. 2. A good example of an isolated classical auroral substorm event at the maximum of the expansion phase (from Gjerloev et al., 2007,
Fig. 1), the original image on the left and a mapping to a magnetic local time (MLT), invariant latitude (ILat) coordinate system on the right. Key characteristics are labeled. Onset location was 69.0◦ILat and 21.6 MLT at 03:09 UT.
The accuracy to which we can select these positions de-pends, of course, on the gradients in the emissions. We gen-erally used as the boundary the transition from the purple to the medium blue color seen, for example, as a lining along the eastern edge of the brightening that ends around 1.5 MLT in Fig. 3f. Viewing the sequence of images helps define these positions, especially the end points. The selections are suffi-ciently accurate for the purpose of the analysis.
4 Comparisons
Two comparative techniques were employed to determine whether substorms occurring during magnetic storm main phases had common characteristics with isolated substorms, a visual comparison and a statistical comparison.
4.1 Visual comparisons
We first identify the optical characteristics of the isolated substorm that will be used for comparison. To illustrate we show a good example of an isolated substorm in Fig. 2 (from Gjerloev et al., 2007, Fig. 1). The characteristics are based on the commonalities identified by Akasofu (1964) and quanti-fied by Gjerloev et al. (2008). They include the following:
– An emission region (bulge) that arose in latitude out of the auroral oval
– Bifurcation, separating the bulge aurora from the oval aurora
– A surge head
– Oval aurora offset to the east in MLT from the bulge aurora
– A straight-line poleward boundary (seen best in original image), resulting in the highest latitude of the aurora near its center in MLT (caused by the bulge)
In performing our analysis we immediately realized that the substorms that occurred during the expansion phases of mag-netic storms displayed a large gamut of characteristics unlike those found in the isolated bulge-type auroral substorm. As a result, for our visual comparisons we show the types of optical signatures encountered and identify how they are dif-ferent from the characteristics of the isolated substorm.
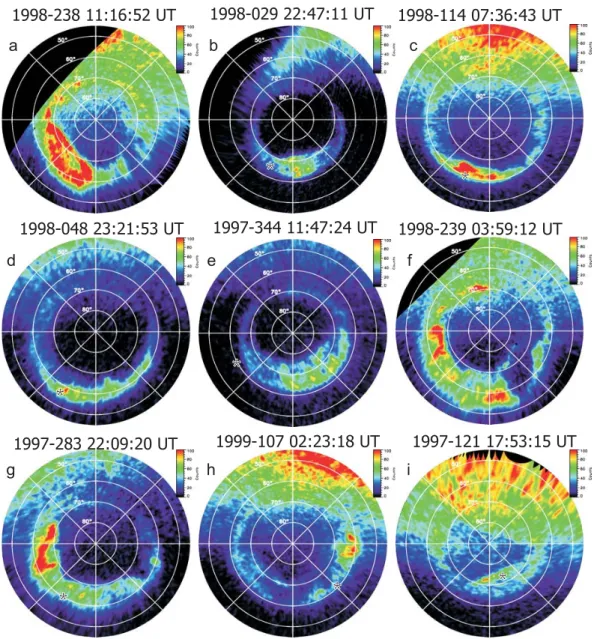
All the following examples of events during the main phase development are taken at the maximum of each event. The first example, Fig. 3a, is a classical-looking bulge-type substorm that expanded poleward out of the auroral oval (on-set was in a short data gap but likely located at an ILat of about 62◦, somewhat after 21:00 MLT). It is characterized by
1997-121 17:53:15 UT
*
1999-107 02:23:18 UT
*
1998-239 03:59:12 UT
1997-344 11:47:24 UT
1998-048 23:21:53 UT
*
1998-114 07:36:43 UT
*
1998-029 22:47:11 UT
*
Figure 3
1998-238 11:16:52 UT
*
1997-283 22:09:20 UT
*
a
b
c
d
e
f
g
h
i
Fig. 3. Examples of auroral events during magnetic storm main phase development. All the images have the same color scale, 0 to 100
counts per pixel. The images have been transformed to a MLT, ILat map with the sun at the top. The onset location, if local, is marked by an asterisk. (a) Best example of a classical bulge-type substorm; (b) an auroral oval brightening of very limited local time extent; (c) a more common auroral oval brightening; (d) a very distributed oval brightening, almost 9 h in length at very low latitudes; (e) a large event with a very high latitude boundary; (f) a huge event both in local time and latitude coverage; (g) a dusk-side event; (h) a dawn side event; (i) a polar arc brightening.
events in this study, only 12 (22%) allowed the measure of the surge/bulge positions compared to 85% for isolated sub-storms. Many of these events did not develop out of a local-ized onset like an isolated substorm, but eventually evolved to show a bulge whose ends could be identified. Of the twelve, only seven (13%) could be considered to have the characteristics of the isolated substorm for various reasons.
The next three images are examples of the most common type of event during a main-phase development, the bright-ened auroral oval, which makes up about 70% of the events. The event shown in Fig. 3b is minimal in extent, like three
R. A. Hoffman et al.: Optical differences between storm-time substorms and isolated substorms 1189
Figure 4a
Figure 4b
Figure 4c
Fig. 4a. Locations in MLT/ILat coordinates of onsets for
storm-time substorms having localized onsets.
type of event usually developed out of a very quiet and fairly narrow oval. Note the exceptionally low latitude location of the onset, with most of the ensuing pre-midnight aurora below 60◦ILat. It shows none of the characteristics of the bulge-type substorm. These three examples of the brightened oval aurora type of substorm do not show a development of a surge/bulge that rises in latitude out of the auroral oval and thus do not display any bifurcation or any other characteristic of the isolated substorm.
Next we show an event with an exceptionally high latitude boundary, extending to about 77◦ILat, but with a vague high-latitude cut-off (Fig. 3e). It is composed of several rather north-south structures with weak emissions to the west but lacks the continuous high latitude boundary of a bulge. In to-tal, the brightenings extend almost 12 h in local time. This is the most extensive example of this type of aurora. The next example is a huge event, both in local time and latitude ex-tent (Fig. 3f). The brightenings extend from about 1.5 MLT, the east end, through dusk to noon, and from 50◦to 70◦ in latitude near midnight. Note that neither of these large events shows any of the characteristics of an isolated substorm.
Occasionally substorm emissions expanded and rapidly drifted to the west or east well past their onset MLT (9%). An intense dusk substorm appears in Fig. 3g with expansion well past 18:00 MLT towards noon. In following the develop-ment of this event one could argue that multiple brightenings occurred with the last near dusk at the maximum of the event. In contrast the west, trailing end of the dawn event in Fig. 3h drifted entirely past the onset spot by three hours. Again, in neither type of substorm did the aurora bifurcate.
A rare event that appears something like a classical sub-storm at its maximum, because it contains an apparent surge
Figure 4a
Figure 4b
Figure 4c
Fig. 4b. Histogram of onset locations as a function of MLT.
Super-imposed is a similar histogram for isolated substorms (from Gjer-loev et al., 2007).
Figure 4a
Figure 4b
Figure 4c
Fig. 4c. Histogram of onset locations as a function of ILat.
Super-imposed is a similar histogram for isolated substorms (from Gjer-loev et al., 2007).
head and a straight poleward boundary, is shown in the final figure (Fig. 3i). However, note that the onset point was at 72◦ILat, whereas all the other onsets were below 65◦. Fur-ther, the aurora in the oval latitude region faded as the polar boundary aurora brightened. This was merely a brightening of a polar boundary arc.
Figure 5a
Figure 6
Figure 5b
*
*
Fig. 5a. ILat locations of localized onsets as a function of
normal-ized storm time. Asterisk indicates the average onset location for isolated substorms.
4.2 Statistical comparisons
From the measurements made on the spatial characteristics of each substorm selected during magnetic storm main phases we performed statistical comparisons with the characteris-tics of isolated substorms (Gjerloev et al., 2007). Compar-isons could be made for onset locations, time of the expan-sion phase, and spatial expanexpan-sions both in local time and lat-itude. Comparisons are made both between the distributions of these parameters and their median values.
4.2.1 Onset plots
We initially compare the distributions of locations of the on-set (if localized onon-set) with distributions for isolated sub-storms. Forty-four of the 54 events (about 80%) were consid-ered to have localized onsets. First we plot the locations in ILat as a function of MLT (Fig. 4a) for storm events. The data show considerable scatter with no apparent relationship. The histograms of the distributions in MLT and ILat are shown in Fig. 4b and c with similar histograms superposed for isolated substorms (dotted). Neither of the storm event distributions could be meaningfully fit with a Gaussian distribution as we did for the isolated substorms (Gjerloev et al., 2007). The median of the MLT distribution for storm-time substorms is about an hour later than for isolated substorms, 23.5 MLT compared to 22.4 MLT. The distribution is somewhat sym-metric around midnight and very broad (±4 h MLT) in com-parison to the distribution for isolated substorms, which is almost entirely prior to midnight and covers only about 4 h in total in MLT. The entire distribution is shifted considerably to lower latitudes, extending from 55.5◦to 71◦, with a median of 62.5◦, over three degrees lower. Since it is well known
Figure 5a
Figure 6
Figure 5b
*
*
Fig. 5b. ILat locations of localized onsets as a function of
Sym-H at the time of event onset. Asterisk indicates the average onset location for isolated substorms.
that the auroral oval moves equatorward as the storm devel-ops (Feldstein and Starkov, 1967; Sheehan and Carovillano, 1978; Tverskaya et al., 1989), we next investigated whether a shift in onset latitudes also occurred, first by plotting the ILat of onset as a function of normalized storm time (Fig. 5a). In spite of the large scatter in points, there appears to be some trend towards lower latitude, with most of the shift after T=0.5. However, if the onset latitude is plotted as a function of Sym-H at the time of the substorm onset (Fig. 5b), there is quite a clear trend towards lower latitudes as a function of ring current strength.
All onsets occurred within the pre-event oval. Nearly half of the onsets occurred when the background auroral oval was quiet and weak, and nearly half when there was some type of activity, ranging from bright, small blobs, a narrow, bright oval (arc as seen in the visible imager) to a long existing, fat, active oval. The remaining few events occurred during the decay of a previous event or arose at another MLT from the ongoing event.
4.2.2 Development from onset to maximum
The time for development from onset to maximum is next plotted in Fig. 6 as a histogram and superposed on the de-velopment time for isolated substorms (from Gjerloev et al., 2007, Fig. 4). The differences in both the distribution and median development time are striking, the latter being only 15 min, half that for isolated substorms (see Table 2). Note that the lowest bar of the histogram is comparable to the tem-poral resolution of the images and thus the ability to track the development of an event.
R. A. Hoffman et al.: Optical differences between storm-time substorms and isolated substorms 1191
Figure 5a
Figure 6
Figure 5b
*
*
Fig. 6. Histogram of the length of expansion phases for auroral
events during the development of the magnetic storm main phase (solid lines). Superimposed as dotted lines is a histogram for ex-pansion phases for isolated substorms (from Gjerloev et al., 2007).
to the time of Sym-H minimum (Fig. 7a), and likewise find that most onsets occurred within the 10 h prior to Sym-H minimum. (They used Dst min. and binned in 10-h inter-vals.) The results of Wu et al. would be expected irrespec-tive of any relationship between substorms and time into a main phase development, since short developing main phases would have all their substorms much closer to Dst minimum than long developing storms. Half of our main phase de-velopment times were less than 10 h. However, when we plot in Fig. 7b the onset times as a function of normalized storm time, and also normalized to the storm-time coverage (Fig. 1), we no longer observe this relationship. Instead we find a curious cluster of onsets within 0.20 normalized time after the onset of the Sym-H decrease followed by a com-plete lack of events for the next 0.10. A detailed look at this initial cluster of events shows that no event had its onset si-multaneous with the onset of Sym-H decrease, but the cluster occurred between 0.03 to 0.14 in normalized time, with no further event until 0.32. Further investigations of this curious phenomenon, if statistically real, are beyond the scope of this report.
4.2.3 Expansion characteristics
Next we evaluate the expansion of the substorms from onset to the maximum of the events, measuring the MLT expan-sions (1MLT) west and east from onset and the expansions in ILat (1ILat). We don’t evaluate the absolute values of these expansion locations because of the large variation in the onset locations (Fig. 4a). We then compare the expansion characteristics with those obtained from isolated substorms (Gjerloev et al., 2007). While such comparisons may not
Figure 7a
Figure 7b
Fig. 7a. Histogram of the number of substorm onsets during main
phase development relative to the time of Sym-H minimum (1UT) (after Wu et al., 2004, Fig. 4).
Figure 7a
Figure 7b
Fig. 7b. Histogram of the number of substorm onsets during main
phase development as a function of normalized storm time.
all be quantitatively appropriate because of the differences in the gross features of the two sets of events, they do help re-veal the differences of auroral activity under the two different conditions.
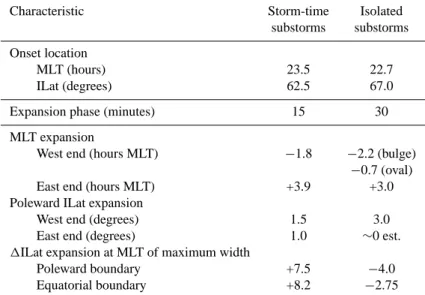
Table 2. Median parameters comparing substorms during main phase development with isolated substorms.
Characteristic Storm-time Isolated substorms substorms
Onset location
MLT (hours) 23.5 22.7
ILat (degrees) 62.5 67.0
Expansion phase (minutes) 15 30
MLT expansion
West end (hours MLT) −1.8 −2.2 (bulge)
−0.7 (oval) East end (hours MLT) +3.9 +3.0 Poleward ILat expansion
West end (degrees) 1.5 3.0
East end (degrees) 1.0 ∼0 est.
1ILat expansion at MLT of maximum width
Poleward boundary +7.5 −4.0 Equatorial boundary +8.2 −2.75
Figure 8
Fig. 8. Histogram of the number of substorms as a function of expansion from a localized onset to the maximum expansion in1MLT, westward expansion on the left, eastward expansion on the right. Superimposed are similar histograms for isolated substorms (dotted lines), the west end of the bulge, or surge head (left), and the east end of the oval aurora (right) (from Gjerloev et al., 2007).
distribution, though their median (−2.5 h) was slightly larger (not shown). The distribution has several events with large westward expansions. These are the dusk events, an example of which appears as Fig. 3g. During isolated substorms, the western-most expansion was the west end of the surge/bulge region, whose distributions are also shown in Fig. 8 (left) (from Fig. 9, Gjerloev et al., 2007). The median expan-sion was−2.2 h MLT, larger in MLT than the median for all the events during storm development (−1.8 h) in spite of not having comparable “dusk events”. On the other hand, the western end of the oval aurora during isolate substorms (see Fig. 10, Gjerloev et al., 2007), which was almost always
less than the western end of the bulge, showed a median ex-pansion of only−0.7 h MLT west, considerably less than the typical expansion of the storm-time substorms. Thus we find that the westward expansions of storm-time substorms are typically different than the expansion of isolated substorms, much larger than the oval aurora, but smaller than the bulge aurora. We list the median values in Table 2.
Figure 8 (right) contains the eastward expansions for all the events that expanded from a localized onset. The mag-nitudes of the eastward expansions were typically about twice as large as the westward expansions, with a median of 3.9 h. The few bulge-type events showed considerably
R. A. Hoffman et al.: Optical differences between storm-time substorms and isolated substorms 1193
Figure 8
Figure 9
Fig. 9. Histogram of the number of substorms as a function of expansion from a localized onset in1ILat, at the west extremity of the auroral events (left) and at the east extremity (right). Superimposed are similar histograms (dotted lines) for isolated substorms, the west end of the surge head (left) and the east end of the bulge (right) (from Gjerloev et al., 2007).
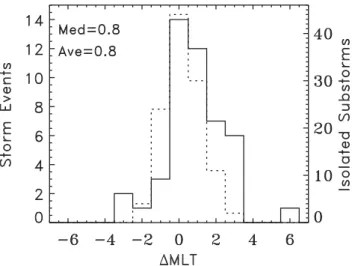
Figure 10
Fig. 10. Histograms of the differences in MLTs of the maximum
expansions compared with the MLTs of onsets for the storm-time substorms (solid lines) and for the isolated substorms (dotted lines).
less expansion (not shown). This eastward expansion of the storm-time substorms was typically an oval expansion, more like the eastward expansion of the oval aurora during iso-lated substorms. When we compare in Fig. 8 (right) these eastward oval expansions we find the medians for storm-time substorms to be almost an hour of MLT further east, 3.9 vs. 3.0 h. On the other hand, the expansion of the east end of the bulge for isolate substorms was considerably smaller, 2.5 h MLT (not shown), even smaller than the few bulge-type events during storm main phase development (3.0 h MLT).
These comparisons of the end locations of the oval auro-ras in1MLT from the onset locations give an impression that besides an overall expansion from the onset region there is superposed typically a larger eastward drift of the
precip-itation region during the main-phase substorms than during isolated substorms. This is especially noteworthy consider-ing that the expansion times are typically much shorter for storm-time substorms (see Table 2 for summary of expan-sions).
Similarly, in Fig. 9 (left), we plot the poleward expan-sion (1ILat) at the west end of substorms during storm de-velopment. The distribution is very broad, with a consid-erable number showing equatorward motions (negative val-ues). The few quasi bulge-type events generally showed a large poleward expansion. In contrast, expansion of the west end of the isolated substorms (superimposed in Fig. 9) was never equatorward, and the median was twice as large (Ta-ble 2). This quantitatively confirms our visual inspection of the images that the storm-time substorms do not show the rise of a surge out of the oval aurora. Thus the apparent rise of the surge/bulge out of the oval aurora is due to two factors, an actual rise in latitude and a MLT separation of the surge to the west of the oval aurora. Note that this MLT separation could never be observed in any of the oval expansion events (Fig. 3b–d), the dominant type of storm-time event, because it would require a bifurcation of the event.
Figure 11
Fig. 11. Expansion of storm-time substorms at the MLT of maximum width with isolated events superposed (dotted lines), equatorward on
the left, poleward on the right.
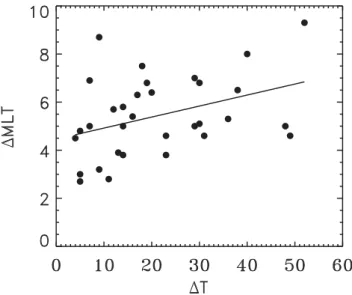
Figure 12
Fig. 12. Length in MLT of the type of substorms illustrated by the
images labeled b, c and d in Fig. 3 as a function of development time for the substorm. Straight line is a least squares fit.
Finally we compare the1ILat expansions of the emissions for those substorms with localized onsets to give a measure of the latitude extent of expansion and another comparison with the expansion of isolated substorms. We must first ask where to make this measurement, since we note in the exam-ples in Fig. 3 that the maximum expansion is not necessar-ily near the MLT of the onset. While Gjerloev et al. (2007) noted that the maximum expansion for isolated substorms was close to the onset MLT, we cannot assume that storm-time substorms have this characteristic. Figure 10 contains a histogram of the differences in MLTs of the maximum expan-sions compared with the MLTs of onsets for the storm-time substorms. We should point out that selecting the MLT of the maximum expansion cannot be done very accurately, but we
are just looking for statistical trends. While there is a clus-tering of points around1MLT=0, there are many scattered in the positive (eastward) direction, up to 3 h. The median change is about 0.4 h. This would indicate that we should make the latitude expansion measurements at the MLT of the maximum width of the expanded emissions rather than at the onset MLT. For comparison we also show in Fig. 10 a histogram for the same measurement for isolated events. The distribution is fairly symmetric around 0 h with a me-dian of about 0.1, confirming the observation of Gjerloev et al. (2007). For storm-time substorms about 50% of the locations of maximum expansion were within 1 h of onset whereas about 70% of the isolated substorms were so clus-tered. This measurement complements those of the expan-sion measurements of the west and east ends of the expanded emission regions discussed above, again indicating a trend for an apparent eastward drift of the region of emissions com-pared to isolated substorms.
Figure 11 (left) contains a histogram of the equatorward expansions of the emissions from the ILat of onset at the lo-cation of maximum width for storm-time events. The median expansion is shown in Table 2. The superposed histogram for isolated events shows a smaller expansion, with the median listed in Table 2. Similarly Fig. 11 (right) contains the same types of data for the poleward expansions with the medians shown in Table 2. We find that the poleward expansion at the maximum width is larger for isolated substorms, but the equatorward expansion is larger for storm-time substorms, with storm-time events showing a slightly larger total ex-pansion. The poleward expansion is about twice the amount as the equatorial expansion for storm-time events, but three times the amount for isolated events.
R. A. Hoffman et al.: Optical differences between storm-time substorms and isolated substorms 1195 than the isolated substorms, keeping the expansion closer to
the original auroral oval. The larger poleward expansion of the isolated substorms gives them their bulge shape and the rather straight poleward boundary seen in the images. The inability of the isolated substorms to expand much equator-ward results in the total latitude expansions for the two types of substorms to be about the same.
In summary, we have compared the expansion characteris-tics of the extremities of the substorms emission regions and of the centers in1MLT and1ILat of storm-time substorms with isolated substorms. In all cases these comparisons in-dicate that the storm-time substorms show the characteristics of an expanding auroral oval rather than the rising of a bulge out of the auroral oval.
5 Discussion
5.1 Selection of events
The selection of substorms during the development of the magnetic storm main phase was more difficult than the se-lection of isolated substorms. For the isolated substorm study we used only bulge-type events, discarding any that did not have the characteristics of the classical Akasofu-type (1964) event. That study had 116 substorms, with about 20 other events discarded that did not display the classical character-istics. We encountered very few events that were uncertain to include because of their weak intensity. Thus the clas-sical auroral substorm was by far the predominant isolated auroral event during non-magnetic storm periods, which jus-tifies using that type of auroral display for comparison with storm-time substorms. As in this study, other events were also discarded due to contaminating sunlight or poor aspect. We tried to keep the selection criteria as consistent with the isolated substorms criteria as possible (see Gjerloev et al., 2007, for discussion). However, we did not eliminate any particular auroral emission form like we did for the isolated substorms, since there was no particular form with a high percentage of occurrences. As mentioned in the Selection of Events, we did not include the many weak and short-lived optical brightenings during the magnetic storm main phases that we found.
We have also evaluated the impact of the color scales used in the images. A noticeable difference between isolated and storm-time events is the typical intensity. The survey im-ages we used contained a color scale to 45 counts/pixel for the isolated substorms, but 100 counts/pixel for the storm-time events. This factor of two increase indicates that the storm-time events were roughly twice as bright as the iso-lated events, since the measured brightness in kR of the au-rora within the wavelength interval of measurement is lin-ear with the count rate. Even then, a few saturated the im-ages, requiring an even larger scale to evaluate the structure of the event. To verify that we were not missing a type of
event not categorized in Fig. 3 because of its lower intensi-ties, we changed the counts/pixel scale to 50 for one storm. We found one clear additional event that started with a local onset, expanded in four to five minutes, and decayed. It did not contain a surge, bifurcate, or display a straight poleward boundary as for isolated substorms. It would be categorized as a “blob” (see Fig. 3b). Thus we conclude that the typical auroral event during storm main phase development is over twice as bright as isolated substorms.
The study by Lui et al. (2000) gives credence to our ap-proach of ignoring small events. They obtained the probabil-ity distribution in spatial size and power of the auroral out-put from the magnetosphere system for all scale sizes, from 103to almost 107sq. km, separated into quiet time and sub-storm time intervals. They found a power law in the proba-bility distribution during quiet times, but the power law for substorm times (including one magnetic storm) held only to about 5×10⁴sq. km, followed by a broad maximum (and peak in the dissipation power) to their largest events. They interpreted the power law distributed events as bursty, in-ternal (localized) relaxations of the systems, consistent with simple avalanche (sandpile) models of the system, whereas the large events were interpreted as global reconfigurations. Our small events, such as shown in Fig. 3b, contained an area of about 106sq. km, and the statistics of isolated sub-storms (Gjerloev et al., 2007, Figs. 11–13) also indicate at least this size range. Thus our events, both isolated substorms and main phase substorms, lie well into their class of global reconfigurations. While small events that we did not include may also have been of the types involving global reconfig-uration, the only impact of not including them would be in our statistics of expansion, where the expansion times and spatial extent may be missing events at the lower ends of the distributions (Figs. 6, 8, 9 and 11).
Of the 12 substorms that did allow the measurement of the west and east ends of a possible surge/bulge, only two had all the primary characteristics of the isolated substorm (compare Fig. 3a with Fig. 2). Four did not expand from a spot, six did not show a brightened surge head, four did not bifurcate and four did not show a straight poleward boundary, indicative of a lack of a bulge that expands the poleward boundary near the middle of the event. Thus, considering all 54 events, we can conclude that seldom do the optical features of auroral brightenings during the development of the main phase of a magnetic storm show the characteristics of an isolated sub-storm.
in the distributions, which were adequate indicators of the behavior of the emission regions.
5.2 Interpretation of the measurements
We have found that the optical emissions during storm-time substorms do not display the same types of characteristics as seen during isolated substorms. The differences include:
1. onsets at considerably lower latitudes; 2. onsets at later local times;
3. much shorter expansion phases; 4. greater intensities by a factor of two; 5. lack of a surge/bulge;
6. lack of bifurcation;
7. seldom a straight poleward boundary;
8. smaller poleward expansion but larger equatorward ex-pansion;
9. indications of an eastward drift of the expanding emis-sion region;
10. larger variation in shapes and sizes in contrast to the classical auroral substorm.
1 and 2: The first two items could be attributed to a more dis-torted magnetospheric topology during storm development due to the strengthening of the ring current and the convec-tion electric field than during isolated substorms. The onset latitudes show a displacement equatorward of about 0.1◦per
nT for a Sym-H decrease from 0 to−120 nT, where Sym-H was measured at time of substorm onset (Fig. 5b). This is almost three times the rate of decrease in latitude of the cen-ter of the westward electrojet current as a function of Dst as reported by Feldstein et al. (1997). The three largest events could indicate a limit to this equatorward offset. Besides the distortion of the magnetosphere, the higher E field magni-tudes measured in the magnetosphere during high Kp would drive plasma deeper into the magnetosphere (Rowland and Wygant, 1998).
The clear trend towards lower latitudes of the onset loca-tion as a funcloca-tion of ring current strength shown in Fig. 5b extends the concern expressed by Gonzalez (1994) regarding the accuracy of classical auroral indices in representing the magnitude of a substorm during great storms to any magnetic storm. Feldstein et al. (1994) observed that the peak in lati-tude of the electrojet magnetic perturbation during the latter part of the expansion phase is at lower latitudes than most of the traditional index stations. By using subauroral station magnetograms, they built a corrected AE index, which dur-ing storms appeared to be twice as large as the traditional one.
The dependence of the onset location on Sym-H (Fig. 5b) explains the tail to 55◦latitude in the histogram of the onset
distribution in Fig. 2b of Frey et al. (2004), since their on-set selections were independent of magnetic activity, such as indicated by Sym-H. Their distribution shows the same ex-tent of the distribution of onset points as shown in Fig. 4c for storm-time events. In contrast there is no low latitude tail in the distribution of onsets for isolated substorms, which cuts off at 62◦degrees, near the middle of the storm-time distri-bution.
3 and 4: The shorter development time for substorms dur-ing rdur-ing current development than for isolated substorms is quite remarkable (Fig. 6). Could it be that the short develop-ment time does not allow enough time for the bulge to rise out of the oval to bifurcate and, therefore, evolve into a clas-sical substorm? We suggest not, for two reasons. First, the expansion size in ILat for both types of events is compara-ble, so there seems no temporal impediment for a bulge to rise out of and separate itself from the oval aurora. Second, if we lump together just the substorms with more restricted oval brightenings (forms b, c and d in Fig. 3), which seem to have comparable latitudinal characteristics, we do find some dependence in the magnetic local time length on expansion time (Fig. 12). Thus, again, one would expect bulge-type events to be able to develop at least for the longer expansion time substorms.
The factor of two greater intensities and shorter develop-ment times of the emissions indicate that the electron pre-cipitation mechanism for the storm-time events is a more intense and dynamic mechanism even than for the electron precipitations in the surge region of isolated substorms (Fujii et al., 1994). The greater precipitation intensities will re-sult in highly enhanced conductances, possibly exceeding 100 mhos, perhaps allowing larger currents to dissipate en-ergy at a higher rate and thereby affecting the time it would take to deplete the magnetospheric source.
Storm-time coverage by the images during the 16 storms was 98 h. With a total of 54 substorms, that gives an average of about 2 h between substorm onsets. With a median sub-storm expansion duration of something like 15 min or less, a substorm expansion is not occurring most of the time dur-ing the main phase development. Thus one must question whether substorms in any form play an important role in storm main phase development.
R. A. Hoffman et al.: Optical differences between storm-time substorms and isolated substorms 1197 The straight-line polar boundary of the emissions
charac-terizing the isolated substorm as especially seen in the orig-inal images is merely a manifestation of the existence of a classical bulge. Since the maximum poleward expansion is much larger than the latitudinal expansion near the ends of the emission region, the shape of the poleward boundary on the curvature of the earth gives the impression of a straight line. Thus the lack of a straight-line polar boundary implies the lack of a bulge.
8: The smaller poleward expansion but larger equatorial expansion results in an emission region more closely related spatially to the original auroral oval. (Note: all onset loca-tions lay within the pre-onset auroral oval.) This can be inter-preted as an indication of an oval brightening and not a clas-sical substorm brightening which typically has the brightest intensities towards the poleward boundary.
9: The comparisons of the end locations of the emission regions in1MLT from the onset locations as well as the dis-placement of the MLT of the maximum width away from the onset MLT give an impression that besides an overall expansion from the source region there is superposed typi-cally a larger eastward drift of the source region of precipita-tion during the main phase development than during isolated substorms. This is consistent with the finding by Rowland and Wygant (1998) of an increasing electric field in the inner magnetosphere as a function of magnetic activity (Kp).
10: Gjerloev et al. (2007) developed a very important anal-ysis tool in the ability to normalize each different substorm emission region to an average emission region with a very high correlation coefficient between the emission intensities of each substorm to the average. We could attempt these normalizations for only a small fraction of the storm-time events because we could not select the critical points as we did with the isolated events (Fig. 1 in Gjerloev et al., 2007). This means that the distribution of the emission intensities over the emission region was unlike the distribution of iso-lated substorms. This result is supported by the recent work of Kornilova and Kornilov (2009) who analyzed the spatial-temporal dynamics at micro- and meso-scales of auroras dur-ing the main phase of magnetic storms usdur-ing TV observa-tions. They concluded that indeed substantial differences do exist between the classical substorm and auroras during the magnetic storm main phase with the scenario of auroral de-velopment depending on many factors.
6 Conclusions
We sought to answer the question: Are there optical dif-ferences between storm-time substorms and isolated sub-storms? The answer is clearly yes.
Using images from the Earth Camera on the Polar space-craft (Frank et al., 1995), we compared the large-scale opti-cal emission features that were displayed by substorms oc-curring during 16 expansion phases of magnetic storms with
the features of isolated substorms. The comparison used two techniques, visual inspection and statistical comparisons. The comparisons were based on the common characteristics seen in isolated substorms that were initially identified by Akasofu (1964) and quantified by Gjerloev et al. (2008).
The primary differences between the two sets of events are the lack of a surge/bulge and a bifurcation of the aurora in the storm-time substorms. These features are characteristics of the existence of a substorm current wedge, the ionospheric portion of the three-dimensional current system coupling the magnetosphere and ionosphere during isolated substorms. If this phenomenon does not exist during substorms occurring during magnetic storms, then the magnetosphere-ionosphere current system during the storm-time substorms must be dif-ferent. The puzzle becomes more complex when we add the findings that the expansion times of storm-time substorms are like half the time for isolated substorms, but with the intensi-ties of the optical emissions roughly twice those for isolated substorms. Several of the analyses suggest that the storm-time substorms are associated more closely with the auroral oval, at least spatially, and, therefore, with the plasma sheet dynamics during the main phase development.
If the auroral characteristics had been found common for the two types of events, then the electrodynamic characteris-tics of the classical substorm could be assumed to exist dur-ing storm-time substorms. However, since we did not find such a commonality, it would be presumptuous to assume similar electrodynamics. These results, though restricted to only one electrodynamic parameter, must call into question the widely held assumption that there is no intrinsic differ-ence between storm-time substorms and classical isolated substorms.
Since the optical signatures we have analyzed are only one part of the electrodynamics of substorms, and primarily im-ply where the ionospheric conductances are enhanced, this interpretation of our comparisons needs confirmation by the analysis of other electrodynamic parameters. To date little analysis has been performed on the electrodynamic parame-ters at ionospheric altitudes during the main phase, or com-parisons of the electrodynamics in the magnetosphere. Until these analyses are performed we caution the applicability of classical electrodynamic substorm phenomenology and ter-minology when interpreting and explaining storm-time sub-storm phenomena.
Acknowledgements. One of us (RAH) performed most of the work
on this paper while on the emeritus program in the Heliophysics Science Division of Goddard Space Flight Center.
References
Akasofu, S.-I.: The development of the auroral substorm, Planet. Space Sci., 12, 276–282, 1964.
Akasofu, S.-I.: Polar and Magnetospheric Substorms, D. Reidel, Norwell, Mass., 1968.
Baumjohann, W., Kamide, Y., and Nakamura, R.: Substorms, storms and the near-earth tail, J. Geomag. Geoelectr., 48, 177– 185, 1996.
Chapman, S.: Earth storms: retrospect and prospect, J. Phys. Soc. Japan, 17, 6–16, 1962.
Feldstein, Y. I. and Starkov, G. V.: Dynamics of auroral belt and polar geomagnetic disturbances, Planet. Space Sci., 15, 209–229, 1967.
Feldstein, Y. I., Levitin, A. E., Golyshev, S. A., Dremukhina, L. A., Vestchezerova, U. B., Valchuk, T. E., and Grafe, A.: Ring current and auroral electrojets in connection with interplanetary medium parameters during magnetic storm, Ann. Geophys., 12, 602–611, 1994,
http://www.ann-geophys.net/12/602/1994/.
Feldstein, Y. I., Grafe, A., Gromovva, I. I., and Popov, V. A.: Auro-ral electrojets during geomagnetic storms, J. Geophys. Res., 102, 14223–14235, 1997.
Frank, L. A., Sigwarth, J. B., Craven, J. D., et al.: The visible imag-ing system (VIS) for the Polar spacecraft, Space Sci. Rev., 71, 297–328, 1995.
Frank, L. A. and Sigwarth, J. B.: Transient decrease of Earth’s far ultra-violet dayglow, Geophys. Res. Lett., 24, 2423–2426, 1997. Frey, H. H., Mende, S. B., and Angelopoulos, V.: Substorm onset observations by IMAGE-FUV, J. Geophys. Res., 109, A10304, doi:10.1019/2004JA010607, 2004.
Fujii, R., Hoffman, R. A., Anderson, P. C., Craven, J. D., Sugiura, M., Frank, L. A., and Maynard, N. C.: Electrodynamic parame-ters in the nighttime sector during auroral substorms, J. Geophys. Res., 99, 6093–6112, 1994.
Germany, G. A., Torr, M. R., Torr, D. G., and Richards, P. G.: Use of FUV auroral emissions as diagnostic indicators, J. Geophys. Res., 99, 383–388, 1994.
Gjerloev, J. W., and Hoffman, R. A.: Height-integrated conductivity in auroral substorms: 1. Data, J. Geophys. Res., 105, 215–226, 2000.
Gjerloev, J. W. and Hoffman, R. A.: The convection electric field in auroral substorms, J. Geophys. Res., 106, 12919–12931, 2001. Gjerloev, J. W. and Hoffman, R. A.: Currents in auroral substorms,
J. Geophys. Res., 107, 1435, doi:10,1029/2001JA000194, 2002. Gjerloev, J. W., Hoffman, R. A., Sigwarth, J. B., and Frank, L. A.: Statistical description of the bulge-type auroral sub-storm in the far ultraviolet, J. Geophys. Res., 112, A07213, doi:10.1029/2006JA012189, 2007.
Gjerloev, J. W., Hoffman, R. A., Sigwarth, J. B., Frank, L. A., and Baker, J. B.: Typical auroral substorm: A bifurcated oval, J. Geo-phys. Res., 113, A03211, doi:10.1029/2007JA012431, 2008. Gonzalez, W. D., Joselyn, J. A., Kamide, Y., Kroehl, H. W.,
Ros-toker, G., Tsurutani, B. T., and Vasyliunas, V. M.: What is a geomagnetic storm?, J. Geophys. Res., 99, 5771–5792, 1994.
Kamide, Y.: Is substorm occurrence a necessary condition for a magnetic storm?, J. Geomag. Geoelectr., 44, 109–117, 1992. Kamide, Y., Sun, W., and Akasofu, S.-I.: The average ionospheric
electrodynamics for the different substorm phases, J. Geophys Res., 101, 99–110, 1996.
Kamide, Y., Baumjohann, W., Daglis, I. A., Gonzalez, W. D., Grande, M., Joselyn, J. A., McPherron, R. L., Phillips, J. L., Reeves, E. G., Rostoker, G., Sharma, A. S., Singer, H. J., Tsu-rutani, G. T., and Vasyliunas, V. M.: Current understanding of magnetic storms: storm-substorm relationships, J. Geophys Res., 103, 17705–17728, 1998.
Kan, J.: Storm-substorm relations workshop, EOS, 87, 234, 2006. Kan, J. R.: Synthesizing a global model of substorms, Geophysical
Monograph 64, p. 73–87, American Geophysical Union, 1991. Kornilova, T. A. and Kornilov, I. A.: Spatial-temporal dynamics of
auroras during the magnetic storm main phase, Geomag. Aeron-omy, 49, 722–731, 2009.
Lui, A. T. Y., Chapman, S. C., Liou, K., Newell, P. T., Meng, C. I., Brittnacher, M., and Parks, G. K.: Is the dynamic magnetosphere an avalanching system?, Geophys. Res. Lett., 27, 911–914, 2000. McPherron, R. L.: Growth phase of magnetospheric substorms, J.
Geophys Res., 75, 5592–5599, 1970.
McPherron, R. L.: The role of substorms in the generation of magnetic storms, Magnetic Storms, Geophysical Monograph 98, American Geophysical Union, 1997.
Ohtani, S., Brandt, P. C., Mitchell, D. G., Singer, H., Nose, M., Reeves, G. D., and Mende, S.: Storm-substorm relationship: Variations of the hydrogen and oxygen energetic neutral atom intensities during storm-time substorms, J. Geophys. Res., 110, A07219, doi:10.1029/2004JA010954, 2005.
Rostoker, G., Akasofu, S.-I., Foster, J., Greenwald, R. A., Kamide, Y., Kawasaki, K., Lui, A. T. Y., McPherrron, R. L., and Russell, C. T.: Magnetospheric substorms – Definition and signatures, J. Geophys Res., 85, 1663–1668, 1980.
Rowland, D. E. and Wygant, J. R.: Dependence of the large-scale, inner magnetospheric electric fielded on geomagnetic activity, J. Geophys. Res., 103, 14959–14964, 1998.
Sheehan, R. E. and Carovillano, R. L.: Characteristics of the equa-torward auroral boundary near midnight determined from DMSP images, J. Geophys Res., 83, 4749–4754, 1978.
Torr, M. R., Torr, D. G., Zukic, M., et al.: A far-ultraviolet imager for the international solar-terrestrial physics mission, Space Sci. Rev., 71, 329–383, 1995.
Tverskaya, L. V., Tel’tsov, M. V., and Shkol’nikova, S. I.: Dynamics of the nightside auroral oval related to substorm activity during magnetic storms, Geomagn. Aeron., 29, 321–323, 1989. Wu, C.-C., Liou, K., Lepping, R. P., and Meng, C.-I.: Identification