August 12, 2019
A study of accretion and disk diagnostics
in the NGC 2264 cluster
? ??
Alana P. Sousa
1,2, Silvia H. P. Alencar
1, Luisa M. Rebull
3, Catherine C. Espaillat
4, Nuria Calvet
5, and Paula S.
Teixeira
61 Departamento de Física-Icex-UFMG Antônio Carlos, 6627, 31270-901. Belo Horizonte, MG, Brazil e-mail:[email protected]
2 Université Grenoble Alpes, IPAG, F-38000 Grenoble, France
3 Infrared Science Archive (IRSA), IPAC, 1200 E. California Blvd., California Institute of Technology, Pasadena, CA 91125, USA 4 Department of Astronomy, Boston University, 725 Commonwealth Avenue, Boston, MA 02215, USA
5 Department of Astronomy, University of Michigan, 830 Dennison Building, 500 Church Street, Ann Arbor, MI 48109, USA 6 Scottish Universities Physics Alliance (SUPA), School of Physics and Astronomy, University of St. Andrews, North Haugh, Fife,
KY16 9SS, St. Andrews, UK
Received May 26, 2015; accepted September 04, 2015
ABSTRACT
Understanding disk dissipation is essential for studying how planets form. Disk gaps and holes, which almost correspond to dust-free regions, are inferred from infrared observations of T Tauri stars (TTS), indicating the existence of a transitional phase between thick accreting disks and debris disks. Transition disks are usually referred to as candidates for newly formed planets. We searched for transition disk candidates belonging to NGC 2264. Using stellar and disk parameters obtained in the observational multiwavelength campaign CSI2264, we characterized accretion, disk, and stellar properties of transition disk candidates and compared them to systems with a full disk and diskless stars We modeled the spectral energy distribution (SED) of a sample of 401 TTS, observed with both CFHT equipped with MegaCam and IRAC instrument on the Spitzer, with Hyperion SED fitting code using photometric data from the U band (0.3µm) to the Spitzer/MIPS 24µm band. We used the SED modeling to distinguish transition disk candidates, full disk systems, and diskless stars. We classified∼52 % of the sample as full disk systems,∼41 % as diskless stars, and∼7 % of the systems as transition disk candidates, among which seven systems are new transition disk candidates belonging to the NGC 2264 cluster. The sample of transition disk candidates present dust in the inner disk similar to anemic disks, according to theαIRACclassification, which shows that anemic disk systems can be candidate transition disks. We show that the presence of a dust hole in the inner disk does not stop the accretion process since 82 % of transition disk candidates accrete and show Hα, UV excess, and mass accretion rates at the same level as full disk systems. We estimate the inner hole sizes, ranging from 0.1 to 78 AU, for the sample of transition disk candidates. In only∼18 % of the transition disk candidates, the hole size could be explained by X-ray photoevaporation from stellar radiation.
Key words. Stars:pre-main sequence - Stars:variables:T Tauri - Accretion:accretion disks - Planetary systems:protoplanetary disks
1. Introduction
Circumstellar disks are ubiquitous around young stars and are the sites of planet formation. The analysis of disk structure and evolution is therefore an essential step in understanding the for-mation of planets. There are still many questions as to how the gas and dust in circumstellar disks evolve into planetary systems. Infrared (IR) observations of young low mass stars show that the number of circumstellar disks decreases with age with a typi-cal timestypi-cale for dissipation around∼6 Myr (e.g., Haisch et al. 2001; Hernández et al. 2007; Ribas et al. 2014).
Several mechanisms of disk dissipation have been proposed in the literature. The inner disk is partly dissipated by accretion onto the star with a typical rate of about 10−8Myr−1(Hartmann
et al. 1998) in the T Tauri phase. Disks can be photoevaporated by the central star’s high-energy radiation, which is a very effi -? Tables 2 and 3 are only available in electronic form at the
CDS via anonymous ftp to cdsarc.u-strasbg.fr (130.79.128.5) or via http://cdsweb.u-strasbg.fr/cgi-bin/qcat?J/A+A/
?? This work is based on observations made with FLAMES instrument
on the Very Large Telescope under program ID 088.C-0239.
cient mechanism for gas dispersal, once the mass accretion rate drops below the photoevaporation mass loss rate (Clarke et al. 2001; Adams et al. 2004; Owen et al. 2011; Rosotti et al. 2013; Alexander et al. 2014). The disk material may be driven out of the system through disk winds and jets (Konigl 1989; Pelletier & Pudritz 1992; Safier 1993; Shu et al. 1994). The disk can also be consumed in the coagulation of grains and planet formation (Pa-paloizou & Terquem 1999; Dullemond & Dominik 2005; Hol-lenbach et al. 2005; Zhu et al. 2011).
Circumstellar disks are often detected due to IR excess with respect to the stellar photosphere. Dust in the disk is heated by the central star and accretion and it then reemits IR wavelengths. The spectral energy distribution (SED) of a star with an optically thick disk, therefore, presents an IR excess added to the stellar photospheric contribution. As the disk disperses, the SED grad-ually shows less IR excess (Lada 1987). Furthermore, regions of the disk that are almost dust-free, that correspond to gaps and holes, are inferred from IR observations of T Tauri stars (TTS). Inner disk hole SEDs are characterized by a lack of emission ex-cess in the near-IR but normal thick disk IR emission at mid-IR
sition disks are not common in star forming regions, represent-ing only about 10 % of young star-disk systems (Owen 2016; Ansdell et al. 2016). This indicates that disk dispersal is rapid compared to disk lifetime.
We searched for transition disk candidates in the young (∼ 3 Myr) stellar cluster NGC 2264, located at a distance of ∼760 pc from the Sun. We used data from the Coordinated Syn-optic Investigation of NGC 2264 (CSI2264) observational cam-paign (Cody et al. 2013) to characterize the transition disk can-didates in terms of various accretion diagnostics (Hαline emis-sion, ultraviolet excess), disk parameters (IR excess), and stellar parameters (mass, effective temperature, radius) by comparing them to the characteristics of systems with full disks and disk-less stars.
In Section 2 we describe the data used in this work, in Sec-tion 3 we explain the sample selecSec-tion criteria, and in SecSec-tion 4 we present the determination of accretion and disk character-istics of our sample. The discussion and analysis of inner hole properties are in Section 5, and in Section 6 we present our con-clusions.
2. Observations
We used data from the CSI2264, an international campaign that included simultaneous photometric and spectroscopic observa-tions of the young cluster NGC 2264 with satellites and ground-based telescopes at various wavelengths (see Cody et al. 2013, for more details about the campaign). During the CSI2264 cam-paign, NGC 2264 was simultaneously observed in the optical with the CoRoT satellite for 40 days and with Spitzer satellite (Werner et al. 2004) at 3.6 and 4.5µm for 30 days. We obtained 20 epochs of observations on the Very Large Telescope (VLT) equipped with the Fiber Large Array Multi Element Spectro-graph (FLAMES), four to six observations simultaneously with the CoRoT data, depending on the target. Photometry in theu andrbands was also obtained with MegaCam (Canada-France-Hawaii Telescope-CFHT) for 14 nights about one month after the end of the CoRoT observations.
Additionally to the CSI2264 data, to construct SEDs in Section 4.2, we also used data from catalog surveys, such as U BVRcIc optical photometry from Rebull et al. (2002), ugriz
optical photometry from SDSS (Gunn et al. 1998), near-IR pho-tometry JHKs from 2MASS, IRAC (Fazio et al. 2004), and
MIPS (Rieke et al. 2004) data from Spitzer satellite, and obser-vations from the Wide-field Infrared Survey Explorer (WISE) at 3.4, 4.6, 12.0, and 22µm(Wright et al. 2010).
et al. (2012) and were also observed in u,g, r, andi bands at CFHT with MegaCam (Venuti et al. 2014). The IRAC complete-ness limits, from Teixeira et al. (2012), are 13.25 mag for the
3.6µm, 4.5µm, and 5.8µm IRAC bands and 12.75 mag for the
8µm IRAC band. The IRAC sample from Teixeira et al. (2012)
was also limited to magnitude uncertainties smaller than 0.1 mag for all IRAC bands. Consequently, some IRAC sources belong-ing to NGC 2264 could be missbelong-ing compared to other literature works that used IRAC observations. Our sample is composed of 401 TTS that were observed with both MegaCam and IRAC and appeared in Teixeira et al. (2012), to select the systems with the largest number of measured stellar, accretion, and disk param-eters. As the sample is not complete, disk frequencies inferred from these data are not reliable.
3.1. SED model
We calculated synthetic SEDs for all the objects in our sam-ple, using the Python-based fitting code sedfitter1 (Robitaille
2017) based on Hyperion, an open-source parallelized three-dimensional dust continuum radiative transfer code by Robitaille (2011). This fitting model consists of modular sets with diff er-ent componer-ents that can include a stellar photosphere, a disk, an envelope, and ambipolar cavities. The code allows the user to choose the best set of models for their sample of stars and elimi-nate unphysical models. We tested three sets of models2: model
1 - only a central star; model 2 - a central star and a passive disk, which is a disk that absorbs the stellar radiation and re-radiates it in the IR, without taking into account accretion radiation; and model 3 - a central star, a passive disk, and an inner disk hole.
The SEDs have been constructed for the 401 stars in our sam-ple that were modeled with the three model sets. The observa-tional fluxes, from the U band to the 24µm MIPS band taken from the literature, were not dereddened. The input parameters of the models are the fluxes and photometric apertures, a range of AV, and the distance of the star to the Sun. We used the
in-dividual value ofAV to each star from Venuti et al. (2014). We
used the individual distance values estimated from parallax data obtained from the Gaia mission second release (Gaia Collabora-tion et al. 2016, 2018). The distance values were calculated using Bayesian methods, following Luri et al. (2018). The individual distance values for our sample of stars are listed in Tables 1, 2, and 3. TheAvand the distance uncertainty of each star were used
to define the range ofAvand distances to be searched for during
1 In this work, we used version v1.0 of the code, available to download at https://doi.org/10.5281/zenodo.235786.
0 1 2 3 4 5
A
v(mag) [Model]
0 1 2 3 4 5A
v(m
ag
) [
Lit
.]
(a)400 500 600 700 800 900 1000 1100 1200
Distance (pc) [Model]
400 500 600 700 800 900 1000 1100 1200
Distance (pc) [Gaia]
(b)
1 2 3 4 5
R (R ) [Model]
1 2 3 4 5
R
(R
) [
Lit
.]
(c)2000 3000 4000 5000 6000 7000
T (K) [Model]
2000 3000 4000 5000 6000 7000
T (K) [Lit.]
[image:3.595.100.496.62.482.2](d)
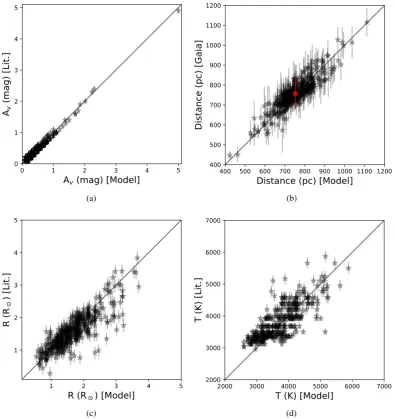
Fig. 1. Stellar parameters modeled with Hyperion SED fitting code (Robitaille 2017) compared to stellar parameters obtained by Venuti et al. (2014). a)AV, b) distance from the Sun. The red point and error bars represent the mean and standard deviation of the distance of the cluster members studied in this work (d=757±80 pc), c) stellar radii, d) stellar temperatures.AV and distances are input parameters of the code, while stellar radius and temperature are output parameters of the Hyperion SED Model. The distances were obtained from the Gaia parallax data (Luri et al. 2018). The solid line shows a slope equal to 1. Based on these plots, we conclude that our modeling is doing at least as well as the prior Venuti et al. (2014) modeling.
the SED modeling. Within the allowed ranges, the SED program can choose theAV and distance of each system that correspond
to the best fit to the observed flux data. For the systems that did not have Av and/or distance ( Gaia parallax) available, we chose the values that represented a best fit to the data. We used the same extinction law described in Robitaille et al. (2007). In the model calculations, the inner disk radius (Rin) is set to the dust
sublimation radius (Rsub) in disks without an inner hole (model
2) or varied from 1 to 1000 Rsub(Robitaille 2017) to reach a best
fit, when an inner disk hole is present (model 3).
Among the 401 TTS in our sample, only 152 have detections available at 22µm (WISE) or 24µm (MIPS), which are impor-tant for constraining the outer disk. Without these data, the SED fitting is highly degenerate in the outer disk region. The MIPS observations targeted preferentially stars that presented IR ex-cess; we therefore expect that stars which were not detected in
these bands to have little or no excess at these wavelengths (Teix-eira et al. 2012).
The SED models were calculated for each source and the dif-ferent output models were compared with the observational data through aχ2test. The best model was the one presenting the
min-imumχ2value. For the 152 stars that had 22µm or 24µm
detec-tions, we calculated models 2 and 3, choosing the best model that fit the data and showed output stellar parameters (temperature and radii) from the fitting procedure close to the values available in the literature. A total of 249 stars did not have 24µm and/or 22µm measurements or have only an upper limit at these wave-lengths. Among those systems, we fit models 2 and 3 to the 85 stars that presented excess in the inner disk (based in theαIRAC
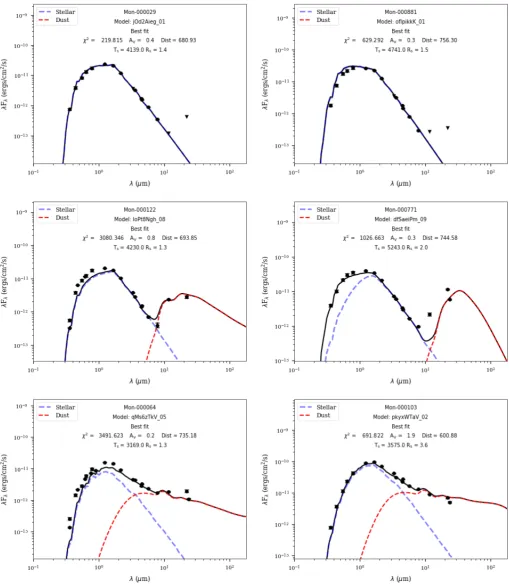
sam-Fig. 2. Examples of synthetic SED fitting, using Hyperion SED code (Robitaille 2017), for our sample of systems classified as diskless stars (top), transition disk candidates (middle) and full disk systems (bottom). The circles show data from the U band (0.3µm) to the MIPS 24µm band. Triangles, when present, represent the upper limits. The black solid line is the best fit to the SED (Robitaille 2017) and the dashed lines correspond to the stellar (blue) and dust (red) emission components (Robitaille 2011). We found in our sample 7% transition disk candidates, 52% systems with full disks, and 41% diskless stars.
ple of diskless stars was used to compare its characteristics with the sample of transition disk candidates. Among the 401 TTS in our sample, the SEDs of 7 stars could not be fit by any
[image:4.595.43.553.59.646.2]to the literature values or the best model did not produce a good fit to the observational data.
In Fig. 1 we show a comparison of the AV, distance,
stel-lar radii, and stelstel-lar temperatures found by Hyperion SED fitting model with the values by Venuti et al. (2014) and the distances calculated using Gaia parallax data following Luri et al. (2018). AsAV and the distances are input parameters of the model, the
values returned by the model agree with the literature value. The stellar temperature and radius are output parameters and the best-fit values are not always accurate, but for most sources, the devi-ations from the literature values are small.
The SEDs have been extensively used in the literature to identify transition disks (e.g., Calvet et al. 2005; Merín et al. 2010; Owen 2016; Grant et al. 2018). We used the SED to mea-sure the near-IR and mid-IR flux excess (Strom et al. 1989) and the model including an inner hole to confirm or refute the presence of a hole in the inner disk (e.g., Merín et al. 2010). In this work, we selected as transition disk candidates stars with inner-disk holes according to the SED fitting (systems with Rin >Rsub). We also only selected systems that have 24µm flux
detected above the photospheric level larger than the 10µm flux. We found 28 stars that fulfill all these conditions in our sample. Among the remaining systems, 209 stars were modeled with a full disk and 164 as diskless. In Fig. 2 we show some examples of SEDs of diskless stars, transition disk candidates, and full disk systems. The black solid line is the best fit (based on χ2) that
represents the total flux of the system. The dashed red and blue lines are the components of emission from dust and the central star, respectively. The dust and stellar emission components were computed using the Hyperion code3(Robitaille 2011), after
de-termining the best the SED model for each system (Robitaille 2017). In Sect. 5.2 we analyze the disk and the inner-disk hole determined values. From here on, the results will be discussed in terms of three groups: diskless stars, transition disk candidates, and full disk systems. In Table 1, 2, and 3 we show the obser-vational parameters of the transition disk candidates, full disk systems, and diskless stars, respectively.
4. Results
4.1. Star formation sites in NGC 2264
Star formation is still ongoing in some regions of NGC 2264 (Lamm et al. 2004; Sung et al. 2009; Teixeira et al. 2012). These regions have the most embedded members (Av > 3.0) in the
cluster, as seen in Teixeira et al. (2012). Since the youngest stars are clustered, we wondered if the transition disks were clustered too. We checked if transition disk candidates were randomly lo-cated in NGC 2264 or preferentially clustered in some spatial regions.
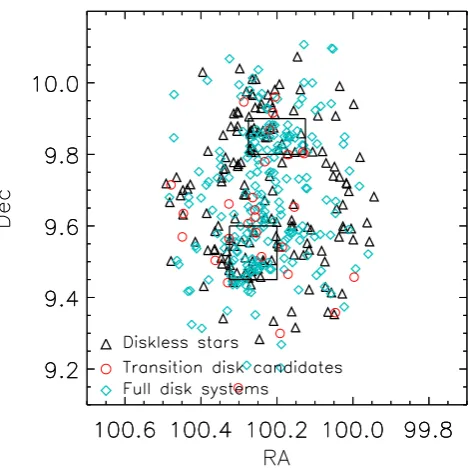
We show in Fig. 3 the spatial distribution of our three groups of stars. The boxes define the regions of the most active star for-mation of the cluster taken from Lamm et al. (2004). We calcu-lated the fraction of stars of a given group that falls in the boxes, that is the number of systems of a given group in the boxes di-vided by the total number of systems in the boxes. To compare with that, we also calculated the fraction of each group that falls out of the boxes, that is the number of systems of a given group out of the boxes divided by the total number of systems out of the boxes. We found that in the boxes,∼ 59 % of systems are 3 In this work, we used version 0.9.8 of the Hyperion code avail-able to download from http://www.hyperion-rt.org/and model sets from https://doi.org/10.5281/zenodo.572233.
[image:5.595.307.545.179.416.2]full disks,∼4 % are transition disk candidates, and∼37 % cor-respond to diskless stars. The fractions of systems that fall out of the boxes are∼49 % full disks,∼ 8% transition disk candidates, and∼43 % diskless stars. The population in the active star for-mation regions are predominantly composed of full disk systems and the fraction of transition disk candidates and diskless stars in these regions is considerably smaller than outside, which may point to an evolutionary scenario for the cluster, as discussed by Venuti et al. (2014).
Fig. 3. Spatial distribution of stars belonging to NGC 2264 and ana-lyzed in this work. Our classification of the systems is represented with different symbols and colors. The two boxes delimit the most active star formation regions, as defined by Lamm et al. (2004). The population in these boxes are predominantly composed of full disk systems. Transi-tion disk candidates and diskless stars are preferentially found outside of the active star formation regions.
4.2. Disk diagnostics
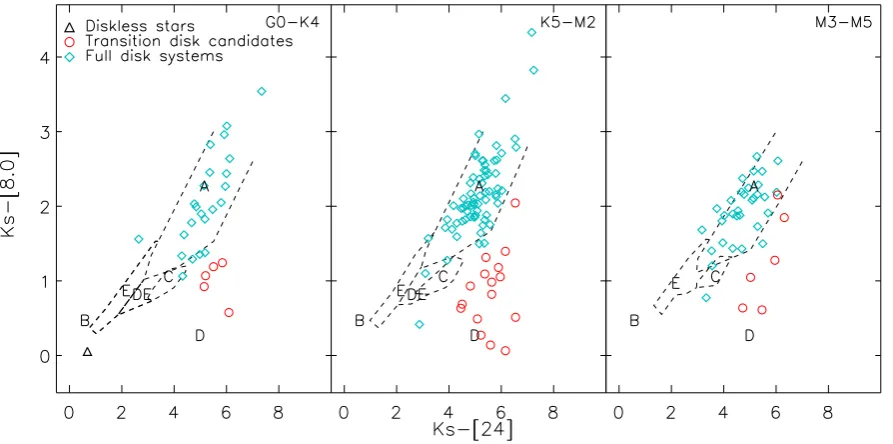
Transition disks have a dust hole and gap in the inner disk re-gion, characterized by a lower quantity of dust compared to the outer disk. Therefore, we expect that transition disks will show less excess in near-IR than full disks, while the excess at longer wavelengths may be compatible with full disk systems. In Fig. 4, we showKs−[8.0] vs.Ks−[24] diagrams. The stellar
mag-nitudes were dereddened with individual Av value from Venuti et al. (2014) and theAλ/Avrelation from the SVO Filter4, which
uses the extinction law by Fitzpatrick (1999), improved by In-debetouw et al. (2005) in the IR. We can see that stars with full disks present excess above the photospheric emission in the in-ner and outer parts of the disk, while transition disks present emission in the outer disk compatible with a full disk system and lower emission in the near IR than full disks.
Mon-000676 06414780+0934096 K5 w -1.53 2.32 4395. 0.517 728.8
Mon-000771 06411827+0933535 K4 28.9 c -2.39 1.83 4580. -0.270 762.9
Mon-000824 06410183+0938411 K4 -0.5 493 1.5 c -2.41 2.23 4580. -0.068 3.3E-09 606.9 Mon-000860 06415492+0942527 M2.5 261.0 c -3.23 1.18 3430. -0.900 5.6E-09 708.7
Mon-000879 06410338+0940448 M1 16.5 c -2.69 1.99 3680. -0.130 1.2E-08 1027.0
Mon-000937 06405255+0952059 K7 8.5 371 6.9 c -2.40 2.10 4000. -0.010 1.0E-08 7.2E-10 890.7
Mon-000961 06411247+0908509 M3.5 w -1.20 0.90 3300. 0.010 7.9E-11 706.1
Mon-000965 06404600+0917582 M2 14.4 305 c -2.51 1.72 3500. -0.540 1.0E-08 1.8E-09 886.9 Mon-000997 06403077+0948076 M1 72.8 c -4.22 0.85 3680. -0.120 2.8E-10
Mon-001033 06404102+0947577 K7 6.3 434 7.5 c -1.97 1.67 4000. -0.700 2.0E-08 4.7E-09 737.2
Mon-001094 06403164+0948233 K5 54.6 c -1.96 1.49 4395. -0.670 1.6E-08 750.2
Mon-001229 06403697+0939097 M1 5.0 w -1.92 1.46 3680. -0.248 753.1
Mon-001287 06401110+0921270 M3 126.0 315 163.1 c -1.62 1.08 3360. -1.930 1.9E-08 795.2
Mon-001308 06395924+0927245 M0 c -1.87 1.59 3920. -0.800 1.9E-08 744.9
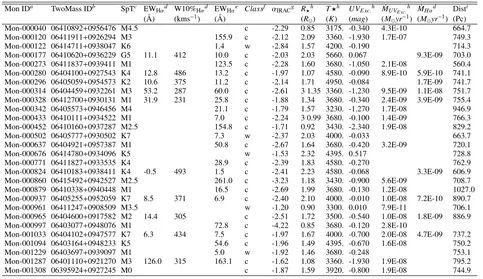
Notes.This table is ordered according to the Mon ID.
(a)CSIMon is an internal identification of the CSI 2264 campaign. Here, CSI was omitted for brevity.(b)2Mass identification.(c)Spectral type obtained by Venuti
et al. (2014).(d)Hαparameters obtained using FLAMES spectra by Sousa et al. (2016). They used the convention that positive Hαequivalent width indicates Hαin emission, and negative values correspond to Hαin absorption.(e)Hαequivalent width obtained by Dahm & Simon (2005).(f)Classification as CTTS (c) and WTTS
(w) by Sousa et al. (2016) and Venuti et al. (2014).(g)αIRACis the slope of the SED between 3.6µm and 8µm obtained by Teixeira et al. (2012).(h)Parameters
obtained using CFHT data by Venuti et al. (2014).(i)Distance from the Sun which was obtained from the Gaia parallax data, following (Luri et al. 2018).
external factor like photoevaporation by a close high mass star (Scally & Clarke 2001). These systems will present emission above the photospheric level in the inner disk and little emission in the outer disk. The disk can also be dispersed homogeneously throughout its radius. In this case, the disk will evolve through a diagonal path in Fig. 4, the inner and outer disks presenting the same emission above the photospheric level at each epoch. How-ever, Koepferl et al. (2013) show that this type of disk dispersal is not common. Disk dispersal can also proceed from inside to outside due, for example, to photoevaporation by high-energy radiation of the central star and planet formation. In Fig. 4, these systems should present IR excesses in the outer disk, and weak or no IR excesses in the inner disk.
In Fig. 4, we plot lines from theoretical models that separate stars with disks in different evolutionary stages (Koepferl et al. 2013). Our disk classification is in agreement with the theoreti-cal disk evolution obtained by Koepferl et al. (2013), since our systems classified as full disks are predominantly located in the region with primordial disks (represented by letter A in the plot) and our transition disk candidates are in the region of inside to outside disk evolution (represented by letter D in the plot). We do not have a significant number of systems in regions C and E that are expected to contain systems with ultra-settled primor-dial disks, which correspond to flat disks and homogeneously de-pleted disks, respectively. Unfortunately, we do not have MIPS data for the sample of diskless stars used in this work, which we expect to show no excess emission at all wavelengths, as seen, for example, in Owen (2016), and should be located in region B in the plot.
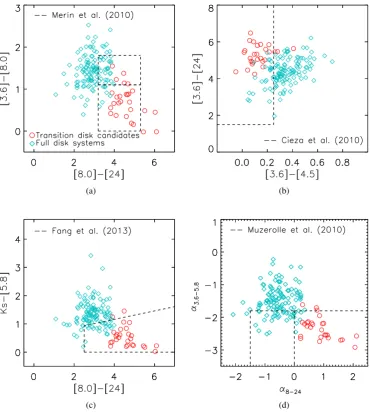
In the literature there are several criteria to select transition disk candidates (e.g., Fang et al. 2009, 2013; Muzerolle et al. 2010; Merín et al. 2010; Cieza et al. 2010; Ribas et al. 2013), using IR photometric and spectroscopic data. We can compare our selection criteria with those used in some previous works.
Merín et al. (2010), used photometric fluxes in IRAC and MIPS bands to classify a system as a transition disk. In a [3.6]− [8] versus [8]−[24] diagram they considered that systems with 0>[3.6]−[8]<1.1 and 3.2<[8]−[24]<5.3 were transition disks, while systems with 1.1<[3.6]−[8]<1.8 and 3.2<[8]− [24]<5.3 presented a small excess emission and were classified as pre-transition disk by Kim et al. (2013). Pre-transition disks were defined as systems with a gap between an inner and an outer disk (Espaillat et al. 2008). The selection criteria adopted by Fang et al. (2013) are based in theKs−[5.8] versus [8]−
[24] diagram. Systems are classified as transition disks if [8]− [24]≥2.5 and ifKs−[5.8] ≤0.56+([8]−[24])×0.15. Cieza
et al. (2010) proposed a less restrictive transition disk selection criteria, using the [3.6]−[24] versus [3.6]−[4.5] diagram, where a system is classified as transition disk if [3.6]−[24]>1.5 and [3.6]−[4.5] < 0.25. Muzerolle et al. (2010) used as transition disk selection criteria the slopes inlog(λFλ) versuslog(λ). They proposed the following limits to the slopes: for weak emission sources,α3.6−5.8<1.8 and−1.5≤α8−24≤0.0, and for transition
disks,α3.6−5.8<1.8 andα >0.0.
[image:6.595.58.541.74.353.2]Fig. 4.Near-IR and mid-IR color-color diagram for stars belonging to NGC 2264 broken up by spectral type ranges into three plots. We can see two different populations: stars with full disks present emission excess above the photospheric level in the inner and outer parts of the disk, while transition disk candidates present little dust emission in the inner disk, and dust emission in the outer disk compatible with full disk systems. The dashed lines delimit regions with different disk dispersal mechanisms computed by Koepferl et al. (2013). Region (A) represents thick primordial disks, (B) stellar photospheres, (C) ultra-settled primordial disks (flat disks), (D) inside to outside depleted disks, (E) homogeneously depleted disks and (DE) is a region that may contain systems with homogeneously depleted disks and inside to outside depleted disks. The stars we have selected as full disks and transition disks fall in regions of this diagram that are consistent with that expected from the models.
disks agree with the transition disk or pre-transition disk criteria from Merín et al. (2010), Cieza et al. (2010), Fang et al. (2013), and/or Muzerolle et al. (2010). Only 15 of them would be classi-fied as transition disks by at least three of these criteria, follow-ing the selection criteria from Grant et al. (2018). We checked the SEDs of these systems and most of them are not compati-ble with a transition disk SED. Five systems could be classified as transition disks according to their SEDs, but the photometric data are not good enough to confirm such a classification. We marked these five systems in Table 2.
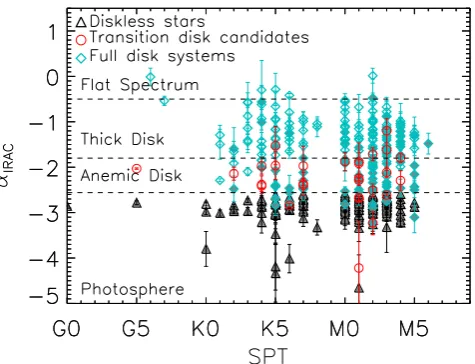
The αIRAC index allows a classification of inner disk
evo-lution, as proposed by Lada et al. (2006). They classified star-disk systems as photospheres (no dust in the inner star-disk) when αIRAC < −2.56, anemic disk (optically thin disk) if−2.56 <
αIRAC < −1.80, optically thick disk if−1.80 < αIRAC < −0.5,
flat spectrum for systems with−0.5 < αIRAC < 0.5, and class I sources ifαIRAC > 0.5.
Anemic disk systems fall in the transition region between stars with and without dust in the inner disk. This type of disk was also classified as an evolved disk by Hernández et al. (2007). Using only theαIRACindex that was measured by Teixeira et al.
(2012), we would have classified 179 (∼45%) systems as disk-less stars, that correspond to photospheres, 78 (∼19%) as transi-tion disk candidates, which correspond to the anemic disks, and 144 (∼36%) as full disk systems, which are the systems classi-fied as flat spectra and thick disks.
Our disk classification based on SED modeling is shown in Fig. 6, where we can see the overall good agreement with the αIRAC disk classification. All the flat spectra and almost all the
thick disk systems are indeed classified as full disks according to our SEDs and most of the photospheres correspond to the disk-less SED systems. The transition disk candidates are generally found among the anemic disks, but a significant fraction of
ane-mic disks would not be classified as transition disk candidates based on the SED analysis. Among the 78 systems classified as anemic disks, only 31 have available data at 22/24µm and 17 of these were classified as transition disk candidates by the SED fit-ting. The other 47 anemic disks, identified in Fig. 6, do not have 22/24µm data, and we could not properly model their outer disk emission, as discussed in Sect. 3.1 and as shown by Robitaille et al. (2007). Therefore the number of transition disk systems in our sample could be larger than what we could determine.
4.3. Accretion diagnostics
Accreting young low-mass stars are known as classical T Tauri stars (CTTS) and are characterized by strong and broad emis-sion lines (e.g., Hα, Hβ, He I ) that vary in intensity and mor-phology as the star-disk system rotates and accretes, and UV ex-cess above the photospheric emission. When the accretion pro-cess ceases, the young low-mass stars are called weak line T Tauri stars (WTTS). Surprisingly, most transition disk systems are found to be accreting (Manara et al. 2014). It is therefore in-teresting to analyze how the presence of a hole in the inner disk influences accretion to the star in this disk evolutionary phase.
The Hαline is variable, intense and broad in CTTS. This line can be formed in different regions of the star-disk system, such as accretion funnels, winds, and the chromosphere. In typ-ical CTTS, the Hαline emission component is thought to come mostly from the accretion funnel, and it is used as an accre-tion diagnostic (White & Basri 2003; Fang et al. 2009; Sousa et al. 2016). The measured equivalent width of Hαdepends on the stellar continuum contribution, and is therefore spectral type dependent. For a star to be considered a CTTS, the equivalent width of its Hαline (EWHα) should be larger than 3 ˚A for
(a) (b)
[image:8.595.108.479.69.482.2](c) (d)
Fig. 5. Different diagrams that are used in previous works to separate transition disk systems from the full disk sample. a) Selection criteria that were used by Merín et al. (2010). Systems that fall in the bottom dashed box are classified as transition disks and systems that fall in the top dashed box are systems with small excess in the IRAC bands. b) Selection criteria used by Cieza et al. (2010). The dashed lines separate the transition disks. c) Selection criteria from Fang et al. (2013). Systems that fall in the dashed region are transition disks. d) Selection criteria from Muzerolle et al. (2010). Systems in the left dashed box are classified as weak-excess sources and systems that lie in the right dashed box are transition disks. Almost all of our transition disk candidates fulfill the selection criteria from the literature.
for M3-M5.5, or larger than 40 ˚A for M6-M7.5 (White & Basri 2003). Stars that show Hαwidth at 10% of maximum inten-sity (W10%Hα) higher than 270 km/s are also considered CTTS
(White & Basri 2003), since gas at such high velocities cannot be explained by the stellar chromosphere alone.
In Fig. 7 shows the EWHαas a function of spectral type and
the W10%Hαas a function of EWHα, for full disk systems,
transi-tion disk candidates, and diskless stars according to our classifi-cation. The EWHαwere taken from Sousa et al. (2016) and Dahm
& Simon (2005), W10%Hαcomes from Sousa et al. (2016), and
the spectral types are from Venuti et al. (2014). In Table 1, 2, and 3, we show the classification of the stars as CTTS or WTTS for all the systems analyzed in this work. In particular,∼82 % of the transition disk candidates belonging to NGC 2264 still accrete, suggesting that gas is able to flow through the inner disk hole.
In Fig. 7a, we see a considerable number of full disk systems that fall below the EWHαthreshold of CTTS (blue lines). Among
them, 17 stars were observed at 22/24µm and have their outer disk emission and their classification as full disk systems well determined. The other 28 full disk systems that fall below the accretion threshold do not have data at 22/24µm and their outer disk contribution is not constrained. However, as these systems present emission excess in the inner disk (based on theαIRAC
in-dex obtained by Teixeira et al. (2012)), we classified them as full disks. Among these 28 systems, 22 do not present other accretion signatures and are true WTTS, despite having near-IR excess.
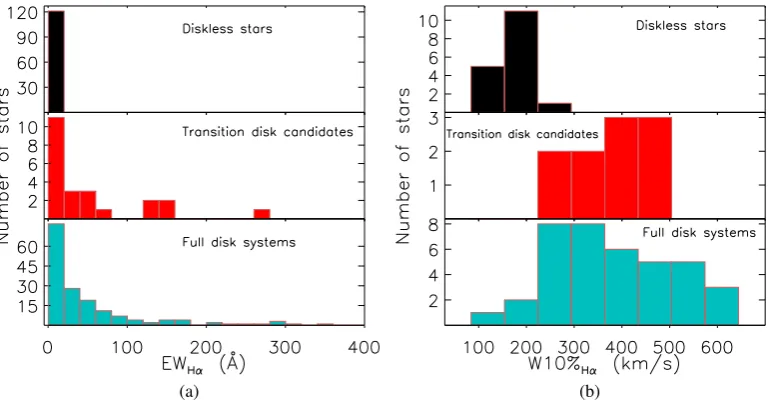
In Fig. 8 we show the distribution of EWHα and W10%Hα
of our sample of stars. The EWHαmean values are (3.7±0.3) ˚A
for diskless stars, (51±14) ˚A for transition disk candidates, and (59±8) ˚A for full disk systems. The transition disk distribution of EWHαis more similar to the full disk system distribution than
probabil-Fig. 6. Slope of the SED from 3.6µm to 8µm (αIRAC) measured by Teixeira et al. (2012) as a function of the spectral type obtained by Venuti et al. (2014); Dahm & Simon (2005); Rebull et al. (2002); Walker (1956). Symbols indicate our categorization (notation as in Fig. 4). Our sample of transition disk candidates presents dust in the inner disk sim-ilar to anemic disks, which shows that anemic disk systems can be good candidates to transition disks. Systems for which we do not have data at 22/24µm are identified by gray filled symbols.
ity of 98% to be the same. However, a K-S test indicates that the distribution of transition disk candidates and diskless stars are statistically different, with probability of less than 1% to be the same. The mean values of W10%Hα are (172±10) ˚A for
diskless systems, (371±27) ˚A for transition disk candidates, and (383±20) ˚A for full disk systems. A K-S test shows a probability of 83% that the distributions of W10%Hαfor transition disks and
full disk stars are equal. Comparing the distribution of transition disk candidates with diskless stars, a K-S test shows that they are statistically different with a probability of less then 1% to be the same.
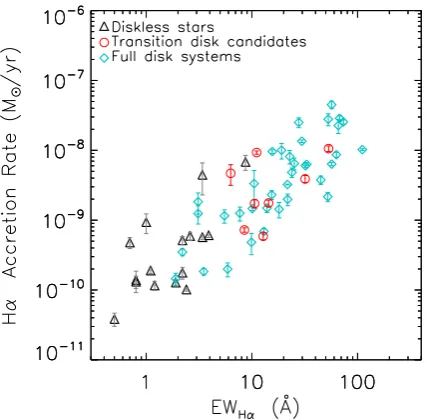
Using EWHα, Sousa et al. (2016) calculated the mass
accre-tion rates ( ˙MHα) for a sample of stars belonging to NGC 2264
and observed with the FLAMES spectrograph on VLT. These accretion rates represent a lower limit, because their computa-tion did not take into account absorpcomputa-tion due to winds that the Hαline may exhibit, which decreases the total line equivalent width. In Fig. 9, we show ˙MHα from Sousa et al. (2016) as
a function of EWHα for full disk systems, transition disk
can-didates and diskless stars. The ˙MHα for transition disk
candi-dates falls between the values computed for full disk systems and diskless stars. The mean ˙MHαvalue of each group
corrobo-rates this analysis: (9.9±3.1)×10−10M
yr−1for diskless stars, (4.1 ±1.2) ×10−9Myr−1 for transition disk candidates, and (8.2±0.5)×10−9M
yr−1for full disk systems. As explained in Manara et al. (2013) and Sousa et al. (2016), the accretion rate attributed to WTTS, here represented by the diskless sample, corresponds to a contribution from nebular and chromospheric Hαline emission.
In CTTS, the stellar magnetic field is expected to be strong enough to truncate the disk at a few stellar radii from the star. The gas accreting from the disk follows the stellar magnetic field and hits the star at high latitudes, creating hot spots at temperatures higher than the stellar photospheric temperature. The UV excess in CTTS comes only from hot spots (e.g., Calvet & Gullbring 1998; Venuti et al. 2015, 2014), and it is a more direct
diagnos-tic of accretion than Hαline, except for low accretors (Ingleby et al. 2011). UV excesses for the known NGC 2264 members were measured by Venuti et al. (2014) with MegaCam instru-ment. The UV excess was obtained comparing the observed data with a reference non-accreting threshold defined by the fit of a polynomial function to the locus of non-accreting systems on therversusu-rcolor-magnitude diagram. The UV excess was defined as E(u)=(u−r)obs−(u−r)ref, where (u−r)obsis the
ob-served color of the star and (u−r)refis a reference non-accreting
color atrobsmagnitude. The more negative the E(u) values, the
larger the UV excess.
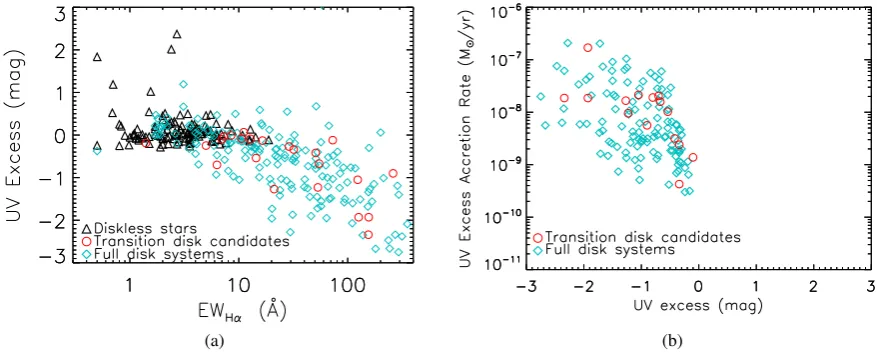
We show in Fig. 10a the UV excess versus EWHα. As
ex-pected, most stars classified as diskless do not accrete and do not present UV excess. Most full disk systems present UV ex-cess, while the transition disk candidates, in general, present UV excess comparable to full disk systems. The mean UV excess is 0.10±0.03 mag for diskless stars,−0.5±0.1 mag for transition disk candidates, and−0.60±0.06 mag for full disk systems.
With the UV excess, Venuti et al. (2014) calculated mass ac-cretion rates for a sample of TTS belonging to NGC 2264, shown in Fig. 10b. The mean mass accretion rate values for our sample of stars are (2±1)×10−8Myr−1for transition disk candidates and (2.1±0.4)×10−8Myr−1for full disk systems. The mean
accretion rates are different from the Hαaccretion rates, but also show that the accretion rates of the transition disk candidates are similar to the accretion rates of full disk systems.
5. Discussion
5.0.1. Photometric period
The CTTS are contracting and accreting; both physical phenom-ena should increase the stellar angular momentum. However, CTTS are found to be slow rotators, with typical periods of about 4 to 8 days in young clusters. Some efficient mechanism of angu-lar momentum transfer from the star to the disk or the interstelangu-lar medium must then take place. The accretion process is related to the CTTS braking, possibly through disk locking, since at the end of the accretion phase, WTTS start their spin-up toward the Main Sequence (Bouvier et al. 1993; Rebull 2001; Lamm et al. 2005; Cieza et al. 2007; Marilli et al. 2007; Irwin & Bouvier 2009; Vasconcelos & Bouvier 2015; Roquette et al. 2017; Venuti et al. 2017; Rebull et al. 2018).
The period distribution of young low-mass stars belonging to NGC 2264 shows that WTTS are substantially more rapid rota-tors than CTTS. These results were most recently obtained using CoRoT data from the 2008 (Affer et al. 2013) and 2011 (Venuti et al. 2017) campaigns. We analyzed the periodicity of our sam-ple of stars, using the periods obtained by Sousa et al. (2016) for some CTTS and by Venuti et al. (2017) for some CTTS and the WTTS: both papers use observations from the 2011 CoRoT campaign. We complemented our period data with photometric optical periods gathered from the literature in Flaccomio et al. (2006). The period distribution is shown in Fig. 11. Stars with full disks are slower rotators (mean period of 6.0 ±0.4 days) compared to diskless stars (mean period of 4.8±0.3 days). This result agrees with the disk locking scenario discussed in the pre-vious paragraph, since most full disk systems are CTTS and all diskless stars are WTTS. The mean period of the transition disk candidates is 7.8±1.0 days but the sample of periodic transition disk candidates is small compared to the diskless and full disk samples.
[image:9.595.39.277.65.247.2](a) (b)
Fig. 7. Hαcriteria (blue lines) to select CTTS and WTTS (White & Basri 2003). a) Hαequivalent width vs. spectral type. b) Hαequivalent width vs. Hαwidth at 10% of maximum intensity. Transition disk candidates are predominantly found among accreting systems. Therefore, the presence of a hole in the inner disk does not stop the accretion process, suggesting that gas is flowing through the hole. Systems for which we do not have data at 22/24µm are identified by gray filled symbols.
(a) (b)
Fig. 8. Distribution of Hαemission line parameters. (a) Hαequivalent width and (b) Hαwidth at 10% of maximum intensity of our sample of diskless stars (black), transition disk candidates (red) and full disk systems (light blue). Transition disk candidates distributions are more similar to the full disk systems than diskless stars, see the text.
classified by Sousa et al. (2016), as spot-like (sinusoidal varia-tions due stable spots at the stellar surface), AA Tau-like (quasi-periodical eclipse like light curves explained as occultation of the stellar photosphere by an inner disk warp (see Alencar et al. 2010; Cody et al. 2014; Fonseca et al. 2014; McGinnis et al. 2015, for more details about AA Tau-like light curves), and non-periodic light curves, which includes non-periodic occul-tations of the stellar photosphere by the inner disk, accretion bursts (Stauffer et al. 2014), and variations not associated with an unique physical phenomenon.
We classified all the 2011 CoRoT WTTS light curve using the same nomenclature, and we adopted the morphological clas-sification of the CTTS from Sousa et al. (2016). The distribu-tion of morphological classificadistribu-tions of the CoRoT light curve is shown in Fig. 12. Almost all (∼ 78%) of the diskless stars are classified as spot-like. As the light curve morphology is related
to system evolution (Sousa et al. 2016), diskless systems, which are no longer accreting, are expected to present spot-like light curves, as their photometric variability is mainly due to the cold surface spots.
[image:10.595.101.486.321.523.2]Fig. 9. Mass accretion rates from Hαequivalent width calculated by Sousa et al. (2016) as a function of Hαequivalent width. The error bar represents the night-to-night variability of the accretion rate.
disk (Alencar et al. 2010; Cody et al. 2014; Fonseca et al. 2014; McGinnis et al. 2015; Sousa et al. 2016), which is responsible for the occultation of the stellar photosphere, and they are com-mon acom-mong the anemic disks (Alencar et al. 2010; Sousa et al. 2016).
5.1. Transition disk candidates in NGC 2264 from the literature
Systems with near-IR deficits and mid to far IR emission ex-cess were initially associated with an inner disk hole by Strom et al. (1989), studying star-disk systems in the Taurus-Auriga star formation complex. Over the years, many new objects with inner holes were identified and have been studied in detail (Cal-vet et al. 2005; Najita et al. 2007; Espaillat et al. 2008; Muzerolle et al. 2010; Andrews et al. 2011; Manara et al. 2014; Bustamante et al. 2015).
Systems with inner disk holes have been identified in NGC 2264 by Sung et al. (2009), using Spitzer IRAC and MIPS data. The observed star-disk systems, in Sung et al. (2009), were clas-sified as pre-transition and transition disks, following Espaillat et al. (2008). If the SED flux at 8.0µm was smaller than the flux at 24µm, and if the sign ofαIRACandαIRAC−MIPS(the SED
slope between 8.0µm and 24µm) was different, the system was considered a candidate to have a hole/gap in the disk. Addi-tionally, these systems were classified as pre-transition disks if −0.3 >αIRAC > −1.8 and as a transition disk ifαIRAC < −1.8
(Sung et al. 2009).
Using these selection criteria, Sung et al. (2009) found 13 systems with pre-transition disks and 24 systems with transition disks belonging to NGC 2264. Among these 37 systems found by Sung et al. (2009), only 18 are part of the sample of stars analyzed in this work and only one of them was not classified as a transition disk candidate by us. We did not separate transition and pre-transition disks in our sample, and two systems (Mon-000177 and Mon-000961) of our transition disk candidates were classified as pre-transition disk by Sung et al. (2009).
Teixeira et al. (2012) found only three transition disks in NGC 2264. Their selection criteria were very strict and classified as transition disks only accreting systems that did not present dust in the inner disk (photospheres according to theαIRAC
clas-sification) and had excess at 24µm, indicating the existence of a thick outer disk. In our sample, we have only one star classi-fied as a photosphere that has available data at 24µm. This star accrete but does not present signs of an outer thick disk.
Rapson et al. (2014) also identified transition disks in their sample of stars from NGC 2264 observed with the Spitzer satel-lite. Their selection was based on photometric criteria. They classified as transition disks those Class III systems that have [5.8]−[24] > 2.5 mag or [4.5]−[24] > 2.5 mag and [3.6] < 14 mag, which are systems that have excess at 24µm. They clas-sified 44 systems as transition disks using these criteria, but only 26 are part of our sample. Among the 26 systems we have in common, our classification agrees with theirs for 17 transition disk candidates, while the other 9 systems were classified by us as full disks.
In this work we found seven new transition disk candidates belonging to NGC 2264 that had not been classified as transition disks before. These systems were classified as Class II or III by Sung et al. (2009) & Rapson et al. (2014). We identified these systems in Table 4 with an asterisk after the CSIMon ID.
5.2. Disk and inner hole characteristics
Disk parameters were computed by Hyperion SED fitting code. The size of the inner disk hole corresponds to the inner radius of the disk (Rin), which is an output parameter of Hyperion SED
fitting code (Robitaille 2017). As explained in Sec. 3.1, Rin is
the dust sublimation radius for model 2, that is composed of a star and a disk. In model 3, that includes a star and a disk with an inner disk hole, Rin, that can vary from 1 to 1000 Rsub. To
determine the sublimation radius, we used the empirical equation obtained by Whitney et al. (2004) for a fixed type of dust:
RSub
R? =
TSub
T?
!−2.085
, (1)
where TSubis the dust sublimation temperature (1600 K) and R?
and T?are the radius and effective temperature of the central star,
respectively. In Fig 13, we show the distributions of dust disk mass, the inner disk radii, and the external disk radii. The disk mass and the external disk radii are however only estimated val-ues and correspond to lower limits, since we do not have broad wavelength coverage.
The size of the inner disk hole (RH) is given by the inner
disk radius when it is larger than the sublimation radius. We cal-culated RHfor all transition disk candidates. Then we compared
the inner disk hole size with different characteristics of the star-disk system; see Figs. 14 and 15. In Table 4, we show the param-eters obtained by Hyperion SED fitting code for each transition disk candidate and the hole size inferred from the best model parameters.
(a) (b)
Fig. 10. UV excess as a function of Hαequivalent width (a) and mass accretion rate as a function of UV excess (b). More negative values indicate larger UV excess. The UV excess and mass accretion rate were calculated by Venuti et al. (2014) and the Hαequivalent width was measured by Sousa et al. (2016) & Dahm & Simon (2005). As expected, diskless stars do not present UV excess, while full disk systems do. Transition disk candidates, in general, present UV excess similar to stars with full disks, which is consistent with active accretion, as discussed in the text.
Table 4. Parameters obtained by Hyperion SED fitting code for sample of transition disk candidates.
Mon IDa Avb Distb T?b R?b Mdiskb RHc Rinb RSubc RMaxb ib
(pc) (K) (R) (M) (AU) (RSub) (AU) (AU) (o)
Mon-000040* 0.1 698.2 2832.0 0.91 0.0005293 5.85 419.1 0.0140 372.7 77.2 Mon-000120 1.2 698.2 3775.0 1.84 0.0001934 0.53 10.4 0.0514 472.9 21.9 Mon-000122* 0.8 693.4 4230.0 1.33 0.0008640 5.84 124.4 0.0469 112.0 76.7 Mon-000177 0.3 690.2 4590.0 2.66 0.002971 0.23 2.0 0.1114 951.0 55.2 Mon-000273 0.2 527.2 3738.0 1.31 1.844E-05 17.85 498.1 0.0358 1314.0 68.1 Mon-000280 0.5 699.8 3922.0 1.33 0.006200 0.09 2.2 0.0401 61.1 14.0 Mon-000296 0.6 758.6 5214.0 1.60 8.402E-06 0.12 1.4 0.0872 601.8 64.8 Mon-000314 0.3 701.5 2918.0 1.76 0.004796 3.58 125.1 0.0286 186.8 76.4 Mon-000328 0.2 753.4 3338.0 1.50 8.831E-07 3.51 108.5 0.0324 1093.0 9.3 Mon-000342* 0.3 916.2 3836.0 2.09 4.624E-08 18.42 306.7 0.0601 117.9 82.4 Mon-000433 1.2 726.1 3506.0 2.46 2.443E-06 7.39 126.0 0.0587 250.9 65.4 Mon-000452* 0.1 827.9 3605.0 2.35 3.533E-06 6.00 101.0 0.0594 1796.0 86.2 Mon-000502 1.4 662.2 4263.0 1.74 1.757E-05 9.43 150.7 0.0626 425.6 77.7 Mon-000637 1.1 756.8 3650.0 1.82 0.0005777 8.66 183.2 0.0473 1172.0 79.2 Mon-000676 0.3 712.9 3864.0 2.35 7.821E-05 8.50 123.6 0.0688 66.9 75.7 Mon-000771 0.3 744.7 5243.0 2.02 1.408E-06 77.93 696.8 0.1118 2331.0 83.7 Mon-000824 0.9 636.8 3864.0 2.35 7.821E-05 8.50 123.6 0.0688 66.9 3.6 Mon-000860 0.4 690.2 3807.0 0.90 0.0001289 4.34 170.2 0.0255 53.9 49.2 Mon-000879 0.3 966.1 3864.0 2.35 7.821E-05 8.50 123.6 0.0688 66.9 3.6 Mon-000937* 0.8 948.4 3563.0 3.20 6.025E-08 22.31 282.1 0.0791 314.0 72.1 Mon-000961 0.1 682.3 2723.0 1.15 0.0003476 0.28 17.1 0.0162 2359.0 56.0 Mon-000965 0.1 803.5 3028.0 2.05 0.001175 9.50 263.3 0.0361 1448.0 6.4 Mon-000997* 0.8 663.7 3374.0 1.00 2.228E-08 2.61 118.5 0.0220 270.4 57.9 Mon-001033* 0.5 756.8 3999.0 1.70 0.0009192 16.66 312.0 0.0534 221.4 65.8 Mon-001094 0.3 727.8 3948.0 1.70 2.806E-07 21.66 416.8 0.0520 112.7 19.8 Mon-001229 1.3 798.0 4063.0 1.41 0.0006760 0.59 12.9 0.0459 120.1 10.1 Mon-001287 1.9 814.7 3995.0 1.06 8.285E-08 2.64 79.8 0.0331 164.0 12.6 Mon-001308 0.3 774.5 5011.0 2.13 1.981E-06 20.18 188.7 0.1069 298.1 86.4
Notes.This table is ordered according to the Mon ID
(a)CSIMon is an internal identification of the CSI 2264 campaign. Here, CSI was omitted for brevity.(b)The model parameters of the best SED fitting: reddening
(Av), distance of the star to the Sun (Dist), central star temperature (T?) and radius (R?), disk mass (Mdisk), inner disk radius (Rin), outer disk radius (RMax) and
inclination of the system (i).(c)Parameters determined using parameters from SED fitting model.(*)New transition disk candidates identified in this work.
IR observational data (e.g., van der Marel et al. 2016). As dis-cussed in Merín et al. (2010), systems with larger hole sizes are also more easily found with IR spectra than photometric data. The other possibility is that the SED model used in this work, which has only a passive disk and does not take into account the heating of the disk due to accretion, tends to produce smaller disk holes, as reported by Merín et al. (2010).
Different mechanisms can be responsible for creating a hole in the inner disk. Photoevaporation of the inner disk by stellar radiation can open holes, but, in general, with small radii (RH<
10 AU) and for small mass accretion rates (. 10−9M
yr−1)
[image:12.595.110.485.335.611.2]Fig. 11. Period distribution of the samples of diskless stars (black), transition disk candidates (red), and full disk systems (light blue), that were analyzed in this work. Diskless stars are substantially more rapid rotators than full disk systems, as expected, since most stars with full disks are CTTS and most diskless stars are WTTS.
Fig. 12. Distribution of morphological classification of 2011 CoRoT light curve of our sample of TTS. The CTTS morphological classifica-tion was taken from Sousa et al. (2016), while the WTTS morphological classification is from this work. “SP” corresponds to spot-like, “AA” to AA Tau-like, “Ap” to aperiodic variations not related to a unique phys-ical phenomenon, “B” to eclipsing binary, “Acc” to accretion bursts, “Ext” to non-periodic extinction, “UNC” to unclassified light curves, and “NV” to non-variable light curves.
In Fig. 14a we plot the mass accretion rate as a function of the hole size and identify the region where the inner hole can be due to photoevaporation alone, according to the model by Owen et al. (2011) and Owen et al. (2017). As the WTTS do not accrete, we fix the mass accretion rate at 1×10⁻¹¹Myr−1for these systems
to show the position of these systems on the plot. We indicated the five systems that fall in the photoevaporation region in Fig.
14. We can see that almost all our transition disk candidates are outside of the region where photoevaporation can explain the inner disk hole. Our sample of non-accreting transition disks is small, and the four systems also present small inner holes (RH<
10 AU). Observed non-accreting transition disks with the largest holes are indeed rare (Owen 2016).
To analyze the relation of the hole size with the accretion process, we also plot the UV excess (Fig. 14b) and the Hα equiv-alent width (Fig. 14c) as a function of the hole size. Transition disk systems that present UV excesses (more negative values in the plot) tend to have larger holes compared to transition disk systems without UV excesses.
We analyzed the relation of the hole size with the IR emis-sion in the inner and outer disk and with theαIRACindex (Fig.
15). Transition disk candidates with lower emission in the inner disk tend to have large holes (Fig. 15a). Our data do not show a relation between the hole size and the mid-IR emission and the αIRACindex (Fig. 15bc).
Planet formation in the disk is one of the most plausible mechanisms to explain transition disk systems that present signs of accretion, despite the fact that the models do not explain all the observational characteristics of transition disks (Owen 2016; Ercolano & Pascucci 2017; Zhu et al. 2011). Considering the evolution sequence of a disk with a planet, as discussed by Owen (2016), when a newly formed planet is large enough to open a gap in the disk, it effectively traps the mm dust in the outer disk. At this point, the inner disk is still not dust free, and the SED looks like a full disk. After that, due to some mechanism that is not well understood, the inner disk turns almost dust free and the SED is consequently modeled as a disk with an inner hole, that correspond to an accreting transition disk system characterized to be mm-bright. During this phase, the young planet can then migrate to orbits with smaller radii (.10 AU). Consequently the dust from the outer disk can move to inner orbits due to disk vis-cosity, and the inner disk can be photoevaporated by radiation of the central star, forming non-accreting transition disks with small holes and bright in the mm or systems with a gap formed by photoevaporation of the outer disk. The current disk mod-els with a planet predict more non-accreting systems with large holes, and accreting systems with small holes and mm-bright, than found observationally (e.g., Owen 2016) and also confirmed with our sample (see Figure 14a). The systems that fall out of the region limited by the dashed lines in Figure 14a are good can-didates to have proto-planets in different stages. Exploring and modeling these systems using data from wavelengths long than 24µm is beyond the scope of this work.
In Figure 16 we show the mass and temperature of the central star (obtained byVenuti et al. (2014)) as a function of the disk hole size for our transition disk candidates. Kim et al. (2009) found a linear relation between the size of the disk hole and the mass and temperature of the central star for a sample of transi-tion disks belonging to Chamaeleon I, indicating the dependence of the hole size with the central star’s properties. In our sample of transition disk candidates, this tendency is not well defined in the plot. In Figure 16, we also overplotted literature data of semimajor axis of the orbit of confirmed exoplanets and their host star masses. Despite the fact that the masses and tempera-tures of our stars are slightly lower than the exoplanet host stars, the hole sizes (RH) of our transition disks and the semimajor axis
[image:13.595.52.266.361.570.2]Fig. 13. Distribution of disk parameters obtained by the SED model fitting of transition disk and full disk systems. (Left) Disk dust mass. (Middle) Disk inner radius. (Right) Disk outer radius. For the transition disk sample, the disk inner radius is the inner hole size and for the sample of full disk systems it corresponds to the dust sublimation radius. As the transition disk systems have a disk inner hole, the inner disk radius of the transition disk systems tends to be larger than the full disk systems. The disk mass and the external disk radii are however only estimated values and correspond to lower limits, see text.
(a) (b) (c)
Fig. 14. Accretion diagnostic as a function of disk hole size for transition disk candidates. (a) Mass accretion rates are from UV excess (pref-erentially) (Venuti et al. 2014) and from Hαequivalent width (Sousa et al. 2016). For WTTS, we fix the value of the mass accretion rate at 1×10⁻¹¹M
yr−1. The upside down triangles correspond to the upper limits of the mass accretion rate. The dashed line represents the region where
the inner hole can be explained by X-ray photoevaporation (Owen et al. 2011, 2017). Only∼18 % of our sample of transition disk candidates can be explained by X-ray photoevaporation of the inner disk by stellar radiation. (b) UV emission excess (Venuti et al. 2014). (c) Hαequivalent width (Sousa et al. 2016; Dahm & Simon 2005). Gray filled symbols identify systems that fall in the region where the inner disk hole can be explained by X-ray photoevaporation.
6. Conclusions
In this work we searched for transition disk candidates in the young cluster NGC 2264. Our sample of 401 TTS was observed with Spitzer equipped with IRAC instrument and MegaCam on CFHT, and corresponds to the star-disk systems with well de-fined stellar, disk, and accretion parameters. The main results of this work are described below.
We modeled the SEDs of 401 TTS with the Hyperion SED fitting code, using three different sets of models that correspond to a single stellar photosphere, a star with a full passive disk and a star with a passive disk and an inner disk hole. With the results of the model, we separated the star-disk systems into full disk systems (209 systems), diskless stars (164 systems), and transi-tion disk candidates (28 systems). The transitransi-tion disk candidates
represent 7 % of our sample and confirm that transition disks are a rapid phase of disk evolution.
We have shown that transition disk systems present Hα, UV excess, and mass accretion rates at the same level as accreting full disk systems. It shows that the presence of a hole in the in-ner disk does not stop the accretion process, since ∼ 82 % of our transition disk candidates still accrete, suggesting that gas is flowing through the disk hole, as found in transition disks from other star formation regions.
[image:14.595.45.556.306.484.2](a) (b) (c)
Fig. 15. Disk diagnostics as a function of disk hole size for our sample of transition disk candidates. (a) Near-IR color, (b) mid-IR color, and (c)
αIRACindex. Gray filled symbols identify systems that fall in the region where the inner disk hole can be explained by X-ray photoevaporation.
(a) (b)
Fig. 16. Mass and temperature of the central star obtained by Venuti et al. (2014) as a function of disk hole size. The overplotted data from the literature correspond to exoplanets with confirmed detection and the vertical axis is plotted as a function of the semimajor axis of the exoplanet orbit. Despite the fact that the masses and temperatures of our stars are slightly lower than the exoplanet host stars, the hole sizes of our transition disks and the semimajor axis of the exoplanet orbits are compatible. The data of the exoplanets and the host star were taken from http://exoplanet.eu. Gray filled symbols identify systems that fall in the region where the inner disk hole can be explained by X-ray photoevaporation. Our data do not show a clear linear tendency between the mass and the temperature of central star with the inner hole size, as seen in literature.
diskless stars, and dust emission in the outer disk like full disk systems, which is consistent with disk evolution from inside to outside, associated with photoevaporation of the inner disk by the stellar radiation or planet formation.
We estimated the hole size of our sample of transition disk candidates and found sizes from 0.09 to 78 AU with a mean value of 10.4±2.8 AU. Among our sample of transition disk candidates, only ∼ 18 % have small mass accretion rates (.
10−9M
yr−1) and small hole sizes (RH < 10 AU) that can be
explained by X-ray photoevaporation of the inner disk by stellar radiation. We also show that∼82% could be explained by planet formation in different evolutionary stages (with small and large hole sizes).
Acknowledgements. APS and SHPA acknowledge support from CNPq, CAPES and Fapemig. We also thank Laura Venuti and Julia Roquette for helpful discus-sions. This publication makes use of data products from the Two Micron All Sky Survey, which is a joint project of the University of Massachusetts and the In-frared Processing and Analysis Center/California Institute of Technology, funded
[image:15.595.134.469.299.473.2]Univer-Andrews, S. M., Wilner, D. J., Espaillat, C., et al. 2011, ApJ, 732, 42 Andrews, S. M., Wilner, D. J., Zhu, Z., et al. 2016, ApJL, 820, L40 Ansdell, M., Williams, J. P., van der Marel, N., et al. 2016, ApJ, 828, 46 Bouvier, J., Cabrit, S., Fernandez, M., Martin, E. L., & Matthews, J. M. 1993,
A&A, 272, 176
Bustamante, I., Merín, B., Ribas, Á., et al. 2015, A&A, 578, A23 Calvet, N., D’Alessio, P., Hartmann, L., et al. 2002, ApJ, 568, 1008 Calvet, N., D’Alessio, P., Watson, D. M., et al. 2005, ApJL, 630, L185 Calvet, N. & Gullbring, E. 1998, ApJ, 509, 802
Cieza, L., Padgett, D. L., Stapelfeldt, K. R., et al. 2007, APJ, 667, 308 Cieza, L. A., Schreiber, M. R., Romero, G. A., et al. 2010, ApJ, 712, 925 Clarke, C. J., Gendrin, A., & Sotomayor, M. 2001, MNRAS, 328, 485 Cody, A. M., Stauffer, J., Baglin, A., et al. 2014, AJ, 147, 82
Cody, A. M., Stauffer, J. R., Micela, G., Baglin, A., & CSI 2264 Team. 2013, Astronomische Nachrichten, 334, 63
Dahm, S. E. & Simon, T. 2005, AJ, 129, 829 Dullemond, C. P. & Dominik, C. 2005, A&A, 434, 971
Ercolano, B. & Pascucci, I. 2017, Royal Society Open Science, 4, 170114 Espaillat, C., Calvet, N., Luhman, K. L., Muzerolle, J., & D’Alessio, P. 2008,
ApJL, 682, L125
Espaillat, C., Ingleby, L., Hernández, J., et al. 2012, ApJ, 747, 103
Espaillat, C., Muzerolle, J., Najita, J., et al. 2014, Protostars and Planets VI, 497 Fang, M., Kim, J. S., van Boekel, R., et al. 2013, ApJS, 207, 5
Fang, M., van Boekel, R., Wang, W., et al. 2009, A&A, 504, 461 Fazio, G. G., Hora, J. L., Allen, L. E., et al. 2004, ApJS, 154, 10 Fitzpatrick, E. L. 1999, PASP, 111, 63
Flaccomio, E., Micela, G., & Sciortino, S. 2006, A&A, 455, 903
Fonseca, N. N. J., Alencar, S. H. P., Bouvier, J., Favata, F., & Flaccomio, E. 2014, A&A, 567, A39
Gaia Collaboration, Brown, A. G. A., Vallenari, A., et al. 2018, A&A, 616, A1 Gaia Collaboration, Prusti, T., de Bruijne, J. H. J., et al. 2016, A&A, 595, A1 Garaud, P., Meru, F., Galvagni, M., & Olczak, C. 2013, ApJ, 764, 146 Grant, S. L., Espaillat, C. C., Megeath, S. T., et al. 2018, ApJ, 863, 13 Gunn, J. E., Carr, M., Rockosi, C., et al. 1998, AJ, 116, 3040 Haisch, Jr., K. E., Lada, E. A., & Lada, C. J. 2001, ApJL, 553, L153 Hartmann, L., Calvet, N., Gullbring, E., & D’Alessio, P. 1998, ApJ, 495, 385 Hernández, J., Calvet, N., Briceño, C., et al. 2007, ApJ, 671, 1784
Hollenbach, D., Gorti, U., Meyer, M., et al. 2005, ApJ, 631, 1180 Hughes, A. M., Andrews, S. M., Espaillat, C., et al. 2009, ApJ, 698, 131 Indebetouw, R., Mathis, J. S., Babler, B. L., et al. 2005, ApJ, 619, 931 Ingleby, L., Calvet, N., Bergin, E., et al. 2011, APJ, 743, 105
Irwin, J. & Bouvier, J. 2009, in IAU Symposium, Vol. 258, IAU Symposium, ed. E. E. Mamajek, D. R. Soderblom, & R. F. G. Wyse, 363–374
Kim, K. H., Watson, D. M., Manoj, P., et al. 2013, ApJ, 769, 149 Kim, K. H., Watson, D. M., Manoj, P., et al. 2009, ApJ, 700, 1017 Koepferl, C. M., Ercolano, B., Dale, J., et al. 2013, MNRAS, 428, 3327 Konigl, A. 1989, ApJ, 342
Lada, C. 1987, in Star Forming Regions, Vol. 115, 1–17
Lada, C. J., Muench, A. A., Luhman, K. L., et al. 2006, ApJ, 131, 1574 Lamm, M. H., Bailer-Jones, C. A. L., Mundt, R., Herbst, W., & Scholz, A. 2004,
A&A, 417, 557
Lamm, M. H., Mundt, R., Bailer-Jones, C. A. L., & Herbst, W. 2005, A&A, 430, 1005
Luri, X., Brown, A. G. A., Sarro, L. M., et al. 2018, A&A, 616, A9 Manara, C. F., Testi, L., Natta, A., et al. 2014, A&A, 568, A18 Manara, C. F., Testi, L., Rigliaco, E., et al. 2013, A&A, 551, A107 Marilli, E., Frasca, A., Covino, E., et al. 2007, A&A, 463, 1081
McGinnis, P. T., Alencar, S. H. P., Guimarães, M. M., et al. 2015, A&A, 577, A11
Merín, B., Brown, J. M., Oliveira, I., et al. 2010, ApJ, 718, 1200
Muzerolle, J., Allen, L. E., Megeath, S. T., Hernández, J., & Gutermuth, R. A. 2010, ApJ, 708, 1107
Roquette, J., Bouvier, J., Alencar, S. H. P., Vaz, L. P. R., & Guarcello, M. G. 2017, A&A, 603, A106
Rosotti, G. P., Ercolano, B., Owen, J. E., & Armitage, P. J. 2013, MNRAS, 430, 1392
Safier, P. 1993, ApJ, 408, 115
Scally, A. & Clarke, C. 2001, MNARS, 325, 449 Shu, F., Najita, J., Ostriker, E., et al. 1994, ApJ, 429
Sousa, A. P., Alencar, S. H. P., Bouvier, J., et al. 2016, A&A, 586, A47 Stauffer, J., Cody, A. M., Baglin, A., et al. 2014, AJ, 147, 83
Strom, K. M., Strom, S. E., Edwards, S., Cabrit, S., & Skrutskie, M. F. 1989, AJ, 97, 1451
Sung, H., Stauffer, J. R., & Bessell, M. S. 2009, AJ, 138, 1116
Teixeira, P. S., Lada, C. J., Marengo, M., & Lada, E. A. 2012, A&A, 540, A83 van der Marel, N., Verhaar, B. W., van Terwisga, S., et al. 2016, A&A, 592, A126 Vasconcelos, M. J. & Bouvier, J. 2015, A&A, 578, A89
Venuti, L., Bouvier, J., Cody, A. M., et al. 2017, A&A, 599, A23 Venuti, L., Bouvier, J., Flaccomio, E., et al. 2014, A&A, 570, A82 Venuti, L., Bouvier, J., Irwin, J., et al. 2015, A&A, 581, A66 Walker, M. F. 1956, APJS, 2, 365
Werner, M. W., Roellig, T. L., Low, F. J., et al. 2004, APJS, 154, 1 White, R. J. & Basri, G. 2003, ApJ, 582, 1109
Whitney, B. A., Indebetouw, R., Bjorkman, J. E., & Wood, K. 2004, ApJ, 617, 1177
Wright, E. L., Eisenhardt, P. R. M., Mainzer, A. K., et al. 2010, AJ, 140, 1868 Zhu, Z., Nelson, R. P., Hartmann, L., Espaillat, C., & Calvet, N. 2011, ApJ, 729,
Table 2.Observational parameters of our sample of full disk systems.∗
Mon IDa TwoMass IDb SpTc EW
Hαd W10%Hαd EWHαe Classf α
IRACg R?h T?h UV
E xc.h M˙UVE xc.h M˙Hαd Disti
( ˚A) (kms−1) ( ˚A) (R) (K) (mag) (Myr−1) (Myr−1) (Pc)
Mon-000007 06415304+0958028 K7 c -1.47 4000. -0.650 6.0E-08
Mon-000017 06413199+1000244 K5 13.1 c -2.69 1.45 4395. -0.270 5.8E-09 694.0
Mon-000028 06410511+0958461 M3.5 294.5 c -1.64 0.57 3300. -1.400 7.4E-10 705.8
Mon-000056 06415315+0950474 K5 1.8 c -1.36 1.52 4395. 0.010 5.8E-09 756.8
Mon-000059 06410334+1000478 M4 c -1.44 0.76 3230. -1.110 1.2E-09 788.8
Mon-000063 06411193+0959412 M2.5 19.4 c -1.37 1.19 3430. -1.030 6.2E-09 748.9
Mon-000064 06411070+0957424 M1.5 3.5 w -1.15 1.62 3590. -0.320 4.7E-09 736.4
Mon-000080 06411795+1004021 M3 w -1.12 1.17 3360. -0.460 1.9E-09 723.2
Mon-000081 06405978+1002126 M2 155.0 c -1.01 1.00 3500. -1.340 5.4E-09 667.7
Mon-000090 06410896+0933460 M3 51.0 c -0.88 2.26 3360. -0.550 1.1E-08 786.6
Mon-000099 06411610+0926435 M4.5 w -1.44 1.16 3175. 0.360 1.1E-10 743.3
Mon-000103 06405954+0935109 K6 15.6 401 6.4 c -1.14 3.84 4200. 0.591 9.6E-09 658.2
Mon-000106 06405272+0928437 M0.5 c -1.40 0.74 3800. -1.260 1.3E-09 764.8
Mon-000113 06410028+0928341 K6 314.6 c -1.25 0.71 4200. -2.380 6.3E-09 672.4
Mon-000117 06405413+0948434 M2.5 353.0 c -2.34 1.21 3430. -2.090 3.4E-08 752.9 Mon-000119 06412100+0933361 K6 10.5 466 10.6 c -1.44 2.04 4200. -0.147 3.3E-09
Mon-000126 06405783+0941201 M0 26.4 c -1.09 2.02 3920. -0.540 2.1E-08 573.7
Mon-000136 06411599+0926094 M0 174.1 c -0.53 1.99 3920. -1.150 1.6E-08 792.4
Mon-000137 06404712+0942077 M2 11.4 c -1.54 1.36 3500. -0.360 2.9E-09 557.9
Mon-000145 06412346+0945586 K7 4.0 w -2.46 1.39 4000. 0.050 820.3
Mon-000153 06405990+0947044 M3 39.9 c -1.71 1.35 3360. -1.220 9.1E-09 791.7
Mon-000165 06410481+0944333 K4.5 92.9 c -0.62 0.76 4490. -1.580 1.5E-09 743.8 Mon-000168 06414287+0925084 K5:M0 44.9 390 86.0 c -1.38 1.20 4157. -1.450 1.1E-08 3.8E-09 776.0
Notes.Only a portion of this table is shown here. A full version is available at the CDS. This table is ordered according to the Mon ID.
(a)CSIMon is an internal identification of the CSI 2264 campaign. Here, CSI was omitted for brevity.(b)2Mass identification.(c)Spectral type obtained by Venuti
et al. (2014).(d)Hαparameters obtained using FLAMES spectra by Sousa et al. (2016). They used the convention that positive Hαequivalent width indicates Hαin
emission, and negative values correspond to Hαin absorption.(e)Hαequivalent width obtained by Dahm & Simon (2005).(f)Classification as CTTS (c) and WTTS (w) by Sousa et al. (2016) and Venuti et al. (2014).(g)α
IRACis the slope of the SED between 3.6µm and 8µm obtained by Teixeira et al. (2012).(h)Parameters
obtained using CFHT data by Venuti et al. (2014).(i)Distance from the Sun which was obtained from the Gaia parallax data, following (Luri et al. 2018). (*) The
Mon-000135 06405999+0928500 K7 1.7 w -2.59 1.64 4000. 0.009 752.9
Mon-000139 06405367+0958000 M1 3.2 w -3.16 1.36 3680. -0.145 709.2
Mon-000142 06404480+0949478 M2 5.5 w -3.01 1.13 3500. 0.100 726.1
Mon-000143 06410454+0926092 M3 3.8 w -2.80 1.03 3360. -0.000 772.1
Mon-000149 06411330+0951544 M1 2.0 w -2.69 1.25 3680. -0.081 733.5
Mon-000151 06411829+0928330 M0 6.2 w -2.66 0.94 3920. 0.030 759.8
Mon-000158 06404484+0946384 K0.5 w -3.80 1.05 5170. -0.626 660.7
Mon-000159 06405146+0937144 M1 3.4 w -4.65 1.38 3680. 0.055 701.9
Notes.Only a portion of this table is shown here. A full version is available at the CDS. This table is ordered according to the Mon ID.
(a)CSIMon is an internal identification of the CSI 2264 campaign. Here, CSI was omitted for brevity.(b)2Mass identification.(c)Spectral type obtained by Venuti
et al. (2014).(d)Hαparameters obtained using FLAMES spectra by Sousa et al. (2016). They used the convention that positive Hαequivalent width indicates Hα
in emission, and negative values correspond to Hαin absorption. The accretion rate attributed to WTTS, here represented by the diskless sample, corresponds to a contribution from nebular and chromospheric Hαline emission.(e)Hαequivalent width obtained by Dahm & Simon (2005).(f)Classification as CTTS (c) and WTTS
(w) by Sousa et al. (2016) and Venuti et al. (2014).(g)α
IRACis the slope of the SED between 3.6µm and 8µm obtained by Teixeira et al. (2012).(h)Parameters
[image:18.595.88.515.72.296.2]Fig. A.1. Spectral energy distribution of systems classified as full disks. The circles show data from the U band (0.3µm) to the MIPS 24µm band. The black solid line is the best fit to the SED (Robitaille 2017) and the dashed lines correspond to the stellar (blue) and dust (red) emission components (Robitaille 2011). The gray solid lines are all the model with (χ2−χ2