Ann. Geophys., 26, 1597–1604, 2008 www.ann-geophys.net/26/1597/2008/ © European Geosciences Union 2008
Annales
Geophysicae
Cross-tail velocity component in the plasma sheet fast flows
N. P. Dmitrieva
Institute of Physics, University of St-Petersburg, St-Petersburg, Russia
Received: 22 May 2007 – Revised: 3 December 2007 – Accepted: 18 December 2007 – Published: 11 June 2008
Abstract. The flux transfer in the magnetotail plasma sheet
is mainly provided by the tail-aligned fast plasma flows (Bursty Bulk Flows – BBFs). In this paper we study the events with a large cross-tail velocity component, including their occurrence and relationship to the standard BBFs. We found out that a significant part of largeVyevents are a sub-group connected with the BBFs propagation. The maximal deviation of the velocity vector from the X direction (about 40–50 degrees, on average) is observed near the BBFs’ lead-ing front in the sheath, where the fast flow interacts with sur-rounding plasma. The average variation of the velocity di-rection in the vicinity of the BBF resembles a plasma vortex. Our results support the model, in which the BBF represents a polarized, bubble-like flux tube, propagating through the plasma sheet.
Keywords. Magnetospheric Physics (magnetotail; plasma
convection) – Space plasma physics (transport processes)
1 Introduction
Interest in the fast plasma flows in the magnetospheric plasma sheet has been growing during the last decade. This is because the BBFs have probably a close relationship to the magnetic field reconnection in the tail and also due to their key role in the magnetotail transfer (Baumjohann et al., 1990; Baumjohann, 2002; Angelopoulos et al., 1994). Indeed, as known, the BBFs provide from 50% (Sch¨odel et al., 2001) up to 80% (Angelopoulos et al., 1994, 1996) of the plasma and magnetic flux transport.
Previous studies revealed and described the average char-acteristics of the fast plasma flows (Angelopoulos et al., 1994; Ohtani et al., 2004). The main properties of the BBF proper are: (1) the plasma density and pressure are Correspondence to: N. P. Dmitrieva
reduced, (2) the temperature is enhanced; (3) the magnetic field displays the bipolarBz variation and a |Bx|decrease. These characteristics are in agreement with the BBF being a plasma-depleted, electrically-polarized plasma tube (plasma bubble). A simple analytical model for the bubble propaga-tion has been developed by Pontius and Wolf (1990), Chen and Wolf, (1993), whereas a pattern of the plasma flow near the bubble has been obtained among other results in the MHD simulation by Birn et al. (2004). At geocentric dis-tances>15RE near midnight (where the BBFs are most fre-quently observed) the flux tube plane lies near the XZ plane, and the velocity direction at the plasma sheet should nearly coincide with the X axis. Indeed, this was confirmed by the experimental data by Angelopoulos et al. (1992, 1994).
1598 N. P. Dmitrieva: Cross-tail velocity component in the plasma sheet fast flows
9 -8 -12 -16 -20 -24 -28 -32
XGSM, Re
0.00 0.05 0.10 0.15 0.20 0.25 0 0.04 0.08 0.12 0.16 Oc c u rr e n c e V x 0 0.02 0.04 0.06 0.08 0 0.002 0.004 0.006 0.008 0.05 0.10 0.15 0.004 0.008 0.012 0.016
-20 -10 0 10 20
YGSM, Re
0 0.02 0.04 0.06 0.08 0.04 0.08 0.12 0.10 0.20 0 0.002 0.004 0.006 0.008 0 0.004 0.008 0.012 Oc c u rr e n c e V y 0.02 0.06 0.10 0.14 Vthr=200 km/s
Vthr=400 km/s
Vthr=600 km/s 81271 samples Vx
33968 samples Vy
33671 samples Vx 3967 samples Vy
15632 samples Vx
575samples Vy
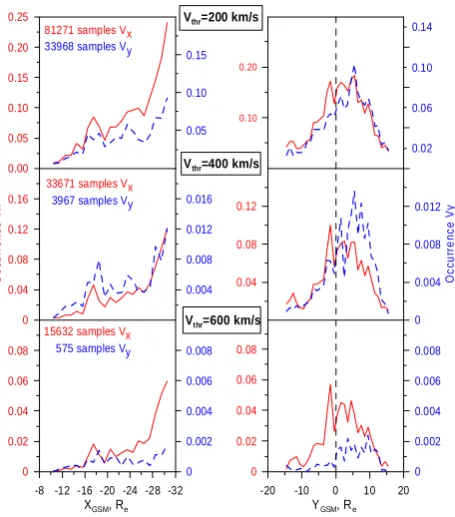
Figure 1 Occurrence frequency of the |Vx|>Vthr (red) and |Vy|>Vthr (blue) samples depending on the X (left column) and Y (right column) GSM coordinates for three different velocity thresholds (200,400 and 600 km/s).The number of events for each distribution is indicated.
Fig. 1. Occurrence frequency of the|Vx|>Vthr(red) and|Vy|>Vthr (blue) samples, depending on the X (left column) and Y (right col-umn) GSM coordinates for three different velocity thresholds (200, 400 and 600 km/s). The number of events for each distribution is indicated.
The aim of the present work is to study the spatial distribu-tion of the largeVyion bulk flows (Sect. 2), the relationship of this transverse component with the BBFs (Sect. 3), and the flow rotation near the BBF front (Sect. 4). The last section provides a summary of results and discussion.
2 Occurrence of strongVyflows
In this section each 12-second sample with|Vy|>Vthr(where Vthris a threshold value) is considered as a separate event. Three threshold values are tried: Vthr=200, 400, 600 km/s. Also all events with|Vx|>Vthr(same threshold) are used to compare the|Vy|>Vthrand|Vx|>Vthrdistributions. The oc-currence frequency is defined as the ratio of the event number in the certain spatial bin to the number of all 12-second vations in the same area. Our study is based on Geotail obser-vations made between May 1995 and May 1999. Magnetic field components and plasma parameters (12-s averages) are used. Only the measurements in the region X<−15RE,
−15<Y<20REin the inner plasma sheet (plasma parameter β>0.5) are considered.
The occurrence frequency distributions in X and Y GSM coordinates are presented in Fig. 1 for three threshold val-ues. Each point in the right (left) panel shows the|Vy|>Vthr and|Vx|>Vthroccurrence in the 1RE X (Y) interval for all
10
10 -8 -12 -16 -20 -24 -28 -32
XGSM, Re
0 0.02 0.04 0.06 0.08 0 0.004 0.008 O c cu rr en ce V x > 0 0 0.0004 0.0008 0.0012 0 0.0004 0.0008 0.0012 0.02 0.04 0.06 0.08 0.004 0.008
-20 -10 0 10 20
YGSM, Re
0 0.0004 0.0008 0.0012 0.0016 0.004 0.008 0.012 0.04 0.08 0 0.0004 0.0008 0.0012 0.0016 0 0.004 0.008 0.012 O c c u rr enc e V x < 0 0 0.04 0.08 0.12
Vthr=200 km/s
Vthr=400 km/s
Vthr=600 km/s
NVy>0=23171
NVy<0=10798
NVy>0=2845
NVy<0=1123
NVy>0=407
NVy<0=169
Figure 2 Occurrence of the |Vy|>Vthr for Vy>0 (red) and Vy<0 (blue) samples depending on X (left column) and Y (right column) GSM coordinates for different velocity thresholds (200 and 400 km/s).
Fig. 2. Occurrence of the|Vy|>Vthr forVy>0 (red) and Vy<0 (blue), depending on the X (left column) and Y (right column) GSM coordinates for different velocity thresholds (200, 400 and 600 km/s).
Y (X) values. Figure 1 shows that|Vy|and|Vx|distributions are similar for eachVthr value, although their probabilities are different: the frequency of large|Vx|values strongly ex-ceeds the frequency of the large|Vy|values (by 2 to 15 times, depending on the threshold value and the observation re-gion). There are some common features of the|Vy|and|Vx| distributions. First, their occurrence increases in the tail-ward direction, maximizing at ther∼30RE (outer limit of the Geotail orbit used in this study). Second, both have a maximal frequency in the central sector of the tail, the ma-jority of|Vx|>Vthrand|Vy|>Vthrevents being observed at
−10RE<Y <10RE. The major difference is the appreciable shift of the|Vy|distribution maximum towards dusk.
[image:2.595.55.283.62.321.2] [image:2.595.297.542.64.323.2]N. P. Dmitrieva: Cross-tail velocity component in the plasma sheet fast flows 1599
11
11
-1000 -600 -200 200 600 1000
km/s
0 400 800 1200 1600 2000 2400
numbe
r of events
0 400 800 1200 1600
num
ber of
event
Vy
Vy-45
(
a)
(
b)
Figure 3 Histogram of the large cross-tail velocity component occurrence : a) the original Vy distribution (for |Vy|>400 km/s), b) the drift-shifted distribution of |Vy-45km/s| .
Fig. 3. Histogram of the large cross-tail velocity component
occur-rence: (a) the originalV ydistribution (for|V y|>400 km/s), (b) the drift-shifted distribution of|V y−45 km/s|.
V∼40 km/s component found by Kaufman et al. (2001) on the duskside, but it is larger than theV∼18 km/s obtained by Hori et al. (2000) atX=−15REin the midnight meridian.
3 Relationship of large Vy events with the high-speed
plasma streams in the tail
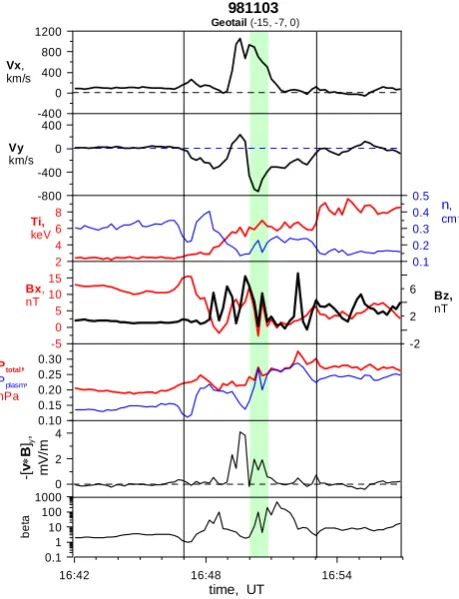
The similarity of large|Vy|and|Vx|flow occurrences sug-gests a possible relationship of large|Vy|events to the fast Vxflows. Our survey of individual events shows that during the isolatedVxenhancement above the average level (that is, above several tens km/s, according to Kaufmann et al., 2001), theVyflows often display a complicated variation at smaller time-scale. In this case the episodes withVy>Vthrare shorter than those withVx>Vthrfor the same threshold value. An ex-ample is given in Fig. 4, where the interval ofVy>400 km/s (∼40 s) is highlighted in green and the Vx>400 km/s time interval (∼6 min) is marked by the vertical lines. In these events one typically observes the|Vx|enhancement, the den-sity and pressure reduction and the temperature growth at the beginning of the flow burst, which are the well-known BBF attributes (see Angelopoulos et al., 1994; Ohtani et al., 2004).
12
12
16:42 16:48 16:54
time, UT
-400 0 400 800 1200 Vx, km/s
0 2 4
-[
v
∗
B
]y
,
m
V
/m
-800 -400 0 400 Vy km/s
2 4 6 8 Ti, keV
-5 0 5 10 15 Bx, nT
0.10 0.15 0.20 0.25 0.30 Ptotal,
Pplasm,
nPa
0.1 0.2 0.3 0.4 0.5
n, cm-3
-2 2 6
Bz, nT
0.1 1 10 100 1000
bet
a
981103 Geotail (-15, -7, 0)
[image:3.595.312.542.64.364.2]Figure 4 Variation of the plasma parameters and magnetic field components observed on 4 Sept. 1997. The time interval with |Vy|>400 is highlighted.
Fig. 4. Variation of the plasma parameters and magnetic field
com-ponents observed on 4 September 1997. The time interval with |V y|>400 is highlighted.
In this section we study the average characteristics of large
|Vy| events. The event is here defined as an interval, satis-fying the following conditions: (1)|Vy|max>400 km/s., (2) β>0.5 before the front of the fast stream (that is the BBF is observed in the CPS region). A briefβ value decrease be-low 0.5 is albe-lowed inside the event due to strong magnetic field and plasma parameters variations. (3) To obtain a more distinct picture at the front, we consider only those events, which had |Vy|<200 km/s during at least 5 min before the BBF onset. The last requirement strongly reduces the num-ber of selected events.
[image:3.595.49.280.65.368.2]1600 N. P. Dmitrieva: Cross-tail velocity component in the plasma sheet fast flows13
13
-8 -4 0 4 8
relative time, min
0 100 200 300 400 |Vx|, km/s
-0.5 0 0.5 1 1.5
-[v∗B]y, mV/m
0 100 200 300 400 |Vy| km/s
4.4 4.8 5.2 Ti, keV
3 4 5 |Bx|, Bz, nT
0.13 0.14 0.15 0.16
Pplasma,
nPa
0.16 0.18 0.2 0.22 0.24
n, cm-3
5.6 6.4
be
ta
N=98
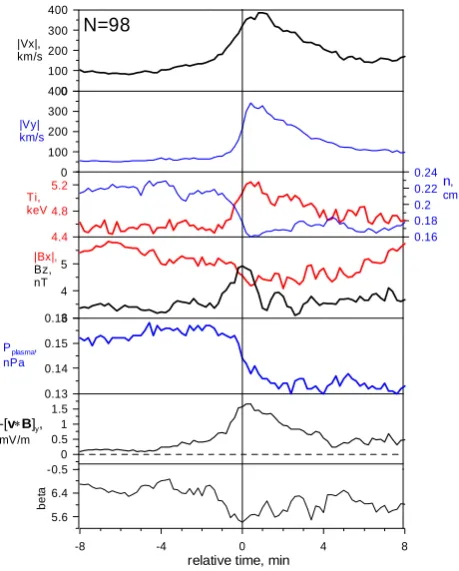
Figure 5 Average velocity, magnetic field and plasma parameter variations for |Vy|>400 km/s events, resulting from the superposed
epoch analysis. Reference time is defined as the start of sharp |Vy|
[image:4.595.51.281.62.348.2] [image:4.595.311.542.64.355.2]growth above 200 km/s.
Fig. 5. Average velocity, magnetic field and plasma parameter variations for|Vy|>400 km/s events, resulting from the superposed epoch analysis. Reference time is defined as the start of sharp|Vy| growth above 200 km/s.
not coincide, so the average picture blurs. Figure 5 confirms the suggestion about a close relationship between the large Vy events and the BBFs: the averaged |Vx| peak value ex-ceeds the|Vy|peak value, and the magnetic field and plasma variations are analogous to those obtained in Angelopoulos et al. (1994) and Ohtani et al. (2004) for the BBFs.
The analysis of the largeVyandVxspatial distributions in the previous section showed that for the fixedVthrthe proba-bility of large|Vy|values is much smaller than that of large
|Vx|(∼10-fold forVthr=400). Does it mean that only a small part of the BBFs has a largeVy-component, or is this because the|Vy|>Vthrevents have a smaller space-time scale as com-pared to the BBFs? What is the ratio of the maximum|Vx| and|Vy|values in the fast flows in the plasma sheet?
To obtain the answers we studied the BBFs (all inter-vals with |Vx|>400 km/s, in total – 1022 isolated events), using the same criteria as applied above for the large|Vy| events. After many attempts, we present here (Fig. 6) the average characteristics obtained by the superposed epoch analysis with a reference time, corresponding to the plasma pressure maximum during a 1-min interval just before the sharp|Vx|growth. In our opinion this epoch time may cor-respond to the boundary between the background plasma, grabbed at the BBF front, and the depleted plasma flux
14
-8 -4 0 4 8
relative time, min
0 100 200 300 400 500
|Vx|, km/s
-0.5 0 0.5 1 1.5
-[
v
∗
B
]y
,
mV
/m
80 120 |Vy| km/s
4 4.1 4.2 4.3 4.4
Ti, keV
3 4 5 6 7 |Bx|, Bz, nT
0.12 0.14 0.16
Ppl
as
m
a
,
nP
a
0.2 0.22 0.24 0.26 0.28
n, cm-3
4 5 6 7
bet
a
N=1022
Figure 6 The same as in Fig. 5 for events with |Vx|>400
Fig. 6. The same as in Fig. 5 for events with|Vx|>400 km/s.
tube (the BBF proper). The average picture of the BBF-associated plasma parameters and magnetic field variations is similar to that obtained by Ohtani et al. (2004) in all as-pects, except theVy component magnitude. According to our data|Vy|>400 km/s (300 km/s) is observed for, respec-tively, 21% (43%) of all events when|Vx|>400 km/s. More-over, the events for which|Vy|is small (<100 km/s) are rare (∼3%). Average duration of the time interval when |Vy| exceeds 200 km/s is ∼3 min (Fig. 5). The corresponding time interval for|Vx| is∼6 min (Fig. 6). The average ra-tio (R=|Vy|max/|Vx|max)between|Vx|and|Vy|peak values for all events with|Vx|>400 km/s was found to beR=0.45.
4 Plasma flow structure near the BBFs’ front
N. P. Dmitrieva: Cross-tail velocity component in the plasma sheet fast flows 1601
15
15
-4.00 -2.00 0.00 2.00 4.00
relative time, min
0 100 200 300 400 Vx, km/s
0 0.4 0.8 1.2
-[
v
∗
B
]y
,
m
V
/m
-40 -20 0 20 40 60
Vy
km/s
3.7 3.8 3.9 Ti, keV
6 7 8 |Bx|, nT
0.12 0.13 0.14 0.15 0.16 0.17
Ppl
a
s
m
,
nP
a
-20 0 20
α deg.
0.2 0.24 0.28
n, cm-3
2.5 3.5 4.5
Bz, nT
3 4 5 6 7
bet
a
N=383 Vx>0 ∆
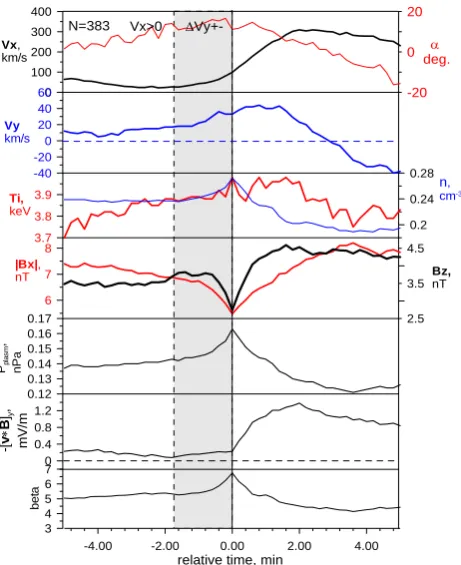
[image:5.595.52.283.61.344.2]Vy+-Figure 7 Average velocity, magnetic field and plasma parameter variations for one group of the earthward moving fast flows. Reference time is defined as the time of the plasma pressure maximum
Fig. 7. Average velocity, magnetic field and plasma parameter
vari-ations for one group of the earthward moving fast flows. Reference time is defined as the time of the plasma pressure maximum.
To study the flow morphology near the BBF front, all 1022 events found in the previous section were divided into 4 groups. First of all, they were separated by theVxflow direc-tion (818 earthward flows and 204 tailward flows). Besides, most of the events were found to display the change in the Vysign; see e.g. Fig. 4. Therefore, each group was split into two groups, depending on theVysign change: from positive to negative or vice versa. Afterwards, the average portrait of each group was obtained, using a superimposed epoch anal-ysis, and the relationship between the times ofVy maxima and minima was also studied.
We are reminded that the T0 value in the superimposed epoch analysis was defined at the plasma pressure maximum. The result is illustrated in Fig. 7 for one group of events (with Vx>0 andVy changing sign from positive to negative). Re-sults for the other groups of events are similar in main fea-tures. Besides the typical BBF characteristics, two interest-ing features should be noted. First, one can see in Fig. 7 the region of BBF interaction with the surrounding plasma (highlighted), which is characterized by a smooth increase in velocity, density, plasma pressure and electric field before the crossing of a sharp BBF leading front (atT0). The av-erage time scale is 1–2 min, for the avav-erage plasma velocity
∼70–150 km/s it gives the size of this interaction region∼1– 3RE. The second feature is theVy variation. The absolute
16
16
+
-+
+
(
c)
SC
-2 -1 0 1 2 3 4 5
∆t, min 0
0.1 0.2 0.3
re
lat
ive f
reque
nc
y
0 0.04 0.08 0.12 0.16 0.2
re
la
ti
ve f
requency
-100 -80 -60 -40 -20 0 20 40 60 80 100
α, degree 0
0.05 0.1 0.15 0.2 0.25
re
la
ti
ve f
requ
ency
Tmin-T0
Tmax-T0
α_max α_min
(
a)
(
b)
Fig. 8. (a) Histograms of the time delay of the maximal velocity
deviation to dusk (top) and to dawn (bottom) relative to the time of BBFs’ front pass; (b) histograms of the maximal velocity deviation values: to dawn (left) and to dusk (right); (c) the scheme of the plasma motion (red vortexes) around BBF (blue oval) in the XY plane.
Vy value increases in the interaction region, Vy reaches its first extreme near the front, then decreases, changes its sign and reaches the second extreme somewhere in the BBF trail-ing part. The trailtrail-ing part may be roughly determined based on the average BBF duration of about ten minutes. Note that a similarVyvariation would be observed when crossing the vortex. The vortex-like variation is more clear when consid-ering the angle of the V vector deviation (α)from the X axis (the red line in the upper panel of Fig. 7, corresponding to the right vertical axis).
[image:5.595.311.543.64.330.2]1602 N. P. Dmitrieva: Cross-tail velocity component in the plasma sheet fast flows
17
-2 -1 0 1 2 3 4 5
0 0.04 0.08 0.12 0.16 0.2
0 0.04 0.08 0.12 0.16 0.2
-600 -400 -200 0 200 400 600 800
0 0.1 0.2 0.3 0.4
Tmin-T0
Tmax-T0
Vy_max Vy_min
(a)
(b)
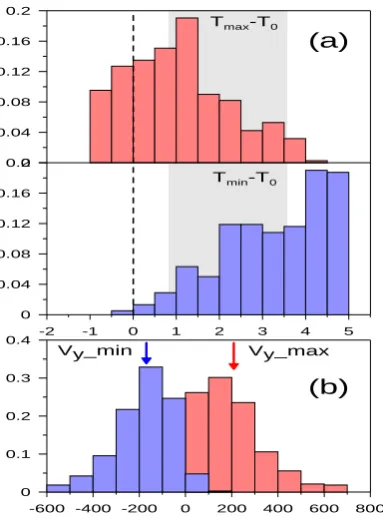
Figure 9 a) Histograms of the time delay of the maximal (top) and minimal (bottom) Vy velocity value relative to the time of BBFs front pass (dashed line); b) histograms of the minimal (left) and maximal (right) Vy value
Fig. 9. (a) Histograms of the time delay of the maximal (top) and
minimal (bottom)Vyvelocity value relative to the time of the BBFs’ front pass (dashed line); (b) histograms of the minimal (left) and maximal (right)Vyvalue.
somewhat shifted inside the flows on average. The time delay between the first and second extremes is about 3 min (highlighted by the shaded band), giving a distance estimate
∼7RE, comparable with the BBF scale in the X direction for the average plasma speed inside the BBF∼250 km/s. The extremeαvalues vary in a broad range without clear peak. This can be due to different spacecraft locations relative to the BBFs central line (see the scheme in Fig. 8). Though αextremes, on average, are observed near the leading and back BBF fronts, they are frequently reached inside the BBF. Particularly, about half of the events are in the time range be-tween the first and second extremes, inside the color band in Fig. 8.
Note that the large α value may result from a smallVx outside the fast flow rather than from a largeVy value. To test the relationship between extremesαandVywe analyzed Vymax andVymin values and their registration times in the same way as it was done above for theαmaxandαminvalues. The result of this analysis (Fig. 9) looks very similar to the previous result forα: the firstVy extreme is observed near the BBF front, the average time delay between the first and second extremes is about 3 min. The median valueVymax (Vymin)is 202 km/s (−180 km/s).
The study of tailward BBFs (Vx<0) showed similar ve-locity components variations – Fig. 10. However, there are some differences. In particular, the plasma density grows
-4 -2 0 2 4
relative time, min
-400 -300 -200 -100 0 100
Vx, km/s
-0.8 -0.4 0 0.4
-[
v
∗
B
]y
,
mV/m
-40 0 40 80 120
Vy
km/s
4 4.4 4.8
Ti,
keV
6 7 8 9 10 11
|Bx|, nT
0.08 0.12 0.16 0.20 0.24
Ptotal,
Pplasm,
nPa
0.2 0.24 0.28 0.32 0.36
n, cm-3
0.5 1.5 2.5 3.5
Bz,
nT
2 3 4 5
be
ta
N=97 Vx<0
[image:6.595.72.264.61.321.2]
Fig. 10. The same as in Fig. 7 for one group of the tailward moving
fast flows.
not only before the leading BBF front, but also during some time after its crossing, different from the earthward flows. The density change in both cases is about 20% of the back-ground value. Note that according to the Pontius and Wolf (1990) bubble scenario, the tailward flows should be denser than the surrounding plasma, and their electric field should be negative. Our results show that near the front of a tail-ward flux a bipolarEy=−[V×B]y variation is observed: a negative pulse lasting about 2 min with a minimum near the BBF front followed by theEy reversal. The amplitudes of the positive and negative pulses are approximately the same (±0.5 mV/m), being about one-third of their peak value in the earthward BBFs.
The Vy extreme values and their observation time rel-ative to the BBF front are basically the same in the tail-ward and earthtail-ward flows, excluding the value of the ratio
|Vy|max/|Vy|min. For tailward flows this ratio is about 2.8, as compared to∼1.3 for the earthward ones.
5 Discussion
[image:6.595.314.541.64.354.2]N. P. Dmitrieva: Cross-tail velocity component in the plasma sheet fast flows 1603
|Vy|max/|Vx|max=0.47 ratio obtained in the present study gives the average angle of velocity vector deviation from the tail axis equal to 25 degrees. This value agrees with that ob-tained by Baumjohann et al. (1990) for distances less than 20RE. As follows from our results (Figs. 5 and 6), this an-gle is not constant during the BBF passage. The variation of the velocity angle resembles the variation expected dur-ing the passage of a plasma vortex, which is predicted by the bubble model of fast flows (Pontius and Wolf, 1990; Birn et al., 2004). According to it, we should observe a clockwise velocity vector rotation on the dawn side of the BBF, and an anticlockwise rotation on its dusk side. So the sign of the Y component of the plasma velocity near the leading edge of the BBF should coincide with the sign of the Y component of the outward normal, being negative at the BBF dawn side and positive at its dusk side. Such a correspondence was found in several cases by Sergeev et al. (1996). In fact, the flow struc-ture near the BBF front is usually more complicated than in the idealized model considered by Pontius and Wolf (1990). We have only one observation point, so we do not know whether we are at the dawn or dusk side of the fast flow in each event. However, when analyzing such a large number of events (1022 events in our analyses) we believe that the spacecraft position at the dawn or dusk sides of the BBF are equiprobable. If our interpretation of theVyvariation as the feature of the passing plasma vortex is correct, we would observe the clockwise variation for a dawnward spacecraft position (like in 436 events in the earthward flows.) and an-ticlockwise for the duskward position (as in 382 events) The corresponding numbers for tailward flows are 97 and 107. So the probability to observe both kinds of rotation is nearly the same, corresponding to the equal probability to pass through the fast flows at the dawn or dusk side.
As an additional test we used the results of Nakamura et al. (2001), where the normal to the BBF frontal boundary was determined for 14 events using the Geotail data. For all events from their list we considered the sign of the cross-tail Vy-component near the BBFs’ front, using the plasma pres-sure peak as an indication of the BBF front crossing. In this comparison for 13 events the signs of theVy andny com-ponents agree with each other. In the single (opposite sign) event theny/nxratio was∼0.2 (suggesting the measurements made near BBF center) as compared to its value between 0.5 and 1.5 for 13 remaining events.
According to our results, the spatial size of the consid-ered typicalVyvelocity disturbance along the X-axis is∼7– 10RE. That’s why the BBF-associatedVy-component dis-cussed here cannot be a manifestation of the local, small-scale plasma sheet irregularities.
Based on the obtained results we suppose that a consider-able part of observed largeVyplasma velocity component is connected with the passage of a polarized flux tube (BBF), causing the vortex plasma motion.
The pattern of plasma motion, obtained here, differs from the theoretical model in one important point. According to
our data, the plasma behind the BBF front is also involved in the vortex motion, together with the background plasma. Indeed, the extremeα values are often observed inside the BBF but not near its front. Partly this may be due to the com-plex BBFs structure, since usually we do not observe isolated high-velocity pulses, but a superposition of interacting flows. So the former BBF is the background for the next one, in that case the vortex motion may arise from (and be modified by) their collision.
Similar average magnetic field and plasma variations are observed for all velocity thresholds (200, 400 and 600 km/s), with the occurrence frequency of fast flow observation quickly growing with a decrease in the threshold value. The velocity variation at the BBF front is similar to the obstacle streamline. Note that in the majority of the events we can ob-serve the plasma vortex clearly only near the leading BBFs’ front. The whole vortex can be seen unperturbed only dur-ing the passage of very rare short isolated flows. In reality, we often observe a long complicated variation resulting from the interaction of different individual fast flows passing at different trajectories and having differentVxpeak velocities. Note that in the majority of events we can observe the plasma vortex clearly only near the leading BBFs’ front, where the vortex-associated flow tends to be directed toward the flanks. Besides, the main convection component in the middle tail during the quiet periods (without BBFs) is the dawn-dusk drift velocity. Taking into account the substantial contribu-tion of the fast flows to the conveccontribu-tion, we can expect that the vortex plasma motion, accompanying the BBFs, plays a significant role in the formation of a cross-tail component of the average convection pattern (Hori et al., 2000; Kaufmann et al., 2001).
6 Conclusions
A significant part of the observed cross-tail plasma velocity component can be understood as a result of the fast flows’ interaction with the background plasma and with each other. The scale of the interaction region at the leading front is about 1–3RE. LargeVyvelocity component probably arises from vortex plasma motion in the vicinity of the BBF front, which may be explained based on the model of the polarized plasma bubbles. The average vortex size in the direction of propagation is about 10RE.
Acknowledgements. We thank V. Sergeev, M. Shukhtina and
E. Timofeev for helpful comments. The work was partially sup-ported by INTAS grant No 03-51-3738 and RF Ministry of Educa-tion grant “Intergeophysics” No 2.2.2.2.2190. RFBR grant 07-02-91703.
References
Angelopoulos, V., Baumjohann, W., Kennel, C. F., et al.: Bursty bulk floes in the inner central plasma sheet, J. Geophys. Res., 97, 4027–4039, 1992.
Angelopoulos, V., Kennel, C. F., Coroniti, F. V., Pellat, R., Spence, H. E., Kivelson, M. G., Walker, R. J., Baumjohann, W., Feldman, W. C., Gosling, J. T., and Russell, C. T.: Characteristics of ion flow in the quiet state of the inner plasma sheet, Geophys. Res. Lett., 20, 1711–1714, 1993.
Angelopoulos, V., Kennel, C. F., Coroniti, F. V., et al.: Statistical characteristics of bursty bulk flow events, J. Geophys. Res., 99, 21, 257–21, 280, 1994.
Angelopoulos, V., Coroniti, F. V., Kennel, C. F., et al.: Multipoint analysis of a bursty bulk flow event on 11 April 1985, J. Geophys. Res., 101, 4667–4689, 1996.
Baumjohann, W. and Paschmann, G.: Characteristics of high-speed ion flows in the plasma sheet, J. Geophys. Res., 95, 3801–3809, 1990.
Baumjohann, W.: Modes of convection in the magnetotail, Phys. Plasmas, 9, 3665–3667, 2002.
Birn, J., Raeder, J., Wang, Y. L., et al.: On the propagation of bubbles in the geomagnetic tail, Ann. Geophys., 22, 1773–1786, 2004,
http://www.ann-geophys.net/22/1773/2004/.
Borodkova, N. L., Yahnin, A. G., Lion, K., et al.: Plasma sheet fast flows and auroral dynamics during substorm: a case study, Ann. Geophys., 20, 341–347, 2002,
http://www.ann-geophys.net/20/341/2002/.
Chen,C. X. and Wolf, R. A.: Interpretation of high-speed flows in the plasma sheet, J. Geophys. Res., 21, 409–418, 1993.
Hori, T., Maezawa, K., Saito, Y., et al.: Average profile of ion flow and convection electric field in the near-Earth plasma sheet, Geo-phys. Res. Lett., 27, 1623–1626, 2000.
Kaufmann, R. L., Bryan, M. B., Paterson, W. R., et al.: Plasma sheet thickness and electric current, J. Geophys. Res., 106, 6179–6193, 2001.
Nakamura, R., Baumjohann, W., Sch¨odel, R., et al.: Earthward flow bursts, auroral streamers, and small expansions. J. Geophys. Res., 106, 10 791–10 802, 2001.
Nakamura, R., Baumjohann, W., Moukis, C., Kistler, L. M., Runov, A., Volwerk, M., Asano, Y., V¨or¨os, Z., Zhang, T. L., Klecker, B., R`eme, H., and Balogh, A.: Spatial scale of high-speed flows in the plasma sheet observed by Cluster, Geophys. Res. Lett., 31, L09804, doi:10.1029/2003GL019558, 2004.
Ohtani, S., Shay, M. A., and Mukai, T.: Temporal structure of the fast convective flow in the plasma sheet: comparison between observations and two-fluid simulations, J. Geophys. Res., 109, A03210, doi:10.1029/2003JA010002, 2004.
Pontius Jr., D. H. and Wolf, R.A.: Transient flux tubes in the terres-trial magnetosphere, Geophys. Res. Lett., 17, 49–52, 1990. Sch¨odel, R., Baumjohann, W., Nakamura, R., et al: Rapid flux
transport in the central plasma sheet, J. Geophys. Res., 106, 301– 313, 2001.
Sergeev, V. A. and Lennartsson, W.: Plasma sheet at≈20 Re during steady magnetospheric convection, Planet. Space Sci., 36, 353– 370, 1988.