www.ann-geophys.net/29/147/2011/ doi:10.5194/angeo-29-147-2011
© Author(s) 2011. CC Attribution 3.0 License.
Annales
Geophysicae
The structure and dynamics of a large-scale plasmoid generated by
fast reconnection in the geomagnetic tail
M. Ugai
Research Center for Space and Cosmic Evolution, Ehime University, Matsuyama 790-8577, Japan
Received: 24 November 2010 – Revised: 27 December 2010 – Accepted: 4 January 2011 – Published: 13 January 2011
Abstract. As a sequence of Ugai (2010b), the present pa-per studies in detail the structure and dynamics of large-scale (principal) plasmoid, generated by the fast reconnection evo-lution in a sheared current sheet with no initial northward field component. The overall plasmoid domain is divided into the plasmoid reconnection region P and the plasmoid core region C. In the region P, the magnetized plasma with re-connected field lines are accumulated, whereas in the region C, the plasma, which was intially embedded in the current sheet and has been ejected away by the reconnection jet, is compressed and accumulated. In the presence of the sheared magnetic field in the east-west direction in the current sheet, the upper and lower parts of the reconnection region P are in-versely shifted in the east-west directions. Accordingly, the plasmoid core region C with the accumulated sheared field lines is bent in the north-south direction just ahead of the plasmoid centerx=XC, causing the magnetic field compo-nent in the north-south direction, whose sign is always op-posite to that of the reconnected field lines. Therefore, inde-pendently of the sign of the initial sheared field, the magnetic field componentBzin the north-south direction has the def-inite bipolar profile aroundXCalong the x-axis. Atx=XC, the sheared field component has the peak value, and as the sheared fields accumulated in the region C become larger, the bipolar field profile becomes more distinct.
Keywords. Magnetospheric physics (Magnetotail; Storms and substorms)
1 Introduction
Magnetic reconnection is essential for large dissipative events in space plasmas, such as solar flares and geomagnetic substorms (Nishida, 1989; Priest and Forbes, 2000; Runov et
Correspondence to: M. Ugai ([email protected])
al., 2003; Klimchuk, 2006; Nakamura et al., 2006; Sharma et al., 2008). In view of the large-scale explosive magnetic energy conversion, we have proposed the spontaneous fast reconnection model. The details of this model have already been reported in our previous papers (e.g., Ugai, 2008, and references therein). It is demonstrated that the condition for the fast reconnection evolution is that the current sheet width in the sheet current direction is about three times larger than its thickness. In the geomagnetic tail, the current sheet is formed by the interaction between the Earth’s dipole field and the solar wind. Once such a thin current sheet is formed, initiated by a disturbance, extreme current sheet thinning (current concentration) occurs around an X neutral line in collisionless plasmas, so that current-driven anomalous re-sistivities should necessarily be caused by plasma microtur-bulences such as ion-acoustic instabilities (Lui, 2001, 2004; Petkaki and Freeman, 2008). In fact, we find that the fast re-connection evolution is little influenced by functional forms nor parameter values of current-driven anomalous resistiv-ity model. In other words, the fast reconnection mechanism can readily build up spontaneously in such thin current sheets once they are formed in space (collisionless) plasmas.
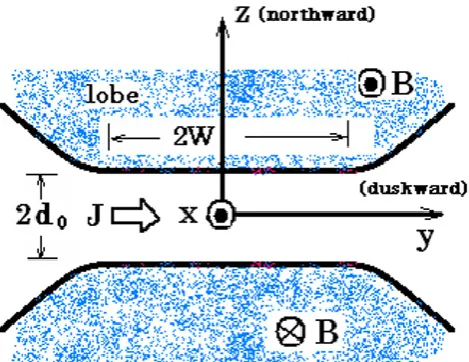
Fig. 1. Schematic drawing of the tail current sheet in the (y,z)-plane,
where the x-, y- and z-axes, employed in the present study, are directed to the Earthward, duskward and northward directions, re-spectively, consistent with the conventional GSM coordinates; also, Jis the sheet current, and 2Wand 2d0indicate the effective current sheet width and thickness, respectively.
evolution becomes harder for the larger sheared field, and in a force-free current sheet the condition for the fast recon-nection evolution is that the current sheet width is about six times larger than its thickness,W >6d0say (Ugai, 2010a).
One of the most fundamental questions on substorms may be to clarify the physical mechanism of plasmoid traveling in the tail. The traditional plasmoid picture predicts that if the reconnection starts somewhere in the tail current sheet, where a northward magnetic field usually exists, a plamoid structure with closed or spiral field lines may be formed in the tailward direction (Hones Jr., 1977), which was examined by an MHD simulation (Birn and Hones Jr., 1981). How-ever, in this picture, the x-directional plasmoid dimension may simply be determined by that of the outermost closed (spiral) field lines without considering the essential recon-nection dynamics. On the contrary, the two-dimensional (2-D) plasmoid structure was studied on the basis of the spontaneous fast reconnection model (Ugai, 1995; Abe and Hoshino, 2001). Recently, we demonstrate that even without any initial northward magnetic field the magnetic field pro-files inside the plasmoid, generated by the fast reconnection mechanism in the sheared current sheet, are, both qualita-tively and quantitaqualita-tively, in good agreement with the satellite observations; in particular, the north-south field component has the definite bipolar structure around the plasmoid cen-ter, where the east-west field component has the peak value (Ugai, 2010b). Also, the similar results are reported with a different numerical scheme by Shirataka et al. (2006) on the basis of the spontaneous fast reconnection model, and similar structures are reported in Cluster observations (Runov et al., 2008). Hence, the main theme of the present paper is to
ex-amine the structure and dynamics of the large-scale (princi-pal) plasmoid in more detail and to understand why and how the basic magnetic field profiles are generated inside the plas-moid. Here, the “plasmoid” means the plasma sheet bulge that is directly generated by the fast reconnection jet, which is quite different from the so-called “flux rope” generated by multiple reconnections. We also distinguish the “large-scale (principal) plasmoid” from the small-scale magnetic islands that are usually generated in the active X reconnection (diffu-sion) region and propagate in the central plasma sheet (Ugai and Zheng, 2006). In the present study, no northward mag-netic field is considered in the initial current sheet.
2 Simulation modeling
The present simulation model is quite the same as Ugai (2010b), except that the results are shown with the coordi-nate system in Fig. 1. The details of the numerical procedure are already described in Ugai (2008), and all the present sim-ulation results can readily be confirmed.
2.1 Basic equations
The compressible magnetohydrodynamic (MHD) equations are
Dρ/Dt= −ρ5 ·u, ρDu/Dt= − 5P+J×B,
∂B/∂t− 5 ×(u×B)= − 5 ×(ηJ), (1) ρDe/Dt= −P5 ·u+ηJ2,
J= 5 ×B/µ0, 5 ·B=0,
whereD/Dt≡∂/∂t+u· 5; the gas law,P=(γ−1)ρe, is assumed (e is the internal energy per unit mass, and γ is the specific heat ratio withγ=5/3 assumed here (an adi-abatic case)), as is Ohm’s law,E+u×B=ηJ (η may be an effective resistivity). The basic Eqs. (1) are transformed to a conservation-law form, and the modified Lax-Wendroff scheme is used for the numerical computation (Ugai, 2008). 2.2 Initial-boundary conditions
Initially, a long current sheet with sheared antiparallel mag-netic fields (Bx) is assumed. Then, the normalization of quantities, based on the initial quantities, is self-evident: dis-tances are normalized by the z-directional current sheet half-thicknessd0, magnetic fieldBbyBx0, plasma pressureP by P0=Bx02/(2µ0); also, plasma density ρ by ρi=ρ(z=0),
plasma flow velocityuby VAx0(=Bx0/
√
µ0ρi), time t by
d0/VAx0. The Alfv´en velocity based onBx0in the ambient magnetic field region is given byVAe=VAx0/
√
ρe(ρeis the
plasma density in the magnetic field region).
1< z <5; Bx=cos[(z−5)π/0.6] for 5< z <5.3; Bx=0 forz >5.3; also,Bx(z)= −Bx(−z)forz <0. The sheared field componentBy is initially assumed as: By(z)=By0+
αcos(zπ/2)for|z|<1 andBy=By0for|z|>1. Here,By0 andαare taken to be parameters for the initial sheared field. Fluid velocityu=(0,0,0), and plasma pressureP (z) satis-fies the pressure-balance condition,
P+Bx2+By2=1+β0+By02, (2) whereβ0is the ratio of the plasma pressure to the magnetic pressureBx02/(2µ0) in the magnetic field region 1< z <5 (here,β0=0.15 is taken). Also, plasma density ρ initially satisfies
ρ(z)=P (z)/(1+β0+By02 −(By0+α)2), (3) so thatρe=β0/(1+β0+By02 −(By0+α)2)in the ambient magnetic field region, and the initial temperatureT =P /ρ is, for simplicity, assumed to be constant everywhere.
The computational region is taken to be a rectangular box, 0≤x≤Lx, 0≤z≤Lz, and −Ly≤y≤Ly, and the axis symmetry boundary conditions are assumed as follows (Ugai, 2010a, b). With respect to the x-axis, ρ(x,−y,−z) = ρ(x,y,z), ux(x,−y,−z) = ux(x,y,z), uy(x,−y,−z)= −uy(x,y,z), uz(x,−y,−z)= −uz(x,y,z), Bx(x,−y,−z)= −Bx(x,y,z), By(x,−y,−z)=By(x,y,z), Bz(x,−y,−z)=Bz(x,y,z), andP (x,−y,−z)=P (x,y,z), for a fixed value of x in 0 ≤x ≤Lx. With re-spect to the z-axis, ρ(−x,−y,z) = ρ(x,y,z), ux(−x,−y,z)= −ux(x,y,z),uy(−x,−y,z)= −uy(x,y,z), uz(−x,−y,z)= uz(x,y,z), Bx(−x,−y,z)= Bx(x,y,z), By(−x,−y,z)=By(x,y,z), Bz(−x,−y,z)= −Bz(x,y,z), and P (−x,−y,z)= P (x,y,z), for a fixed value of z in 0≤ z ≤Lz. On the other boundary planes (x =Lx,y =Ly,y = −Ly,z =Lz), the free boundary conditions are assumed, so that the reconnection ouflow is open to the free space.
The effective resistivity for the Ohm’s law (normalized by µ0d0VAx0) is assumed to be,
η(r,t )=kd[Vd(r,t )−VC] forVd> VC,
=0 forVd< VC, (4)
whereVd(r,t )=|J(r,t )/ρ(r,t )|is the relative electron-ion drift velocity. Here, we take kd=0.003 and VC=12 in Eq. (4) as before. Also, in order to disturb the initial config-uration, a localized resistivity is assumed around the origin (r=0)in the form,
η(r)=η0exp[−(x/ kx)2−(y/ ky)4−(z/ kz)4], (5) which breaks the initial static condition and causes mag-netic reconnection as an initial disturbance. Here, we take η0=0.02 andkx=kz=0.8, andky=5. This disturbance (5) is imposed only in the initial time range 0< t <4, and the resistivity model (4) is assumed fort >4.
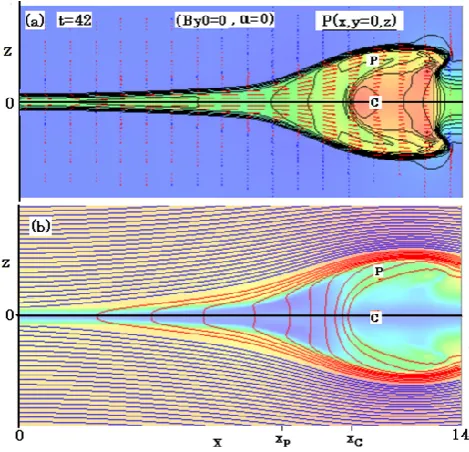
Fig. 2. (a) Plasma flow vectors and plasma pressure disribution
with contour interval of 0.15, and (b) magnetic field lines passing through the x- and z-axes with the distribution of|Bx|in color, in they=0[(x,z)]plane at timet=42 for the case ofBy0=α= 0; here,XP andXCindicate the plasmoid backward end and the plasmoid center, respectively, and P and C indicate, respectively, the plasmoid reconnection region and the plasmoid core region. The color from blue to red indicates the quantity magnitude from its minimum to the maximum; in what follows, all the similar figures are shown in this way.
The parameters for the numerical computations are taken to beLx=14 or 20,Lz=7.2, andLy=10. The mesh sizes are4x=0.04,4z=0.015 and4y=0.1.
3 Results
Because of the present symmetry boundary conditions, the plasmoids propagate both in the positive and negative x-directions. In what follows, only the plasmoid propagat-ing in the positive x-direction will be shown. First of all, the basic plasmoid structure in the absence of initial sheared field is shown, which is consistent with those reported in our previous 2-D and three-dimensional (3-D) MHD simulations (Ugai and Zheng, 2006, and references therein). Next, we demonstrate how the plasmoid structure is transformed by the initial sheared field in the current sheet to provide the definite magnetic field profiles inside the plasmoid.
3.1 Plasmoid structure with no initial sheared field
[image:3.595.310.545.63.289.2]Fig. 3. Plasma pressure distributions with contour interval of 0.15 att=42 for the case ofBy0=α=0 in the cross sections at (a)x= 12.4 and (b)x=13.2, where the regions P and C are indicated.
plasma flow velocity vectors with the plasma pressure distri-bution and the magnetic field configuration with theBxfield distribution in they=0[(x,z)]plane at timet=42, when the large-scale plasmoid has fully been established. Note that the magnetic field lines in the (x,z)-plane are coplanar. The plas-moid structure along the x-axis is characterized by the back-ward end of the plasmoid,XP, and the plasmoid center,XC (here,Lx=14 is taken). In the extentXP< x < XC, the mag-netized plasma with the reconnected field lines withBz>0, which have been accelerated and heated by slow shocks, are accumulated, whereas inXC< xthe plasma, which was ini-tially embedded in the current sheet and has been ejected away by the reconnection jet, is compressed and accumulated (Ugai, 2010a, b). Therefore, on the x-axis, the reconnected field componentBz>0 inXP< x < XC, whereasBz=0 in XC< x. Also, Fig. 3 shows the plasma pressure distribu-tions in the cross secdistribu-tions atx=12.4 andx=13.2, which are taken to be larger thanXC∼11. The plasma pressure in thex=12.4(> XC)plane is distinctly enhanced in the mid-dle region, denoted by C, and in the spot-like regions above and below the region C, denoted by P. The plasmoid dimen-sion is effectively confined in the y-direction, outside which there is little influence of reconnection, since the fast recon-nection process is effectively limited in the y-direction (Ugai, 2009b).
In the absence of initial sheared field, the resulting plas-moid consists of high-βplasma because of the strong plasma compression. On the basis of Figs. 2 and 3, the plsmoid structure may be schematically illustrated in Fig. 4, where the overall domain of the plasmoid, propagating in the pos-itive x-direction, is divided into the two characteristic re-gions C and P as follows. In the plasmoid core region C, located inx > XC, the plasma, which was initially
embed-Fig. 4. Schematic drawing of a pair of plasmoids propagating in the
positive and negative x-directions in they=0[(x,z)]plane, where the overall plasmoid domain is divided into the plasmoid recon-nection region P in yellow and the plasmoid core region C in red; here,XP(−XP) andXC(−XC) indicate, respectively, the plasmoid backward end and the plasmoid center, andVAis the Alfv´en veloc-ity.
ded in the central current sheet and has been ejected away by the reconnection jet, is distinctly compressed and accumu-lated, so that the plasma density and pressure are enhanced. The plasmoid centerXCcorresponds to the contact discon-tinuity that bounds the reconnected plasma and the plasma without reconnection. The region C is located in the cen-ter of the plasmoid and may hence be considered to be the plasmoid core. In the plasmoid reconnection region P, the magnetized plasma with the reconnected field lines, which has been accelerated and heated by slow shocks, are accu-mulated. Hence, in this region the plasma flow velocities are considerably large, so that the region extends in the x-direction like a nose beyond the region C (Fig. 2); also, as shown in Fig. 3b, in the cross section of the nose atx=13.2 (Fig. 2a), a pair of (upper and lower) spots of the region P are formed ahead of the region C.
3.2 Plasmoid structure in a sheared field
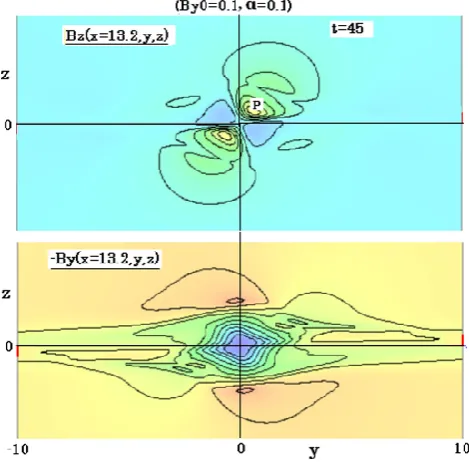
[image:4.595.48.285.65.253.2]Fig. 5. (a) Magnetic field lines passing through the x- and z-axes,
projected onto they=0[(x,z)]plane, with the distribution ofBz in color, (b) distribution of−Bywith contour interval of 0.1 and
(c) plasma pressure distribution with contour interval of 0.15 and plasma flow vectors, in they=0 plane att=45 for the case of By0=0.1 andα=0.1, whereXCis the plasmoid center and the regions P and C are indicated.
Fig. 6. Profiles of the plasma densityρ,−ByandBzatt=45 along the x-axis around the plasmoid centerXCfor the case ofBy0=0.1 andα=0.1.
[image:5.595.308.543.61.254.2]plasmoid centerXC. As already shown,|By|has the maxi-mum value atx=XC, where theBzfield changes its sign and the plasma densityρ increases because of the plasma com-pression aroundx=XC. In this case too, the plasmoid center XCcorresponds to the contact discontinuity that bounds the reconnected field lines and those without reconnection (Ugai, 2010a, b).
Fig. 7. Magnetic field lines passing through the z-axis (blue) and
the reconnected field lines passing through the x-axis (red), and dis-tribution ofBzin color in they=0[(x,z)]plane, att=45 for the case ofBy0=0.1 andα=0.1, whereXCindicates the plasmoid center.
As in Fig. 4, the resulting plasmoid is divided into the re-gions P and C as shown in Fig. 5c. In this case, the sheared field lines (By) are embedded in the initial current sheet, so that the magnetized plasma with the sheared field lines has been ejected away by the reconnection jet and are accumu-lated in the core region C inx > XC. Note that the sheared field lines may continuously be accumulated in the region C as the plasmoid (the region C) propagates in the positive x-direction, since the field lines are frozen-into the plasma. In the reconnection region P, the magnetized plasma with the reconnected sheared field lines is accumulated, so that the Byfield is notably compressed aroundx=XC(Figs. 5b and 6). Figure 7 shows the magnetic field lines passing through the z-axis and the reconnected field lines passing through the x-axis, which are the same as Fig. 5a but viewed from an-other angle. Apparently, the reconnected field lines passing through thexaxis inx < XC, which have the field component Bz>0, are significantly skewed in the positive y-direction in z >0.
[image:5.595.50.283.63.280.2] [image:5.595.50.284.381.554.2]Fig. 8. Plasma pressure distributions (contour interval of 0.15) at t=45 for the case ofBy0=0.1 andα=0.1 in the cross sections at
[image:6.595.307.544.64.308.2](a)x=13.2, (b)x=13.6 and (c)x=17.6, where the regions P and C are indicated.
Fig. 9. Distributions ofBz and−By(contour interval of 0.1) at t=45 for the case ofBy0=0.1 andα=0.1 in the cross section at x=13.2.
Fig. 10. Distributions ofBzand−By(contour interval of 0.1) at t=45 for the case ofBy0=0.1 andα=0.1 in the cross section at x=13.6, where the regions P and C are indicated.
(Fig. 6). Similarly, Fig. 10 shows the distributions of theBz andByfield components in thex=13.6 plane just ahead of the plasmoid centerXC. This figure shows that in the plas-moid core region C (aroundy=z=0), where the sheared field lines are accumulated, theBz field becomes definitely negative (Fig. 6). Also, the location ofx=17.6 corresponds to the nose of the reconnection region P (Fig. 5), where the spot-like parts of the region P, located above and below the x-axis, are shifted in the positive and negative y-directions, respectively (Fig. 8c).
[image:6.595.49.284.408.639.2]Fig. 11. Schematic drawings of the reconnected field lines,
repre-sented byA, which pass through the x-axis inx < XCand the plas-moid reconnection region P, and the accumulated sheared field lines, represented byB, which pass through the x-axis inx > XCand the plasmoid core region C, where dotted lines indicate the field lines inz <0, for the cases (a)Bx0>0,By>0 and (b)Bx0>0,By<0.
of the plasmoid center may be bent in the z-direction around y=z=0 (Fig. 8b). Therefore, the sheared magnetic field lines with By>0, which are accumulated in the core re-gion C, should simultaneously be bent, leading toBz<0 in the region C atx=13.6 (Figs. 6 and 10).
In order to see more clearly the complicated 3-D magnetic field topology in the plasmoid, Fig. 11 schematically illus-trates the typical field lines passing inside the plasmoid. For the case ofBx0>0 and By>0, as shown in Fig. 11a, the reconnected field lines, denoted byA, come from the nega-tive z- and neganega-tive y-directions, pass through the x-axis in x < XC and go to the positive z- and positive y-directions. The reconnected field linesApass through the plasmoid re-connection region P, which is now shifted in the positive y-direction inz >0 and in the negativeydirection inz <0 in x > XC(Fig. 8). On the other hand, the accumulated sheared field lines, denoted byB, are basically directed to the
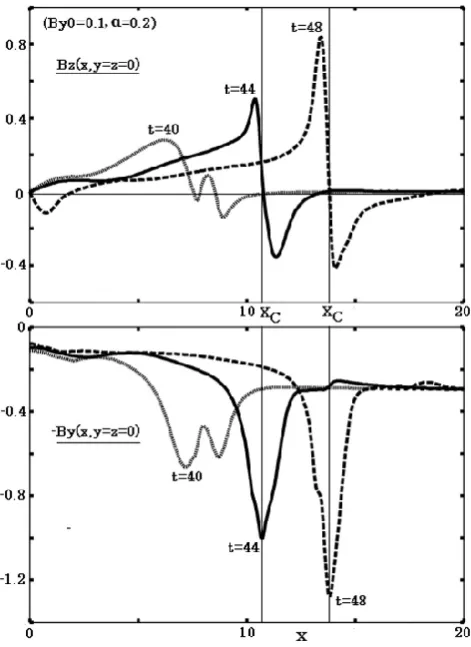
posi-Fig. 12. Profiles ofBzand−Byalong the x-axis at different times for the case ofBy0=0.1 andα=0.2.
tive y-direction and pass through the plasmoid core region C inx > XC. Since the region P of enhanced pressure, shifted in the y-directions, tends to push the core region C inx > XC downward in y >0 and upward iny <0, the sheared filed linesBare forced to be bent in the z-direction to cause the field componentBz<0 around the x-axis (see also Fig. 10). For the case ofBy<0 andBx0>0, as shown in Fig. 11b, the sheared field linesB, accumulated in the core region C inx > XC, are forced to be bent in the z-direction because of the y-directional shift of the region P, giving rise toBz<0 around the x-axis (in this case, the region P is shifted in the positive y-direction inz <0 and negative y-direction in z >0). In any case, the sign of theBz component of the re-connected field linesAinx < XCis opposite to that of the field lines ofBinx > XC. Hence, independently of the sign of the sheared field (By) initially embedded in the current sheet, theBzfield component always changes its sign across the resulting plasmoid centerXC, giving rise to the definite bipolar profile.
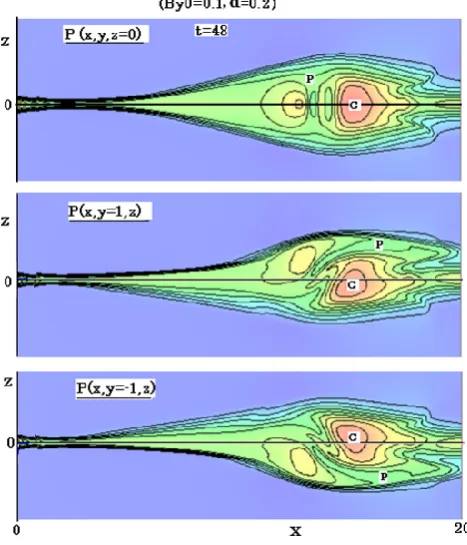
[image:7.595.63.274.62.405.2]Fig. 13. Plasma pressure distributions (contour interval of 0.15)
att=48 in they=0, y=1 and y= −1 planes for the case of By0=0.1 andα=0.2, where the regions P and C are indicated.
somewhat larger than in the previous case. At timet=40, when the plasmoid is not yet established, there are two humps of theByfield: One is associated with the reconnected field lines and the other at the largerxlocation results from the compression of the sheared field lines initially embedded in the current sheet. Att=44 andt=48, when the plasmoid is fully established, the two humps have been combined at the plasmoid centerx=XC, whereBy has the maximum value andBz changes its sign. Figure 13 shows the plasma pres-sure distributions att=48 in they=0,y=1 and y= −1 planes, where the plasmoid reconnection region P is distorted in the y-direction (Fig. 11a). Also, Fig. 14 shows the distri-butions of plasma pressureP and magnetic field component Bzin thex=14.4 plane, located just ahead of the plasmoid centerXC∼13.8 (Fig. 12). As indicated in Fig. 11a, the plasmoid core region C is bent in the z-direction, giving rise toBz<0 in C (Fig. 14b). For the other parameter values, such asBy0=0.2 andα=0, the results are found to be, at least qualitatively, quite the same. Quantitatively, we gener-ally find that as the accumulated sheared fields in the core region C become larger, the bipolar change inBz becomes more distinct (Fig. 12). This can readily be understood, since the bipolarBzprofile results directly from the bending of the field linesBaccumulated in C forx > XC(Fig. 11).
Fig. 14. Distributions of the plasma pressureP (contour interval of 0.15) andBz(contour interval of 0.1) in the cross section atx=14.4 att=48 for the case ofBy0=0.1 andα=0.2, where the regions P and C are indicated.
4 Summary and discussion
[image:8.595.310.545.65.269.2]contact discontinuity that bounds the reconnected field lines in P and the field lines without reconnection in C.
For the case of the initial sheared fieldBy>0, the upper (lower) part of the plasmoid reconnection region P propagat-ing in the positive x-direction is shifted in the positive (neg-ative) y-direction (Fig. 8). The field lines passing through the regions P and C are illustrated in Fig. 11. As seen from this figure, the region P shifted in the y-direction causes the plasmoid core region C with the accumulated sheared field lines to be bent in the z-direction around the x-axis inx > XC (Figs. 8b and 14a), leading to the field componentBz<0 just ahead ofx=XC (Figs. 6 and 12). For the case ofBy<0 too, the bending of the region C causesBz<0 ahead ofXC. Therefore, ifBz=0 initially, independently of the sign of the initial sheared fieldBy, the field componentBz always changes its sign across the plasmoid centerXC, leading to the definite bipolar profile. The bipolar profile ofBzmay be-come more distinct as the sheared magnetic fields are more accumulated in the region C (Fig. 12), since the field com-ponentBz<0 results directly from the accumulated sheared magnetic field lines in the region C.
Unlike the traditional plasmoid picture, we have demon-strated that even if there is no northward magnetic field in the initial current sheet, the bipolar profile ofBz is caused across the plasmoid center XC. This implies that the ini-tial northward magnetic field in the tail current sheet plays no essential role in the basic plasmoid structure or dynam-ics. This may be understood if one considers the effect of the initial northward field on the plasmoid dynamics as fol-lows. Since the magnetized plasma initially in the recon-nection outflow region is accumulated in the plasmoid core region C, the only significant effect of the initial northward field component may arise in the region C, where the accu-mulated sheared field lines may retain the initial northward field component. As shown in Fig. 4, plasmoids propagate in the Earthward (x >0) and tailward (x <0) directions. In the Earthward-moving plasmoid, the reconnected field lines in x < XC have the northward field component (Bz>0), whereas the accumulated field lines in C are bent so as to enhance the southward field component (Bz<0) inx > XC (Fig. 6 or 12). Hence, the northward field component pre-existing in C should be reduced inx > XC, and if the initial Bz>0 is sufficiently small,Bzmay become negative (south-ward) inx > XC. In the tailward-moving plasmoid, the re-connected field lines inx >−XC have the southward field component (Bz<0), whereas the bending of the accumu-lated field lines in C causes the northward field component (Bz>0) inx <−XCbecause of the symmety boundary con-dition,Bz(−x,y=z=0)= −Bz(x,y=z=0). Hence, the northward field component pre-existing in C may enhance the northward component inx <−XC, leading to the bipo-lar profile ofBzmore symmetric. Also, it may be noted that even if the initial sheared field is small, the sheared field lines are continuously piled up inside the plasmoid core region C as the plasmoid propagates, so that the sheared field (By) can
become very large (even larger than the lobe field) at the plas-moid centerXC(Fig. 12). These basic features seem to be generally consistent with satellite observations.
In summary, on the basis of the spontaneous fast recon-nection model, we may suggest the following scenario for the plasmoid dynamics in the geomagnetic tail. The basic configuration of the tail current sheet should be controlled by solar wind conditions. Then, as shown in Fig. 1, once a suffi-ciently thin current sheet, sayW >3d0, is formed somewhere in the tail, the fast reconnection mechanism can suddenly build up there. If the fast reconnection is fully established, large-scale plasmoids are generated and propagate in the tail-ward and Earthtail-ward directions (Fig. 4). The tailtail-ward-moving plasmoid can freely propagate down the geomagentic tail. In addition to the large-scale (principal) plasmoid, small-scale magnetic islands are likely to be generated in the active X re-connection (diffusion) region, which may also propagate in the tailward or Earthward direction (Ugai and Zheng, 2006). On the other hand, the Earthward-moving plasmoid eventu-ally collides with the Earth’s dipole field, which may cause many distinct phenomena. For instance, the so-called current wedge (McPherron et al., 1973) may be generated just ahead of the dipole field (say |x|∼10RE) (Ugai, 2009a); also, in accordance with substorm onsets (Kamide, 1982), dis-tinct magnetic pulsations of low frequency may occur (Ugai, 2009c). However, it should be noted that the fast reconnec-tion evolureconnec-tion has very different aspects according to dif-ferent situations; for instance, in critical situations, the fast reconnection mechanism cannot be fully established, which might lead to the so-called pseudosubstorms (Ugai, 2009b). Hence, in conclusion, it may be essential for the complicated substorm phenomena to understand the underlying physics of the fast reconnection mechanism.
Acknowledgements. The author thanks A. Nishida for useful discussions. This work was supported by the Grant-in-Aids (21340142) from the Ministry of Education in Japan, Mitsubishi Foundation, RISH of Kyoto University, and Solar-Terrestrial Envi-ronment Laboratory of Nagoya University.
Topical Editor I. A. Daglis thanks two anonymous referees for their help in evaluating this paper.
References
Abe, S. A. and Hoshino, M.: Nonlinear evolution of plasmoid struc-ture, Earth, Planets Space, 53, 663–671, 2001.
Birn, J. and Hones Jr., E. W.: Three-dimensional computer model-ing of dynamic reconnection in the geomagnetic tail, J. Geophys. Res., 86, 6802–6808, 1981.
Hones Jr., E. W.: Substorm processes in the magnetotail: Comments on “On hot tenuous plasma, fireballs, and boundary layers in the Earth’s magnetotail” by L. A. Frank et al., J. Geophys. Res., 82, 5633–5640, 1977.
plasmoid evolution with Geotail observations, J. Geophys. Res., 103, 4453–4465, 1998.
Kamide, Y.: The relationship between field-aligned currents and the auroral electrojets – A review, Space Sci. Rev., 31, 127–243, 1982.
Klimchuk, J. A.: On solving the coronal heating problem, Solar Phys., 234, 41–77, 2006.
Lui, A. T. Y.: A multiscale model for substorms, Space Sci. Rev., 95, 325–345, 2001.
Lui, A. T. Y.: Potential plasma instabilities for substorm expansion onsets, Space Sci. Rev., 113, 127–206, 2004.
McPherron, R. L., Russel, C. T., and Aurbry, M. P.: Satellite stud-ies of magnetospheric substorms on August 15, 1968. 9. Phe-nomenological model for substorms, J. Geophys. Res., 78, 3131– 3149, 1973.
Nakamura, R., Baumjohann, W., Asano, Y., Runov, A., Balogh, A., Owen, C. J., Fazakerley, A. N., Fujimoto, M., Klecker, B., and Reme, H.: Dynamics of thin current sheets associated with magnetotail reconnection, J. Geophys. Res., 111, A11206, doi:10.1029/2006JA011706, 2006.
Nishida, A.: Can random reconnection on the magnetopause pro-duce the low latitude boundary layer?, Geophys. Res. Lett., 16, 227–230, 1989.
Petkaki, P. and Freeman, M. P.: Nonlinear dependence of anoma-lous ion-acoustic resistivity on electron drift velocity, Astrophys. J., 686, 686–693, 2008.
Priest, E. R. and Forbes, T. G.: Magnetic Reconnection: MHD The-ory and Applications, Cambridge University Press, Cambridge, UK, 2000.
Runov, A., Nakamura, R., Baumjohann, W., Treumann, R. A., Zhang, T. L., Volwerk, M., Voros, Z., Balogh, A., Glasmeier, K.-H., Klecker, B., Reme, K.-H., and Kistler, L.: Current sheet structure near magnetic X-line observed by Cluster, Geophys. Res. Lett., 30, 1579, doi:10.1029/2002GL016730, 2003.
Runov, A., Voronkov, I., Asano, Y., Baumjohann, W., Fujimoto, M., Nakamura, R., Takada, T., Volwerk, M., V¨or¨os, Z., Meurant, M., Fazakerley, A., R`eme, H., and Balogh, A.: Structure of the near-Earth plasma sheet during tailward flows, Ann. Geophys., 26, 709–724, doi:10.5194/angeo-26-709-2008, 2008.
Runov, A., Angelopoulos, V., Sitnov, M. I., Sergeev, V. A., Bonnell, J., McFadden, J. P., Larson, D., Glassmeier, K.-H., and Auster, U.: THEMIS observations of an earthward-propagating dipolarization front, Geophys. Res. Lett., 36, L14106, doi:10.1029/2009GL038980, 2009.
Sergeev, V. A., Elphic, R. C., Mozer, F. S., Saint-Marc, A., and Sauvaud, J. A.: A two-satellite study of nightside flux transfer events in the plasma sheet, Planet. Space Sci., 40, 1551–1572, 1992.
Sharma, A. S., Nakamura, R., Runov, A., Grigorenko, E. E., Hasegawa, H., Hoshino, M., Louarn, P., Owen, C. J., Petrukovich, A., Sauvaud, J.-A., Semenov, V. S., Sergeev, V. A., Slavin, J. A., Sonnerup, B. U. ¨O., Zelenyi, L. M., Fruit, G., Haa-land, S., Malova, H., and Snekvik, K.: Transient and localized processes in the magnetotail: a review, Ann. Geophys., 26, 955– 1006, doi:10.5194/angeo-26-955-2008, 2008.
Shirataka, N., Fujimoto, M., Hasegawa, H., and TanDokoro, R.: Re-producing the bipolar magnetic signature at the jet leading edge by three-dimensional reconnection with nonzero guide field, J. Geophys. Res., 111, A7201, doi:10.1029/2005JA011521, 2006. Slavin, J. A., Smith, E. J., Tsurutani, B. T., Sibeck, D. G., Singer,
H. J., Baker, D. N., Gosling, J. T., Hones, E. W., and Scarf, F. L.: Substorm associated traveling compression regions in the distant tail – ISEE-3 geotail observations, Geophys. Res. Lett., 11, 657– 660, 1984.
Slavin, J. A., Smith, M. F., Mazur, E. L., Baker, D. N., Hones Jr., E. W., Iyemori, T., and Greenstadt, E. W.: ISEE 3 observations of traveling compression regions in the Earth’s magnetotail, J. Geophys. Res., 98, 15425–15446, 1993.
Slavin, J. A., Lepping, R. P., Gjerloev, J., Fairfield, D. H., Hesse, M., Owen, C. J., Moldwin, M. B., Nagai, T., Ieda, A., and Mukai, T.: Geotail observations of magnetic flux ropes in the plasma sheet, J. Geophys. Res., 108, 1015, doi:10.1029/93JA01467, 2003.
Sormakov, D. A. and Sergeev, V.: Topology of magnetic flux ropes in the magnetospheric plasma sheet as measured by the Geotail satellite, Cosmic Res., 46, 387–391, 2008.
Ugai, M.: Computer studies on plasmoid dynamics associated with the spontaneous fast reconnection mechanism, Phys. Plasmas, 2, 3320–3328, 1995.
Ugai, M.: The evolution of fast reconnection in a three-dimensional current sheet system, Phys. Plasmas, 15, 082306, doi:10.1063/1.2969737, 2008.
Ugai, M.: Evolution of the current wedge and the generator cur-rent circuit by fast reconnection, Phys. Plasmas, 16, 012901, doi:10.1063/1.3055598, 2009a.
Ugai, M.: Fast reconnection evolution in an arcade-like magnetic loop structure, Phys. Plasmas, 16, 062312, doi:10.1063/1.3158949, 2009b.
Ugai, M.: Impulsive magnetic pulsations and electrojets in the loop footpoint driven by the fast reconnection mechanism, Phys. Plas-mas, 16, 112902, doi:10.1063/1.3267869, 2009c.
Ugai, M.: Three-dimensional evolution of the fast reconnection mechanism in a force-free current sheet, Phys. Plasmas, 17, 06291, doi:10.1063/1.3431097, 2010a.
Ugai, M.: Magnetic field structure of large-scale plasmoid gener-ated by the fast reconnection mechanism in a sheared current sheet, Ann. Geophys., 28, 1511–1521, doi:10.5194/angeo-28-1511-2010, 2010b.
![Fig. 4. Schematic drawing of a pair of plasmoids propagating in thepositive and negative x-directions in the y = 0[(x,z)] plane, wherethe overall plasmoid domain is divided into the plasmoid recon-nection region P in yellow and the plasmoid core region C in red;here, XP (−XP) and XC (−XC) indicate, respectively, the plasmoidbackward end and the plasmoid center, and VA is the Alfv´en veloc-ity.](https://thumb-us.123doks.com/thumbv2/123dok_us/8161003.249623/4.595.48.285.65.253/schematic-plasmoids-propagating-thepositive-directions-respectively-plasmoidbackward-plasmoid.webp)
![Fig. 7. Magnetic field lines passing through the z-axis (blue) andcase ofthe reconnected field lines passing through the x-axis (red), and dis-tribution of Bz in color in the y = 0[(x,z)] plane, at t = 45 for the By0 = 0.1 and α = 0.1, where XC indicates the plasmoidcenter.](https://thumb-us.123doks.com/thumbv2/123dok_us/8161003.249623/5.595.50.283.63.280/magnetic-passing-andcase-reconnected-passing-tribution-indicates-plasmoidcenter.webp)