Characteristics and microstructure of aqueous colloidal dispersions
of graphite oxide
G.I. Titelman
a, V. Gelman
a, S. Bron
a, R.L. Khalfin
b, Y. Cohen
b, H. Bianco-Peled
b,*aTAMI (IMI), Institute for Research and Development, P.O. Box 10140, Haifa Bay 26111, Israel bDepartment of Chemical Engineering, Technion, Israel Institute of Technology, Haifa 32000, Israel
Received 6 June 2004; accepted 19 October 2004 Available online 8 December 2004
Abstract
A highly oxidized graphite oxide was synthesized from natural graphite powder by oxidation with KMnO4in concentrated
H2SO4followed by hydrolysis, washing and centrifugation. Concentrated gel-like colloidal dispersions were obtained. The
corre-sponding filtrates, supernatants, GO dispersions, and solid GO films obtained from them, were investigated by various chemical analyses, small angle X-ray scattering, X-ray diffraction, light scattering (LS), Scanning Electron Microscopy, Fourier Transform Infrared Spectroscopy, 13C Nuclear Magnetic Resonance and Thermo-Gravimetric Analysis. The spectroscopic analysis shows besides the common peaks assigned to water molecules, hydroxyl and carboxyl groups, elimination of C@C bonds due to strong oxidation and presence of bands assigned to sulfate. Data of Gas Chromatography/Mass Spectrometry experiments confirm the presence in GO of water and an abundance of carboxyl groups. Scattering measurements confirm that the structure of the GO col-loids consists of plate-like objects, mostly containing only a few layers, with a small population of thicker aggregates. SEM images of cross sections of dried GO film, obtained by freeze fracture, demonstrate that a continuous film-like structure was successfully achieved by elimination of water localized within exfoliated GO particles in the swelled GO aqueous colloidal dispersions.
2004 Elsevier Ltd. All rights reserved.
Keywords:A. Graphite oxide; B. Oxidation; C. Small angle X-ray scattering, light scattering; D. Microstructure
1. Introduction
The Brodie, Staudenmaier and Hummers–Offeman methods are known as the main methods for the prepa-ration of graphite oxide (GO)[1,2]. Each is based on the oxidation of graphite in concentrated strong mineral acid with strong oxidizing agents. It is now well estab-lished that GO can be obtained only by oxidation of graphite salts (nitrate or bisulfate), either with strong oxidizing agents (potassium chlorate, permanganate, bichromate, chlorine dioxide) or electrochemically. The over- oxygenated graphite salts are then subjected to
hydrolysis followed by rinsing with water that yields an aqueous colloidal dispersion. The solid GO may be recovered by drying the dispersion either in a high vac-uum at room temperature or by lyophilization or by heating in air to low temperatures (45–50C), to prevent decomposition of oxygen-containing functional groups of GO that may take place at higher temperature. Due to the low drying temperature, both powder-like and film-like solid GO always contains some residual water. In spite of extensive scientific investigations, the exact composition and the structure of GO is still question-able. Different techniques such as elemental analysis, thermal decomposition, gas absorption, X-ray diffrac-tion, FT-IR, XPS and 13C-NMR have been used for studying both chemical composition and structure of the layers of solid GO [3–8].
0008-6223/$ - see front matter 2004 Elsevier Ltd. All rights reserved. doi:10.1016/j.carbon.2004.10.035
* Corresponding author. Tel.: +972 482 935 88; fax: +972 482 956
72.
E-mail address:[email protected](H. Bianco-Peled).
An intensive literature and market search let us con-clude that GO is not available on market and no patents devoted to GO manufacturing were found.
The aqueous colloidal dispersion of GO for different applications known in the literature, such as primary lithium cells [9], preparation of catalysts [10–12] and nanocomposites with different polymers[13–17], is used either as synthesized[14,15], or prepared from solid GO by dispersing in water or 0.1 M NaOH solution [11– 13,16,17]. Industrial production of GO requires changes of conventional methods of GO preparation, as de-scribed in the literature, in order to reduce the waste.
In the present paper, a highly oxidized graphite oxide has been prepared using a Hummers–Offeman method
[2]and different steps of GO preparation were studied in detail. The corresponding filtrates, supernatants, col-loidal GO dispersions and solid GO films obtained from these dispersions were investigated by various chemical analyses, Small Angle Ray Scattering (SAXS), X-Ray Diffraction (XRD), Light Scattering (LS), Scanning Electron Microscopy (SEM), Fourier Transform Infra-red Spectroscopy (FT-IR), Nuclear Magnetic Reso-nance (13C-MNR), Thermo-Gravimetric Analysis (TGA) and Gas Chromatography/Mass Spectrometry (GS-MS).
2. Experimental
2.1. Preparation of graphite oxide
Fine grade of natural graphite powder Fluka [7782-42-5], with 99.95% carbon content, ash content 0.05% was used for GO syntheses. All other reagents, H2SO4 (95–98%) ex Palacid LTD (Israel), KMnO4 ex Fluka [7722-64-7], H2O2 30% [7722-84-1] ex Fluka, were of analytical grade and were used as received.
Natural graphite powder was oxidized with KMnO4 in concentrated H2SO4. Two hundred grams of H2SO4 (98%) and 10 g of graphite were placed in a reactor cooled to 0 C. After mixing the suspension for 30 min, 1.5 g of KMnO4 was added in small portions to keep the temperature in the reactor at not more than 10C. The dark blue color of graphite bisulfate (GBS) was observed. Thirty minutes later, 30 g of KMnO4 was added to the suspension gradually, the rate of addi-tion being slow enough to prevent the temperature of the suspension exceeding 20C. After KMnO4feeding was finished, the reactor was heated to about 35 C, and kept at this temperature for additional 30 min. As the reaction progressed, the suspension became pasty and brownish in color. At the end of this 30 min period, 450 ml of water was slowly stirred into the paste to pre-vent violent effervescence, causing an increase in temper-ature to 90–95 C. The diluted suspension, now brown in color, was maintained at this temperature for 15
min. The suspension was then further treated with a mixture of 35 ml of hydrogen peroxide (30%) and 265 ml of water to reduce the residual permanganate and MnO2 to soluble MnSO4. Upon treatment with the H2O2, the suspension turned bright yellow. The warm suspension was filtered, resulting in a yellow-brownish filter cake designed as ‘‘Cake-0’’ (64.6 gr.) and a filtrate, designated as ‘‘filtrate-0’’. The cake was then further washed three times with aliquots (45 C, 500 ml) of a 3% HCl solution. Note that hydrochloric acid was added to the wash water, to prevent swelling of GO
[18]. The wash-liquids were collected and designated as ‘‘filtrate-1’’–‘‘filtrate-3’’ (Table 1). The clean GO cake designed as ‘‘Cake-3 (51.4 gr.) was dispersed in 4000 ml of cold water and the resulting colloidal suspension (pH1) was separated by centrifugation (4000 rpm, 17 min), resulting in a concentrated gel-like GO disper-sion ‘‘Gel-1’’ and ‘‘supernatant-1’’. The GO disperdisper-sion was additionally washed with two aliquots of 2000 ml water and separated by centrifugation at the same con-ditions, to establish pH4 of supernatant-3 (Table 1). The concentrated gel-like GO dispersion (Gel-3) was transferred from centrifuge bottles by water resulting in a diluted colloidal GO Dispersion-1 (the end product of synthesis). GO films were made from Gel-1, Gel-3 and Dispersion-1 by drying in air at 45C. The content of dry GO was determined as 6.58 wt% in Gel-1, 4.46 wt% in Gel-2 and 1.66 wt% in Dispersion-1. In other words, the yield of dry GO was 19.8 gr., 20.4 gr. and 19.3 gr. correspondingly.
2.2. Characterization of GO aqueous dispersions
The liquid products produced in different stages of GO separation (filtration or centrifugation) were ana-lyzed in order to quantify the content of H+, Cl (poten-tiometric titration), K+, Mn2+(atomic absorption) and SO24 (inductively coupled plasma ICP).
Dispersions of GO were analyzed by small-angle X-ray scattering measurements (SAXS) and by Dynamic and Static Light Scattering (DLS and SLS) measure-ments. Small angle X-ray scattering measurements were performed using a small angle diffractometer (Bruker Nanostar, KFF CU 2 K-90) with Cu Karadiation,
Light Scattering (SLS) and Dynamic Light Scattering (DLS) measurements were performed using a BI-200SM Research Goniometer System (Brookhaven Instruments Corp.). A Compass 415M solid-state laser (Coherent), generating monochromatic green light of 532 nm wavelength, was used. The detector assembly in-cludes a selected photo-multiplier tube (PMT), dyode chain and an integral amplifier/discriminator. The BI-9000AT digital signal processor was used as photon counter for SLS measurements and as a correlator for DLS measurements. Samples were placed in a 55 mm tall, 12 mm outside diameter round glass cell with Teflon cap, immersed in a glass vat containing decalin as the in-dex-matching fluid. DLS measurements were performed both on as-is dispersions, and following 5 min sonica-tion. The results where analyzed using the CONTIN procedure to obtain the number average diameter,Dn.
2.3. Characterization of GO solid films
The GO films were investigated by X-ray diffraction spectra recorded in a ULTIMA+-s2200 apparatus (RIG-AKU). The crystal size along thec-axis,Lc, was
deter-mined using the Scherrer equation. The FT-IR spectra of the GO film have been recorded in the range 4000– 400 cm1using the KBr pellet technique, with a BRU-KER ANALYTICAL FT-IR Spectrometer 5MX. Scan-ning electron microscopy (SEM) analysis was performed at different magnifications using a Jeol 5400 SEM. The nonconductive samples were gold-sputtered prior to observation. Solid-state NMR (13C) measurements were carried out on a 300 MHz Chemagnetics CMX-Infinity triple-resonance spectrometer. The thermogravimetric analyses (TGA) were carried out at a heating rate of 5
C/min in atmosphere of nitrogen using a Hi-Res
TGA-2950 model (TA Instruments). The water content in the GO films was measured by heating the sample in an oven with gases collection in a Karl–Fischer titrator. GC-MS studies were performed on GC/MS—HP model 6890/5972 (mass range: 40–550 amu, column: ZB 624, 60 m, 0.25 mm ID, 0.25lm film thickness, oven conditions: initial temperature 40C for 5 min, then heating to 150
C at 10 C/min, injector: 250 C (split mode 1:50). Headspace sampler was COMBI.
3. Results and discussion
3.1. Preparation and characterization of GO dispersion
Following each stage in GO preparation, filtration and rinsing, the cake and the filtrate or the gel-like concentrate and the supernatant were marked corre-spondingly with the number of the stage of filtration or centrifugation and weighed. All cakes were yellow-brownish in color and all gels were bright brown. Acidity as H+ concentration, contents of potassium, manganese, sulfate and chloride ions in all filtrates and supernatants were determined as described in the exper-imental section. Gel-3, obtained from the third centrifu-gation, was diluted with water to prepare Dispersion 1, which was the main focus of our investigation.
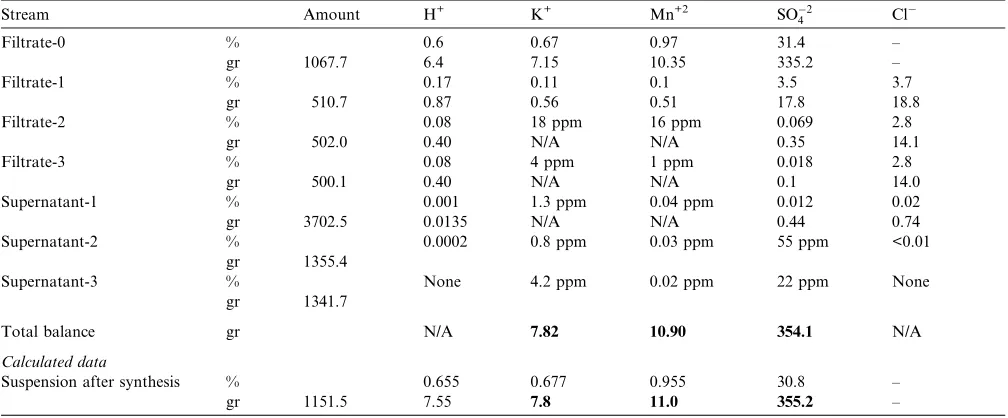
[image:3.595.42.546.90.299.2]From the data shown inTable 1it may be concluded that the chosen washing procedure resulted in Superna-tant-2 and Supernatant-3, practically free of sulfuric and hydrochloric acids, while manganese and potassium sul-fates were found in minute amounts even in Filtrate-2. The closed mass balance of both potassium and manga-nese,Table 1, indicates that GO does not contain potas-sium and manganese. On the other hand, the sulfate Table 1
Analysis and mass balance of the wash-waters produced in different stages of GO separation
Stream Amount H+ K+ Mn+2 SO2
4 Cl
Filtrate-0 % 0.6 0.67 0.97 31.4 –
gr 1067.7 6.4 7.15 10.35 335.2 –
Filtrate-1 % 0.17 0.11 0.1 3.5 3.7
gr 510.7 0.87 0.56 0.51 17.8 18.8
Filtrate-2 % 0.08 18 ppm 16 ppm 0.069 2.8
gr 502.0 0.40 N/A N/A 0.35 14.1
Filtrate-3 % 0.08 4 ppm 1 ppm 0.018 2.8
gr 500.1 0.40 N/A N/A 0.1 14.0
Supernatant-1 % 0.001 1.3 ppm 0.04 ppm 0.012 0.02
gr 3702.5 0.0135 N/A N/A 0.44 0.74
Supernatant-2 % 0.0002 0.8 ppm 0.03 ppm 55 ppm <0.01
gr 1355.4
Supernatant-3 % None 4.2 ppm 0.02 ppm 22 ppm None
gr 1341.7
Total balance gr N/A 7.82 10.90 354.1 N/A
Calculated data
Suspension after synthesis % 0.655 0.677 0.955 30.8 –
anion amount shows a misbalance of 1.1 g (Table 1), which presumably is contained in GO. Indeed, 1.68% of sulfur or, in turn, about 5% of sulfate ion which is equivalent to 0.97 g, was found in the film obtained from Dispersion 1.
Following the third washing of the GO, the precipi-tate was mixed with water and the obtained dispersion was subjected to three washing-centrifugation steps. These additional washing steps have gradually decreased the acidity of the wash water (Table 2). Moreover, the weight of the GO gel had increased, indicating an en-hanced binding of water molecules in the GO in the gel. From the data shown inTable 2it can be also seen that the size of GO particles, as measured by DLS, in-creased as well. The ratio of the Gel weights to that of Gel-1 (‘‘weight ratio’’) and the corresponding ratios of particle diameters (‘‘diameter ratio’’) shown inTable 2
are nearly identical. This behavior is indicative of swell-ing of GO [15,17] due to bonding of more and more molecules of water.
The water bound to the GO may accumulate both in the pores and in the interlayer space. In order to verify the location of the water, XRD measurements were per-formed on films obtained form the GO gels. Fig. 1
shows a typical XRD pattern for graphite and GO. The fact that all characteristic peaks of graphite could no longer be detected while the XRD pattern for GO exhibited only one peak, indicates that a highly oxidized GO sample has been synthesized. Such patterns were re-corded for all gel samples and the average interlayer dis-tances were calculated using the Bragg law and are listed in Table 2. The crystallite sizes, also listed in Table 2, were estimated from the peak width. The most impor-tant finding is that the interlayer distance and average crystallite size were practically the same for GO films obtained from both Gel-1 and Gel-3. This means that the amount of water molecules in the interplanar space
of GO does not increase with the washing level. Proba-bly, an exfoliation process of GO particles in aqueous medium[14,15]leads to swelling of GO gels.
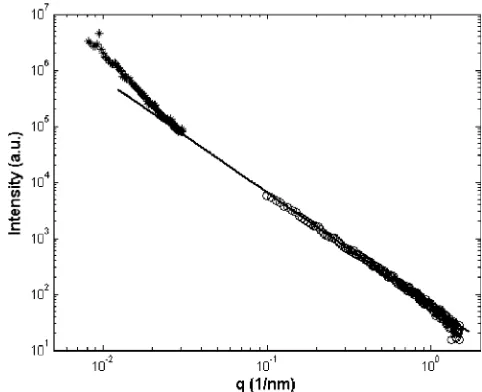
In order to obtain a better insight into the shape and the microstructure of the particles, Gel-1 and Gel-2 were analyzed using SAXS and static light scattering (SLS). The scattering pattern from the graphite-oxide aqueous dispersion is shown inFig. 2. It is evident that no peak can be observed in this pattern, especially in the high-q
[image:4.595.314.551.68.245.2]region were the inter-layer spacing may have been ex-pected. Therefore, this study indicates that the highly or-dered layered structure of graphite is not retained in the GO after graphite oxidation. Yet, the increased scatter-ing at low q evident inFig. 2is indicative of the inner structure of the graphite-oxide particles. The experimen-tal SAXS data seem to follow a power law in about one
Table 2
Characterization of GO gels
Gel-1 Gel-2 Gel-3
pH of corresponding wash water 1 2.5 4.5
Gel weight, g 301.0 361.2 456.6
Weight ratio 1 1.20 1.43
The number average diameter: Dn(nm)—DLS data
Before sonicationa 353 434 504
diameter ratio 1 1.23 1.43
After sonication for 5 min 360 478 595
GO films (XRD) Interplanar distance from
main diffraction peak, nm
0.855 N/A 0.855
Average crystalline size, nm 9.4 N/A 9.6
a The gels of GO were diluted to about 0.04%. Some relatively large
[image:4.595.311.552.493.689.2]aggregates had precipitated. This is probably the reason for the slight increase of the average diameter of nanoparticles after sonication.
Fig. 1. A typical XRD pattern for graphite (G) and GO film (GO).
[image:4.595.51.289.557.705.2]decade of scattering vectors (0.1 <q< 1.0). From a fit to the experimental data we found that this power law, shown in Fig. 2as a solid line, is q2. This power law indicates plate-like structures[19].
Proceeding further on with the understanding that the main scattering object has locally a flat rigid plate-like structure, its thickness may be evaluated by fitting the experimental data to an appropriate theoretical equation. The scattering intensityI(q) from a homoge-neous flat particle, whose in-plane dimension is much larger that its thicknessT[19]is given by:
IðqÞ ¼2pAðDqÞ 2
T2 q2
sinðqT=2Þ qT=2
2
ð1Þ
whereDq is the electron density difference between the particle and the medium. For a more realistic system, Eq. (1) is generalized to account for thickness polydispersity:
IðqÞ ¼ Z 1
0
DnðTÞ
2pAðDqÞ2T2 q2
sinðqT=2Þ qT=2
2
dT ð2Þ
whereDn(T) dTis the number of particles whose thick-ness is betweenTandT+ dT.
Initially, we have attempted to fit Eq.(2)to the exper-imental data assuming a normal distribution of the particles thickness (dashed line in Fig. 3). This yielded best-fit values of 2.0 nm for the average thickness and 1.3 nm for the standard deviation. However, although a good fit was obtained for the SAXS in the higher q -range (q> 0.1 nm1), it did not extrapolate well to the SLS data at lower q. The access scattering measured by SLS at low-q may hint that a second contribution to the scattering arises from larger structures. Indeed, fitting the curve using a bi-modal size distribution in
[image:5.595.322.525.254.709.2]Eq.(2)gave a good fit to the experimental data through-out the whole q-range (solid line in Fig. 3). This fit yielded a value of 220 nm for the average thickness of the second population and 45 nm for its standard devi-ation. The modal size distribution may reflect a bi-model population, or more likely, is due to thick plates with an inhomogeneous inner structure composed of the thinner plates. Comparing the smaller thickness dimen-sion to the interplanar distance of 0.85 nm measured by XRD, it can be suggested that each scattering object roughly contains only a few graphite oxide layers. These results imply that flat rigid plate-like GO particles form in aqueous dispersions with a highly exfoliated inner structure.
Fig. 3. A fit of the experimental scattering pattern (s) to Eq.(2), assuming a normal distribution of particle thickness (dashed line) or a bi-modal normal distribution of particle thickness (solid line).
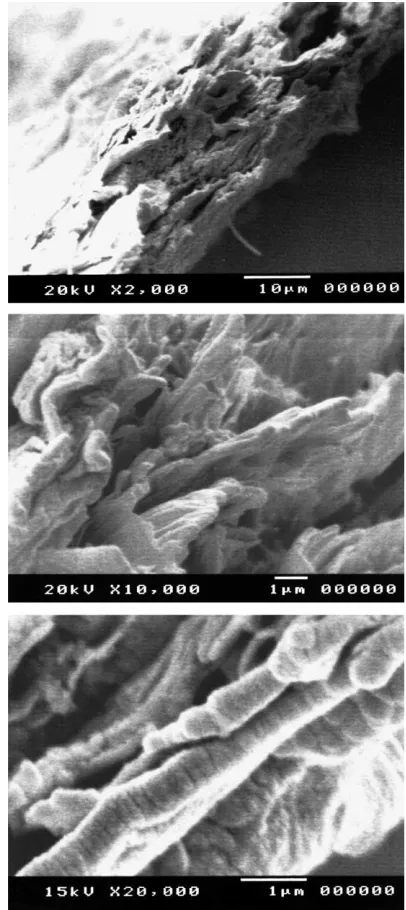
[image:5.595.43.283.505.700.2]The plate-like overall shape of GO particles is desir-able for construction of high quality films. The SEM images of cross sections of dried GO film, obtained by freeze fracture, demonstrate that a continuous film-like structure was successfully achieved by elimination of water (Fig. 4).
3.2. Storage of GO dispersion
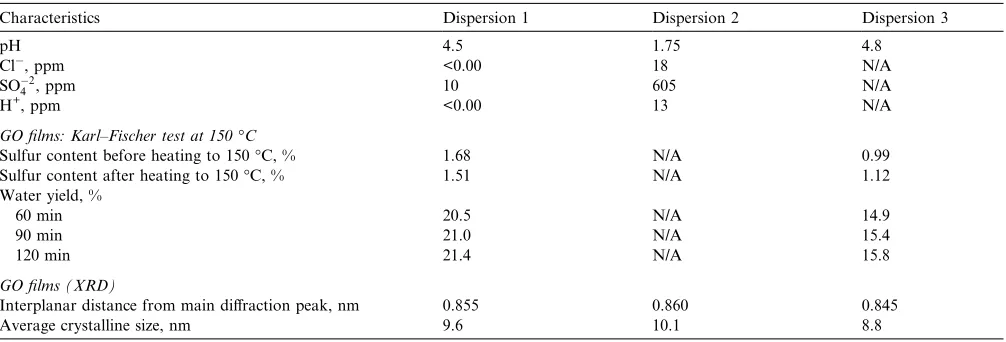
The effect of storage of the GO dispersions was inves-tigated (Table 3). Dispersion 2 is Dispersion 1 (seeTable 1) after one month of storage. As seen fromTable 3, pH was reduced due to increasing the H+ and anions con-tent in the separated transparent liquid, which was dec-anted and analyzed. The comparison of XRD data for films obtained from Dispersion-1 and GO concentrate after decantation of Dispersion-2 shows again that the crystalline parameters practically did not change. It means that hydrates of free sulfuric acid could diffuse from closed voids within GO aggregates rather than from the interplanar space.
Dispersion 3 was prepared by additional double washing of GO concentrate of Dispersion 2 with about 2500 ml water, stirring and centrifugation. Dispersion 3 appeared to be stable for several months following its preparation. Probably, the additional washing re-moves more hydrates of sulfuric acid. The interlayer dis-tance and the average crystallite size have slightly decreased (Table 3). The explanation emerges following special experiments carried out using a Karl–Fischer titration instrument for water emission on heating of the films to 150C (a temperature lower than the ‘‘def-lagration point’’[8], Fig. 5) and additional analyses of sulfur content before and after heating (Table 3). Clearly, the additional washing first and foremost leads to a significant decrease of the content of sulfuric acid hydrates in GO.
The GO film obtained from Dispersion-3 shows a higher thermal stability (Fig. 5), with reasonable agree-ment in mass loss differences between decomposition at 150 C of GO from Dispersion-1 and GO from Dis-persion-3: by TGA mass loss was 7.5%, and by heating, titration and sulfur determination mass loss was 8.2% (5.6 (H2O) + 2.6 (H2SO4)).
3.3. Characterization of GO films prepared from GO dispersions
[image:6.595.326.539.72.216.2]Significant differences in FT-IR spectra of GO films have been found as compared with literature [3]. The designations of the main IR peaks of FT-IR spectra of GO films and their comparison with literature data are summarized inTable 4. Besides common peaks assigned to water molecules and carboxyl groups, the C@C bonds and C–OH groups have not been found in our GO film, while the bands assigned to sulfate [20]were found, with a decreased intensity for the film obtained from Dispersion-3.
Table 3
Effect of GO dispersion storage and additional treatment
Characteristics Dispersion 1 Dispersion 2 Dispersion 3
pH 4.5 1.75 4.8
Cl, ppm <0.00 18 N/A
SO42, ppm 10 605 N/A
H+, ppm <0.00 13 N/A
GO films: Karl–Fischer test at 150C
Sulfur content before heating to 150C, % 1.68 N/A 0.99
Sulfur content after heating to 150C, % 1.51 N/A 1.12
Water yield, %
60 min 20.5 N/A 14.9
90 min 21.0 N/A 15.4
120 min 21.4 N/A 15.8
GO films (XRD)
Interplanar distance from main diffraction peak, nm 0.855 0.860 0.845
Average crystalline size, nm 9.6 10.1 8.8
40 50 60 70 80 90 100
0 50 100 150 200 250 300
Temperature, ºC
Weight loss, %
Dispersion 1
Dispersion 2
[image:6.595.51.554.565.736.2]Dispersion 3
The C@C bonds have not been found neither in[5,6]
nor in our NMR solid data (Table 5), most probably due to the strong oxidant KMnO4 used. The absence of C–OH groups and the presence of sulfates allow us to assume the formation of esters of sulfuric acid, most probably at high temperature during hydrolysis stage. This may be the reason why even after very strong addi-tional washing the GO film still contains sulfur (Tables 3, 4).
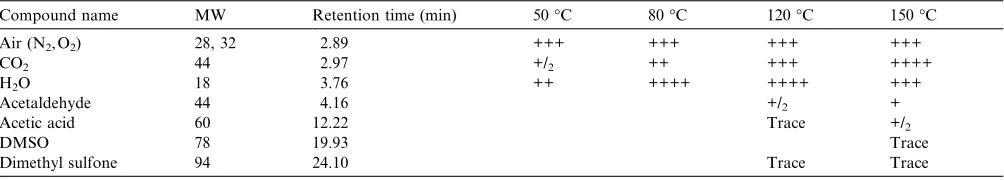
The GO film sample, heated sequentially to four dif-ferent temperatures, generated in all experiments CO2 and H2O according to GC-MS investigation (Table 6,
where the relative height of the corresponding peaks on GC/MS chromatograms is expressed by pluses). The CO2amount is enlarged when the temperature in-creases. The elimination of CO2at low temperature indi-cates a relatively high content of carboxyl groups in the studied GO sample. H2O emission was observed in higher amounts in the experiments at 80 and 120 C than in experiments at 50 and 150C.
[image:7.595.43.548.88.237.2]Additional compounds such as acetaldehyde, acetic acid, dimethyl sulfoxide (DMSO) and dimethyl sulfone, (Table 6) were found at higher temperatures (120 and 150 C) in very low amounts as compared to CO2and Table 4
FT-IR data of GO films
Wave numbers (cm1) Hontoria-Lucas et al.[3] Dispersion 1 Dispersion 3
The stretching vibration of free hydroxyl groups 3586 3532 3570
The stretching vibration of hydroxyl groups of GO 3402 3391 3408
The stretching vibration of water molecules 3195 3256 3260
The stretching vibration of carboxyl groups on the edges of the layer planes or conjugated carbonyl groups
1720 1731 1731
The deformation vibration of water molecules 1620 1622 1620
The stretching of C@C bonds 1570 Absent Absent
The vibration of O–H 1395 1361a 1398a
The vibration of C–OH 1348 Absent Absent
The vibration of covalent sulfates[18] Absent 1225 1230–1150 (weak)
Absent 1182
The vibration of C–O 1061 1053 1052
Epoxy or peroxide group 982 987 N/A
[image:7.595.42.548.455.569.2]a Accordingly to[18]the covalent sulfates have absorbance in the wave numbers interval 1440–1350 cm1too.
Table 5
13C NMR data of GO films
Sample d(ppm)
Hontoria-Lucas et al.[3] 134.3 69.7 58.8
C@C bonds in aromatic structure Hydroxyl Epoxy
Mermoux et al.[4] 132 71.2 60.2
Isolated C@C ethylenic bonds Hydroxyl 1,3 Ethers
Klinowski and coworkers[5,6] 130 70 60
C@C bonds in aromatic structure, conjugated C@C Hydroxyl Epoxy
Dispersion 1 137a 70 60
C–C single bonds, probably C@O single bondsb hydroxyl epoxy
a
Peak has low intensity and the highest shift as compared with a very intensive band at around 127 ppm for partially oxidized GO[3].
b
Additionally in the NMR spectrum a very weak and wide peak at 180–200 ppm for keto groups was observed. It should be noted that Hontoria-Lucas et al. also observed the peak at around 180 ppm when the oxidation degree increases[3].
Table 6
Decomposition of GO film obtained from Dispersion 3
Compound name MW Retention time (min) 50C 80C 120C 150C
Air (N2, O2) 28, 32 2.89 +++ +++ +++ +++
CO2 44 2.97 +/2 ++ +++ ++++
H2O 18 3.76 ++ ++++ ++++ +++
Acetaldehyde 44 4.16 +/2 +
Acetic acid 60 12.22 Trace +/2
DMSO 78 19.93 Trace
Dimethyl sulfone 94 24.10 Trace Trace
[image:7.595.43.545.637.727.2]H2O. These compounds were observed only using ion extract technique (m/z= 44, 60, 78 and 94 amu) from the GC/MS chromatograms.
Data of GC/MS experiments confirm the presence in GO of water and a lot of carboxyl groups because car-boxyl groups may be the major source of CO2. On the other hand, in gases released at 150 C no product of sulphate ion reduction by carbon was found, and other sulphur containing compounds were observed only in trace amounts (Table 6). This result is in a good agree-ment with the rise of sulfur content in solid GO after heating at the same temperature (Karl–Fischer test, Ta-ble 3).
4. Conclusions
In order to create a basis for fundamental under-standing and possible commercialization of graphite oxide, the GO synthesis and GO properties have been studied in more detail. A highly oxidized graphite oxide was synthesized from a natural graphite powder by oxi-dation with KMnO4in concentrated H2SO4followed by hydrolysis, washing and centrifugation.
Study of filtrates and supernatants on corresponding GO preparation steps shows that K2SO4and MnSO4in major amounts can be removed from GO and GO does not contain potassium and manganese. On the other hand, the sulfate anion amount shows a misbalance con-firmed by the fact that the solid GO contains sulfur.
The hydrates of free sulfuric acid could diffuse from closed voids within GO aggregates rather than from the interlayer space The additional washing of GO pro-vides a significant decrease of sulfuric acid hydrates con-tent in GO resulting in a higher thermal stability of the solid GO.
The properties of colloidal GO dispersions have been studied in order to estimate their potential for direct use in various applications. It was found that the properties of GO dispersion are dependent on the GO structure at particles level rather than at crystalline level. SAXS and LS measurements confirm that the structure of the GO particles in colloids consists of plate-like objects, mostly containing only a few layers, with a small population of thicker aggregates. The studied GO contains an abun-dance of carboxyl groups, large amounts of sulfate and practically does not contain free hydroxyl groups. It is assumed that at the high temperature in the hydro-lysis stage, the hydroxyl groups may have been esterified by sulfuric acid. The spectroscopic and C13NMR anal-ysis shows elimination of C@C bonds due to strong oxidation.
GO films may be easily prepared from dispersion of GO obtained in different synthesis stages. SEM images of cross sections of dried GO film, obtained by freeze fracture, demonstrate that a continuous film-like
struc-ture was successfully achieved by elimination of water localized within exfoliated GO particles in the swelled GO aqueous colloidal dispersions.
Finally, for every GO application, consideration must be given to the GO preparation method, micro-structure, washing level, impurities content. It seems that for the direct use of GO dispersion for preparation of nanocomposites with polymers there is no need for a very intensive GO washing, while for the preparation of catalysts the impurities should be removed for otherwise they may poison the catalyst. Effect of the direct use of GO dispersions on structure and properties of GO nanocomposites with polymers will be studied in the future.
Acknowledgments
Financial support from the Israel Ministry of Indus-try and Commerce, by the NFM-MAGNET program is gratefully acknowledged. We also thank Professor Asher Schmidt from the Chemistry Department at the Technion for his help with the NMR measurements, and Mr. Igal Gozlan from IMI for his help with the GC/MS measurements.
References
[1] Hennig GR. Interstitial compounds of graphite. Progr Inorg Chem 1959;1:125–205.
[2] Hummers WS, Offeman RE. Preparation of graphite oxide. J Amer Chem Soc 1958;80:1339.
[3] Hontoria-Lucas C, Lopez-Peinado AJ, de Lopez-Gonzalez JD, Rojas-Cervantes ML, Martin-Aranda RM. Study of oxygen-containing groups in a series of graphite oxides: physical and chemical characterization. Carbon 1995;33(11):1585–92. [4] Mermoux M, Chabre Y, Rousseau A. FTIR and13C NMR study
of graphite oxide. Carbon 1991;29(3):469–74.
[5] He H, Klinowski J, Forster M, Lerf A. A new structural model for graphite oxide. Chem Phys Lett 1998;287:53–6.
[6] Lerf A, He H, Forster M, Klinowsky J. Structure of graphite oxide revisited. J Phys Chem 1998;B102:4477–82.
[7] Scholz W, Boehm HP. Thermal decomposition of graphite oxide. Naturwissenschaften 1964;51(7):160.
[8] Boehm HP, Scholz W. ‘‘Deflagration point‘‘ of graphite oxide. Z Anorg Allg Chem 1965;335(1–2):74–9.
[9] Fendler JH. Colloid chemical approach to the construction of high energy density rechargeable lithium-ion batteries. J Dispers Sci Technol 1999;20(1–2):13–25.
[10] Muradyan VE, Romanova VS, Moravsky AP, Parnes ZN, Novikov YN. A graphite oxide-based nikel catalyst for reductive dechlorination of polychlorinated aromatic hydrocarbons. Russ Chem Bull 2000;49(6):1017–9.
[11] Titelman GI, Karamarenko SV, Novikov YN, Gorozhankin EV, Golosman EZ. Catalyst for the cleaning of technological gases from oxygen. SU 1.806.005, Appl.
[13] Xu J, Hu Y, Song L, Wang O, Fan W, Chen Z. Preparation and characterization of poly (vinyl alcohol)/graphite oxide nanocom-posite. Carbon 2002;40:450–1.
[14] Xu J, Hu Y, Song L, Wang O, Fan W. Structure of poly (acrylic acid)-intercalated graphite oxide. Carbon 2002;40:2964–5. [15] Xu J, Hu Y, Song L, Wang O, Fan W. Preparation and
characterization of polyacrylamide-intercalated graphite oxide. Mater Res Bull 2001;36:1833–6.
[16] Liu P, Gong K. Synthesis of polyaniline-intercalated graphite oxide by an in situ oxidative polymerization reaction. Carbon 1999;37:706–7.
[17] Ding R, Hu Y, Gui Z, Zong R, Chen Z, Fan W. Preparation and characterization of polystyrene/graphite oxide nanocomposite by emulsion polymerization. Polym Degr Stab 2003;81:473–6. [18] Nikolaev AV, Nasarov AS, Lisitsa VV. The preparation of
graphite oxide. Russ J Inorg Chem 1974;19(12):1862–3. [19] Pedersen JS. Analysis of small-angle scattering data from colloids
and polymer solutions: modeling and least-squares fitting. Adv Colloid Interface Sci 1997;70:171–210.