AUT J. Model. Simul., 50(2) (2018) 171-180 DOI: 10.22060/miscj.2018.14594.5111
Optimal Placement of Capacitor Banks Using a New Modified Version of
Teaching-Learning- Based Optimization Algorithm
A. Rahiminejad1, A. Foroughi-Nematollahi2, B. Vahidi2*, S. Shahrooyan3
1 Department of Electrical and Computer Science, Esfarayen University of Technology, Esfarayen, Iran 2 Department of Electrical Engineering, Amirkabir University of Technology, Tehran, Iran
3 Department of English Literature, Hakim Sabzevari University, Sabzevar, Iran
ABSTRACT: Meta-heuristics optimization methods are important techniques for optimal design of the engineering systems. Numerous Meta-heuristics methods, all inspired by different nature phenomena, have been introduced in the literature. A new modified version of Teaching-Learning-Based Optimization (TLBO) Algorithm is introduced in this paper. TLBO, as a parameter-free algorithm, is based on the learning procedure of students in a classroom. In the Conventional TLBO (CTLBO), the students enhance their grade in two phases known as teacher phase and student phase. In the former, the teacher tries to enhance the average of the class. In the latter, the students share their knowledge in the groups of two. In the proposed Modified TLBO (MTLBO), the students participate in the groups of several students and improve their knowledge based on the grade of these students. Participating in the meeting with more than two students increases the probability of enhancing the student marks. To testify the performance of the proposed algorithm, it is applied to the problem of optimal capacitor placement with the aim of annual net saving maximization and system stability enhancement. The test systems are 34-bus and 94-bus radial test systems. The comparison of the results with those from off-the-shelf algorithms clears the appropriate performance, fast convergence, and superiority of the proposed algorithm.
Review History: Received: 12 June 2018 Revised: 28 October 2018 Accepted: 4 November 2018 Available Online:14November 2018
Keywords:
Teaching-Learning-Based Optimi-zation algorithm
capacitor placement net saving maximization system stability enhancement
1- Introduction
Over the last decades, lots of heuristic and population-based optimization algorithms have been introduced for solving the engineering optimization problems. Genetic Algorithms (GA) [1], Differential Evolution (DE) [2], Artificial Immune Algorithm (AIA) [3], Bacteria Foraging Optimization (BFO) [4], Particle Swarm Optimization (PSO) [5], Ant Colony Optimization (ACO) [6], Shuffled Frog Leaping (SFL) [7], and Artificial Bee Colony (ABC) algorithms [8] are a few numbers of well-known algorithms [9].
Recently, a new optimization algorithm known as Teaching– Learning–Based Optimization (TLBO) was proposed by Rao et al. [10]. It is a parameter-free algorithm which is based on the concept of the classroom teaching scenario. The algorithm has been applied into many optimization problems and the high quality performance has been concluded [11-18]. This algorithm has been improved by researchers to reach better results with faster convergence [19-24]. In this paper, an improved version of TLBO is introduced. The proposed method is applied to the problem of optimal capacitor placement and the results are compared to those of PSO (particle swarm optimization), GA (genetic algorithm), HS (heuristic search), PGSA (plant growth simulation algorithm), and EA (evolutionary algorithm).
Supplying efficient, reliable, and high quality power is the most important intent of distribution companies [25]. The active power loss of the power systems is nearly 15% which is mostly occurred in distribution networks [26]. The wasted power results in adverse impact on societies from financial,
environmental, and energy aspects. On the other side, voltage collapse due to sensitive busses threatens the power systems. Therefore, increasing the system stability and reducing the active power loss of the network are of two main goals of the utilities [27-30].
Several methods have been introduced in the literature for the loss reduction and system stability enhancement. These methods can be classified in three different groups. 1- The methods based on changing the active power flow trajectory, such as series FACTS devices (TCSC [31]) in the level of transmission grid, Reconfiguration of distribution network [32], and also placement and scheduling of Distributed Generation (DG) with the unity power factor [33] in the level of distribution. 2- The methods focusing on reducing the reactive power flow, such as parallel FACTS devices (SVC [34]), and capacitor banks placement [35] in transmission level and distribution level, respectively. 3- The methods which are combination of the both foregoing methods. DGs with non-unity power factor [36] and series-parallel FACTS devices such as UPQS [37] are examples in this category. However, it should be mentioned that in all methods, the selection of wrong place, size, and number of equipment may have inverse effects on the system performance.
Among different methods, capacitor banks placement is a good solution due to low cost and several advantages such as power losses reduction, voltage profile improvement, voltage stability enhancement, increased utilization of equipment, the unloading of overloaded system components, and stopping the premature aging of the equipment [38].
objective function and different heuristic optimization techniques [39]. Tabu search method [40], PSO [41], the harmony search algorithm [42], and GA [43] are a few numbers of published articles in the scope of OCPS problem using different methods.
In [38], OCPS is performed to minimize the power losses and maximize the voltage stability of the system while the total cost of capacitor placement is minimized. In the article, the artificial bee colony algorithm is used to maximize the total net saving. In this paper, the same work is performed using a new modified version of TLBO algorithms. The comparison of the results reveals that the performance of the proposed method is much better than the other methods.
The rest of the paper is organized as it follow. In section 2, problem formulation is presented. In section 3, the proposed MTLBO is introduced, and in section 4 the simulation results are presented. The last section concludes the paper.
2- Problem Formulation
The problem investigated in this paper is the optimal capacitor placement with the aim of total benefit maximization. The capacitor placement is performed for the peak condition of the network. The objectives of capacitor placement are active power loss reduction and static voltage stability enhancement in peak load condition, and capacitor placement cost minimization while a groups of constraints must be satisfied. This problem can be formulated as it follow [38]:
Maximize f where (1)
1 2
.( ). .[ . .NB ( )] . .Nn ( ).
e lb la ci B c c O B F
i j
f C P P T α C N C Q i C N µ VSI j
= =
= − − +
∑
− +∑
In the above optimization problem, f is the objective function;
Ce is the price of power; and Plb and Plaare power loss before and after capacitor placement, respectively. T is time period;
α is depreciation factor; µFshows magnifying factor; NB
indicates the number of buses in which capacitor banks are installed; Cci is installation cost; Ccis cost of the capacitor purchase; Co is capacitor operating cost; Qc(i) is optimization variables and represents the reactive power of installed capacitors at bus i; VSI(j) is voltage stability index of bus j; Nnis the total number of network buses.
2- 1- Active power loss reduction
Active power losses of the network are reduced after installation of capacitor banks in the distribution networks. This reduction results in the decreasing of the purchasing power from the upstream network. Therefore, loss reduction can be considered as an economic benefit of capacitor placement. To explain this, the active power loss formula is considered as it follow,
(2)
2 .
loss
k
k k
P =R I
Ploss is the active power loss of line k, Rk is the resistance of line k, and Ik is the current of line k. Ik can be rewritten as it follow,
.
j i k
k k
V V I
R jX − =
+ (3)
Vi is the voltage of bus i, and Xk is the inductance of line
k. By substituting Ik in Eq. (2), the active power loss can be represented as it follow,
2 .
j i k
loss k
k k
V V
P R
R jX − =
+ (4)
By local compensating of reactive power, the reactive power flow in the feeders is reduced. This results in reduction in the current magnitude. Therefore, voltage drop is reduced. Consequently, voltage difference in both sides of a line is reduced and as a result, based on Eq. (4), active power loss is decreased. Thus, capacitor placement reduces the active power loss which results in reduction in purchasing active power from the main network. Therefore, the first benefit of capacitor placement can be written as follow:
.( ).
e lb la
BLR C P P T= − (5)
where BLR is the benefit of loss reduction.
2- 2- Voltage stability enhancement
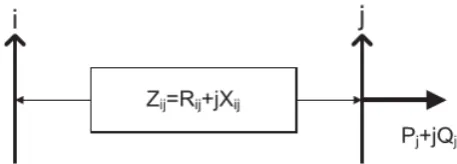
There are lots of indices introduced in the literature for evaluating the voltage stability of a power system [44-48]. In this paper the index which is introduced in [48] is used as the voltage stability index evaluation. Based on Fig. 1, the index is formulated as the following equation:
4 2 4
( ) i 4( .j ij j. )ij 4( .j ij j ij. ).i
VSI i =V − P x −Q R − P R +Q x V (6) where Pj and Qj are injected active and reactive power at bus j, Rij and Xij are resistance and inductance of line between buses i and j.
A lower value of VSI means a more sensitive bus to voltage collapse. As it can be seen, the higher values of power and reactive power flowing through the line decrease the VSI value. Thus, by reducing the line power flow, the voltage stability of the system is improved. This can be done by locally generating active and reactive power on different buses. Distributed Generation (DG) and capacitor banks can generate the active and reactive power, locally. Capacitor banks are low cost apparatuses which can be added to the system. However, since it is almost impossible to install capacitor banks in all the buses, the best location for capacitor banks should be determined. Thus, the other objective of optimal capacitor placement is to maximize the VSI of each bus and, hence, total VSI of the network.
2- 3- Capacitor placement costs
The installation of capacitor banks in distribution networks is associated with some expenditure including installation cost, purchasing cost and operation cost. Installation cost is the cost of workers and location cost. The purchasing cost consists of capacitor banks purchasing and the associated protection equipment purchasing. The cost of operation refers to maintenance and replacement cost during the life time of capacitor banks.
The cost of installation and operation are defined for each
location that capacitor banks are placed. But the cost of purchasing depends on the size of capacitor banks; thus, the purchasing cost is defined for each kVAR.
2- 4- Constraints
Power flow equations:
The power flow equations must be satisfied when the capacitor banks are installed in the network. The power flow equations include active and reactive power balance which can be shown by:
1 1 , n b N N j i
slack D l
i j
P P P
= =
=
∑ ∑
+ (7)1 1 1
n l
B N N
N
j
k i
slack C D l
k i j
Q Q Q Q
= = =
+
∑
=∑
+∑
(8)Voltage limit:
The magnitude of bus voltage must be in a predefined range as it follows:
mini i maxi
V ≤V V≤ (9)
Line thermal limit:
The feeder power flow must not violate from the thermal limit of the feeder,
limit
k k
S ≤ (10)
Reactive compensation limit:
The reactive power injected at each bus must be lower than a maximum allowable value which is formulated as the following equation:
mini Ci maxi
Q ≤Q ≤Q (11)
Power Factor constraint:
The overall power factor for a distribution network is the power factor at the slack bus which can be calculated as it follows, sub sub sub P PF S = (12)
where Psub and Ssub are the active and apparent power at the substation.
The substation power factor (PFsub) should be maintained in
a specific rang,
min sub max
PF ≤PF ≤PF (13)
Total compensation limitation:
The maximum reactive power which can be injected to the distribution network by means of capacitor banks must be lower than the total reactive power demand of the network [38]. 1 1 n B N N i i C D i j Q Q = = ≤
∑
∑
(14)2- 5- Handling constraints
To handle the constraints, a penalty factor is defined for any violated constraint. These penalty factors are large values
for violated constraints which are added to the objective function. By this method, the optimization algorithm forces the solutions towards the way that the constraints are satisfied. The penalty function can be defined as follow:
_ V S PF QT
Peanlty factor P= +P +P +P (15)
where,
max min
1 1
max(0, ) max(0, )
n n
N N
i i
V V i i
i i
P ψ V V V V
= =
= − + −
∑
∑
(16)[ ]
1
max(0, lim )
l
N
S S k k
i
P ψ S it
=
= −
∑
(17)[
]
[
]
{
max(0, max ) max(0, min )}
PF PF sub sub
P =ψ PF −PF + PF −PF (18)
1 1
max(0,NB i Nn i )
QT QT C D
i j
P ψ Q Q
= =
= −
∑
∑
(19)V
ψ , ψS, ψPF, and ψQTare large values.
2- 6- Specifying the candidate buses
Searching for the best places for the capacitor banks among the whole search space is time- and CPU- consuming. Therefore, it is better to candidate some important buses as the nominated buses for capacitor placement and search for the best place among these buses. In this paper, Loss Sensitivity Factor (LSF) is used to nominate some busses for the capacitor placement [49]. This factor identifies the lines with high active power loss and voltage drop. It is obvious that the receiving end bus of a line with high power loss and voltage drop has a higher priority for reactive compensation than the other buses. By using LSF, the buses which may have the higher influence on loss reduction are identified. Consider Fig.1. The active power loss of the line can be presented using the following equation:
2 2
2
. j j
k loss k j P Q P R V + = (20)
where Pj (Qj) is active (reactive) power injected to bus j
which includes the active (reactive) power demand at bus j
and active (reactive) power flowed through line k+1. Since
the capacitor banks compensate the reactive power of load demand, the sensitivity of power loss to the reactive load demand is evaluated using the flowing equation:
2 2 . k Dj loss k k Dj j Q P LSF R Q V ∂ = = ∂ (21)
where QDj is the reactive power of load demand at bus j.
The values of LSF are calculated for all lines and sorted in descending order. Those buses (receiving end bus of lines) with higher values of LSF are nominated for reactive compensation. The number of nominated buses is chosen according to the size of the network. Generally 20-25% of network buses is candidate for capacitor placement.
3- Proposed Optimization Algorithm
3- 1- Proposed Optimization Algorithm
which enhances the grade of the whole class. This algorithm is free of algorithm parameters, i.e. it does not require any parameter tuning for better performance. Fast convergence, small population size and good global search capability characterize the performance of the algorithm. Teacher and students are the vital components of the algorithm. The level of the class is increased in two main phases known as teacher phase and student phase. In this section, this method and its modified version are explained.
As mentioned, TLBO algorithms is a population-based algorithm. The students of the class are solutions. The most knowledgeable student, i.e. best solution, is nominated to be teacher. The process of TLBO is divided into two phases which are discussed in the following paragraphs.
Teacher phase:
The best solution is considered to be the teacher. The teacher tries to increase the level of each classroom student (for instance M1) to his or her level, say MT. However, this is not possible practically, so the teacher tries to raise the mean level of the class, say M2. It is clear that a good teacher (a solution with better fitness) can have a better performance on the class [16]. To mathematically describe the teacher phase, first the difference is calculated as follow:
_ i i( T f mean)
diff mean =r M −T M (22)
where MT is the level of teacher, Mmeanis the average of class, ri is a random variable in the interval [0, 1], and Tf is the teacher factor which can be either 1 or 2, chosen randomly.
Based on diff_mean the existing solution is updated by the
following equation:
_
new old
i i i
X =X +diff mean (23)
Student phase:
In this phase the students enhance their grade by interacting with each other. In other words, a student shares his knowledge with another student who has been selected at random from the classroom. The selected student learns new things if the other student is more knowledgeable; otherwise, the initial student learns from the selected one. For the
mathematical formulation of this phase, assume Xi and Xj
are two classroom students and i ≠j. Student’s knowledge,
say f(X), is evaluated using an objective function. A better
f(X) (lower for minimization and higher for maximization)
means a more knowledgeable student. It is assumed that the problem is maximization. Therefore, if the fitness function of Xi is higher than Xj, it means Xi is a student with a higher level of knowledge in comparison to Xj. Therefore, Xi moves
towards his direction. From a mathematical point of view, Xi
is upgraded using the following equation:
( ) ( ) ( )
new old
i i i i j i j
X =X +r X X− if f X > f X (24)
If Xj is more knowledgeable than Xi, it means Xi must move towards Xj’s direction. Thus, Xi is upgraded as follow:
( ) ( ) ( )
new old
i i i j i j i
X =X +r X −X if f X > f X (25)
In these equations, Xi is a solution and f(Xi) refers to its value of objective function. In each phase, Xnew is replaced with Xold
if a better result is achieved. The process is continued until the convergence occurs.
As one can see, there is no need for parameter tuning in this algorithm. Tf and ri are the only parameters of the algorithm, which are selected completely at random and do not need to be tuned. This is an advantage of this method compared to other optimization algorithms.
3- 2- Modified Teaching-Learning-Based Optimization (MTLBO)
As it can be seen, in CTLBO the students share their knowledge in a group of two to enhance their level. It is obvious that if the students interact with each other in groups with more than 2 students, a better performance for the entire class can be achieved. In the proposed method, in the student phase, each student takes part in a group consisting of several students and enhances his/her level by exchanging knowledge within the group. The process of solution updating is as follows: Imagine Xi is a selected student which participates in a group of several students which are selected randomly among the class. If the selected student, say Xi, has the highest level of knowledge in the group, it means the selected student is a well-educated student. The others must move towards his direction with higher speed to attain the higher level. In other words, the learning manner of this student is so good; therefore, the other students must move towards him. The mathematical description of this procedure is represented as follows:
, , ( worst)
new i old i i i g
X =X +r X −X (26)
where worst
g
X is the student with the worst level of knowledge
in the group. If the selected student is not the best student in the group, he/she must enhance his/her level according to the best member of group as follows:
, , ( best )
new i old i i g i
X =X +r X −X (26)
where best
g
X is the best member of the group. Since the learning
process of a student is based on the best or the worst student in the group of several participants, the convergence speed improves. In this paper, 5 students are considered for each group.
Limitations
Actually, MTLBO is a meta-heuristic optimization algorithm and does not need any initial condition or additional mathematical operation such as derivative. This method can be easily applied to highly constrained, non-linear, non-convex, and complex optimization problems. It can be also applied for both continuous and discrete optimization problems. However, like any other meta-heuristic optimization algorithm, there is no guarantee for finding the best global solution. Thus, it is needed to compare the results of the proposed method with those of some other methods to ensure the final results.
4- Simulation and Results
4- 1- Test results of 34-bus test system
As it can be seen in Fig. 2, the 34-bus test system is a radial test case with 4 laterals. The total load of the system is (4636.5 + j2873.5) kVA. Based on the LSF factor, the potential buses for capacitor placement are (24 9 23 22 25 19 8 21 20 ) which are the buses with high level of reactive load demand. These buses are candidate for capacitor placement to prevent searching the whole search space. To show whether searching among candidate buses leads to finding optimal results, the OCPS is performed for two cases, namely, searching in the whole search space and among the candidate buses. The results of optimal capacitor placement for the 34-bus test system are shown in Table 2. The minimum and the maximum reactive compensations are proposed by GA and HS, respectively. As it can be seen, the results of MTLBO are evaluated in two cases, namely, without LSF consideration and with LSF consideration. The former means that the whole search space is evaluated to find the best places for capacitor banks and the latter means only nominated buses, which are determined using LSF factor, are evaluated. As it can be seen in Table 2, the results with LSF and without LSF are close to each other. Therefore, searching among candidate buses not only reduces the time and space of searching, but also achieves roughly the best solutions.
The performances of the network after capacitor placement with different methods are compared in Table 3. As one can see, the best answer for objective function, which is shown in (1), is achieved by the proposed method which is followed by EA and then ABC. It should be mentioned that the solution suggested by EA has the size of 2550 kVAR compensation which is nearly 40% higher than the size suggested by MTLBO, TLBO and ABC. The maximum total VSI is achieved using the proposed method; however, the minimum active power loss and minimum reactive power loss are achieved by EA and PSO respectively while the size of reactive power compensation in these two methods
is approximately the same compared to that proposed by MTLBO. Nevertheless, the solution proposed by MTLBO has the net saving of 19732$ for a year, which is nearly 2.6% higher than the value of net saving achieved by the TLBO method as the second best results. In other words, although the solution proposed by MTLBO has a higher value of active and reactive power loss, it brings the maximum value of benefit of capacitor placement to the network. It should be also mentioned that the results of MTLBO with and without consideration of LSF factor are roughly the same. Thus, identifying the candidate buses is an effective manner to find the best solution when the volume of searching process is reduced dramatically.
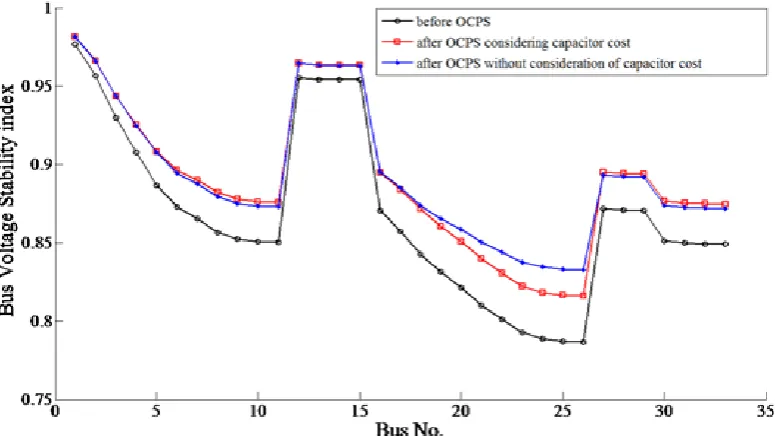
Now, the OCPS is performed for 34-bus test system as a single objective problem including loss minimization and VSI maximization. Moreover, the single-objective problem is investigated in two cases, i.e. with consideration and without consideration of capacitor cost. The results of single objective OCPS are illustrated in Table 4. As it is clear, neglecting the cost of capacitor banks in objective function results in lower power loss due to higher reactive compensation; however, the total net saving is decreased dramatically. The active power loss in case 1 (neglecting capacitor cost) is only 2.5% lower than the other case (consideration of capacitor cost) while the total net saving is decreased 47%. This scenario is much worse for the case of VSI maximization where the cost of capacitor banks is higher than the benefit of loss reduction as the capacitor cost is neglected. The comparison of VSI for all buses is presented in Fig. 4. In this figure, the VSI profile is depicted in three cases, i.e. before OCPS, after OCPS neglecting capacitor cost, and after OCPS with consideration of capacitor cost. From the figure and the results of Table 4, it can be concluded that the consideration of capacitor cost in all cases leads to a better network performance.
4- 2- Test results of 94-bus test system
To demonstrate the better performance of the proposed method compared to other methods, it is applied on OCPS for the actual Portuguese 94-bus test system. This network has the load demand of (4797 + j 2323.9) kVA. Based on LSF, 20 candidate buses are selected which are (90, 40, 88, 94, 79, 87, 58, 59, 34, 65, 84, 21, 83, 73, 38, 80, 64, 72, 66, and 89). The result of capacitor placement for 94-bus test system is presented in Table 5. The performances of the 94-bus network after OCPS with different methods are listed in
Table 1. commercial information of the test systems
Item Value
1 Average energy cost 0.06
2 Depreciation factor )%( 20
3 Purchase cost ($/kVAR) 25
4 Installation cost ($/location) 1600
5 Operating cost ($/location) 300
6 Maximum allowable compensation in each bus
(kVAR) 1500
7 Maximum allowable compensation in the netwrok
(kVAR) 3000
8 The capacity of each capacitor bank (kVAR) 50
9 Hours per year (h) 8760
Fig. 4. VIS values for all buses before OCPS, and after OCPS with consideration and without consideration of capacitor cost
Table 2. optimal placement of capacitor banks for 34-bus test system using different methods
ABC
[38] [43]GA PSO[53] [54]HS PGSA[55] [56]EA
TLBO Proposed MTLBO
With
LSF WithoutLSF WithLSF WithoutLSF
(Bus Location, compensation in kVAR )
(19, 950) (5, 300) (19, 871) (26, 1400) (19, 1200) (8, 1050) (25,650) (10,600) (9, 650) (10, 600) (24, 900) (9, 300) (22, 803) (11, 750) (22, 639) (18, 750) (21,550) (21,650) (25, 600) (25, 650) (12, 300) (20, 479) (17, 300) (20, 200) (25, 750) (9,700) (25,600) (21, 600) (20, 650) (22, 300) (4, 250)
(26, 300)
Total reactive
compensation (kVAR) 1850 1800 2063 2700 2039 2550 1900 1850 1850 1900
Table 3. comparison of 34-bus test system performance after capacitor placement using different methods
Before OCPS
After OCPS
ABC
[38] [43]GA PSO[53] [54]HS PGSA[55] [56]EA
TLBO MTLBO
With
LSF Without LSF With LSF Without LSF Value of Objective
function (Eq. 1) -- 32806 30880 30161 27162 30647 32294 33451 33254 34797 34858
Vmin(p.u.) 0.9416 0.9496 0.9478 0.9486 0.9522 0.9479 0.9501 0.949 0.9489 0.9489 0.949
Vmax(p.u.) 0.9941 0.9949 0.9949 0.9950 0.9953 0.9950 0.9952 0.995 0.995 0.9949 0.995
VSImin 0.786 0.81294 0.8071 0.8097 0.8219 0.8074 0.8149 0.812 0.8108 0.8109 0.8113
VSImax 0.9765 0.9797 0.9796 0.9800 0.9811 0.9800 0.98 0.9798 0.9799 0.9798 0.9799
VSI
∑
28.62 30.12 29.09 29.1353 29.3214 29.1149 29.2675 30.13 30.132 30.131 30.14Ploss(kW) 221.74 167.99 164.96 169.36 168.48 171.96 161.27 162.88 163.4 163.02 162.45
Reduction in Ploss (%) -- 24.24 25.61 23.62 24.02 22.45 27.27 26.54 26.31 26.46 26.73
Qloss(kVAR) 65.2230 49.015 49.9643 47.1771 48.4489 48.6740 49.0518 47.92 47.95 47.95 47.77
Reduction in Qloss (%) -- 24.85 23.39 27.67 25.72 25.37 24.79 27.19 26.47 26.35 26.63
PFoverall 0.8557 0.9798 0.9825 0.9970 0.9989 0.9738 0.9837 0.976 0.9787 0.9760 0.9781
c
Q
∑
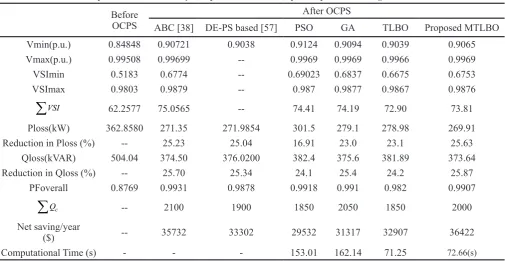
-- 1850 1800 2063 2700 2039 2550 1850 1900 1850 1900Table 6. The total reactive power compensation of proposed MTLBO is higher than DE-PS based method and lower than ABC. As it can be seen, the total VSI obtained by ABC is better than that obtained by the proposed MTLBO. But higher active and reactive power loss reduction is achieved by the solution suggested by the proposed method in comparison to two other methods. It can be also concluded from the table that the total net saving of the proposed method is better than the other methods. The total net saving increases nearly 2% with the solution proposed by MTLBO regards to ABC’s solution and 9.5% compared to the solution proposed by DE-PS based method. The bus voltage stability index after OCDE-PS is compared to that before OCPS in Fig. 5. The Fig. 5 clears the good performance of OCPS on voltage stability of the network.
4- 3- Convergence behavior
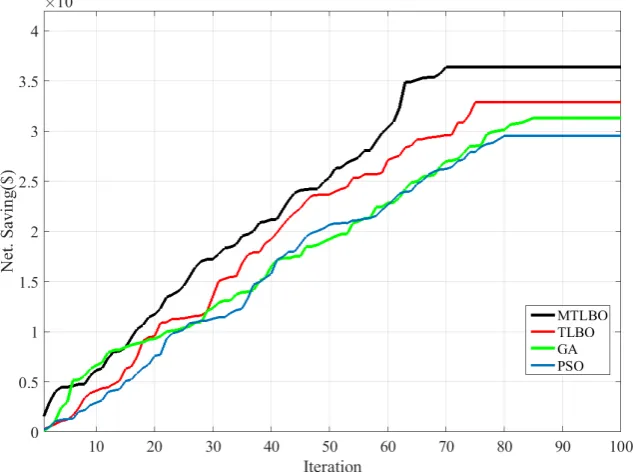
In order to show the fast convergence of the proposed modified TLBO with regards to TLBO, GA and PSO, the convergence behaviour of MTLBO for net saving maximization of 34-bus test system is compared to that of TLBO, GA and PSO in Fig. 6. It is obvious that the proposed method reaches the final best result in lower iteration which means faster convergence than other methods. Moreover, the CPU time consumption of the proposed method is much less than that of GA and PSO method. In addition, as it is obvious in Table 6 the computational time of applying MTLBO method is significantly reduced compared to that of GA and PSO methods.
Fig. 6. Convergence behavior of TLBO, PSO, GA and MTLBO
5- Conclusion
A new modified version of Teaching-Learning-Based Optimization (TLBO) algorithm is proposed in this paper. In TLBO, the students enhance their knowledge in two phases known as teacher phase and student phase. In student phase, the students share their knowledge to enhance their grade. In conventional TLBO, the students participate in the groups of two. In the proposed method, the students take part in the groups of several students. A group of several students has a better performance in enhancing the student’s grade because of more interactions. The proposed method is applied to Optimal Capacitor Placement and Sizing (OCPS) for two test systems (i.e. 34-bus and 94-bus test system). To prevent
large space searching, LSF factor is used to identify the most effective buses for loss reduction using reactive power compensation. The results of proposed method for OCPS for both test systems are compared to those of other methods. The comparison reveals that the solution suggested by proposed method betters the performance of the network substantially.
References
[1] H. Holland John, Adaptation in natural and artificial systems: an introductory analysis with applications to biology, control, and artificial intelligence, USA: University of Michigan, (1975).
[2] R. Storn, K. Price, Differential evolution–a simple and efficient heuristic for global optimization over continuous spaces, Journal of global optimization, 11(4) (1997) 341-359. [3] J.D. Farmer, N.H. Packard, A.S. Perelson, The immune
system, adaptation, and machine learning, Physica D: Nonlinear Phenomena, 22(1-3) (1986) 187-204.
[4] K.M. Passino, Biomimicry of bacterial foraging for
Table 4. 34-bust test system performance after OCPS for single objective
With consideration of capacitor cost
Without consideration of
capacitor cost Loss
minimi-zation
VSI
maximi-zation
Loss
minimi-zation
VSI
maximi-zation
VSImin 0.8109 0.8109 0.8154 0.8327
VSImax 0.9798 0.9816 0.9808 0.9815
VSI
∑
30.131 30.35 30.26 30.44Ploss(kW) 163.02 179.99 159.27 192.38
Qloss(kVAR) 47.95 50.81 46.72 53.67
PFoverall 0.9760 0.9999 0.9952 0.9998
c
Q
∑
1850 3000 2450 1850Net saving/year
($) 19732 13423 12986 -2692
Table 6. comparison of 94-bus test system performance after capacitor placement using different methods
Before OCPS
After OCPS
ABC [38] DE-PS based [57] PSO GA TLBO Proposed MTLBO
Vmin(p.u.) 0.84848 0.90721 0.9038 0.9124 0.9094 0.9039 0.9065
Vmax(p.u.) 0.99508 0.99699 -- 0.9969 0.9969 0.9966 0.9969
VSImin 0.5183 0.6774 -- 0.69023 0.6837 0.6675 0.6753
VSImax 0.9803 0.9879 -- 0.987 0.9877 0.9867 0.9876
VSI
∑
62.2577 75.0565 -- 74.41 74.19 72.90 73.81Ploss(kW) 362.8580 271.35 271.9854 301.5 279.1 278.98 269.91
Reduction in Ploss (%) -- 25.23 25.04 16.91 23.0 23.1 25.63
Qloss(kVAR) 504.04 374.50 376.0200 382.4 375.6 381.89 373.64
Reduction in Qloss (%) -- 25.70 25.34 24.1 25.4 24.2 25.87
PFoverall 0.8769 0.9931 0.9878 0.9918 0.991 0.982 0.9907
c
Q
∑
-- 2100 1900 1850 2050 1850 2000Net saving/year
($) -- 35732 33302 29532 31317 32907 36422
Computational Time (s) - - - 153.01 162.14 71.25 72.66(s)
Table 5. optimal placement of capacitor placement in 94-bus test system
MTLBO LocationSize 58 84 72 89 Total=2000
(kVAR) 850 500 400 250
TLBO LocationSize 59 83 90 72 Total=2050
(kVAR) 800 500 300 450
GA LocationSize 87 84 73 65 Total=1850
(kVAR) 250 600 450 450
PSO LocationSize 73 84 58 90 Total=1850
distributed optimization and control, IEEE control systems, 22(3) (2002) 52-67.
[5] J. Kennedy, R. Eberhart, PSO optimization, in: Proc. IEEE Int. Conf. Neural Networks, IEEE Service Center, Piscataway, NJ, 1995, pp. 1941-1948.
[6] M. Dorigo, V. Maniezzo, A. Colorni, Positive feedback as a search strategy. Dipartimento di Elettronica, Politecnico di Milano, Italy, Tech. Rep. 91-016, 1991.
[7] M.M. Eusuff, K.E. Lansey, Optimization of water distribution network design using the shuffled frog leaping algorithm, Journal of Water Resources planning and management, 129(3) (2003) 210-225.
[8] D. Karaboga, An idea based on honey bee swarm for numerical optimization, Technical report-tr06, Erciyes university, engineering faculty, computer engineering department, 2005.
[9] A.F. Nematollahi, A. Rahiminejad, B.J.A.S.C. Vahidi, A novel physical based meta-heuristic optimization method known as lightning attachment procedure optimization, 59 (2017) 596-621.
[10] T. Back, Evolutionary algorithms in theory and practice: evolution strategies, evolutionary programming, genetic algorithms, Oxford university press, 1996.
[11] R.V. Rao, V. Savsani, J. Balic, Teaching–learning-based optimization algorithm for unconstrained and constrained real-parameter optimization problems, Engineering Optimization, 44(12) (2012) 1447-1462.
[12] R. Venkata Rao, V. Patel, Multi-objective optimization of combined Brayton and inverse Brayton cycles using advanced optimization algorithms, Engineering Optimization, 44(8) (2012) 965-983.
[13] S.C. Satapathy, A. Naik, Data clustering based on teaching-learning-based optimization, in: International Conference on Swarm, Evolutionary, and Memetic Computing, Springer, 2011, pp. 148-156.
[14] V. Toğan, Design of planar steel frames using teaching–
learning based optimization, Engineering Structures, 34 (2012) 225-232.
[15] R. Venkata Rao, V. Kalyankar, Parameter optimization of machining processes using a new optimization algorithm, Materials and Manufacturing Processes, 27(9) (2012) 978-985.
[16] R.V. Rao, V.J. Savsani, D. Vakharia, Teaching– learning-based optimization: an optimization method for continuous non-linear large scale problems, Information Sciences, 183(1) (2012) 1-15.
[17] S.C. Satapathy, A. Naik, K. Parvathi, Unsupervised feature selection using rough set and teaching learning-based optimisation, International Journal of Artificial Intelligence and Soft Computing, 3(3) (2013) 244-256. [18] S.C. Satapathy, A. Naik, K. Parvathi, Unsupervised
feature selection using rough set and teaching learning-based optimisation, International Journal of Artificial Intelligence and Soft Computing, 3(3) (2013) 244-256. [19] S.C. Satapathy, A. Naik, K. Parvathi, Weighted
teaching-learning-based optimization for global function optimization, Applied Mathematics, 4(03) (2013) 429. [20] S.C. Satapathy, A. Naik, K. Parvathi, A teaching
learning based optimization based on orthogonal design for solving global optimization problems, SpringerPlus, 2(1) (2013) 130.
[21] D. Chen, F. Zou, Z. Li, J. Wang, S. Li, An improved teaching–learning-based optimization algorithm for solving global optimization problem, Information Sciences, 297 (2015) 171-190.
[22] S.C. Satapathy, A. Naik, Modified Teaching–Learning-Based Optimization algorithm for global numerical optimization—A comparative study, Swarm and Evolutionary Computation, 16 (2014) 28-37.
[23] R.V. Rao, V. Patel, An improved teaching-learning-based optimization algorithm for solving unconstrained optimization problems, Scientia Iranica, 20(3) (2013) 710-720.
[24] B. Mandal, P.K. Roy, Optimal reactive power dispatch using quasi-oppositional teaching learning based optimization, International Journal of Electrical Power & Energy Systems, 53 (2013) 123-134.
[25] N. Khalesi, N. Rezaei, M.-R. Haghifam, DG allocation with application of dynamic programming for loss reduction and reliability improvement, International Journal of Electrical Power & Energy Systems, 33(2) (2011) 288-295.
[25] N. Khalesi, N. Rezaei, M.-R. Haghifam, DG allocation with application of dynamic programming for loss reduction and reliability improvement, International Journal of Electrical Power & Energy Systems, 33(2) (2011) 288-295.
[27] A. Forooghi Nematollahi, A. Dadkhah, O. Asgari Gashteroodkhani, B.J.J.o.R. Vahidi, S. Energy, Optimal sizing and siting of DGs for loss reduction using an iterative-analytical method, 8(5) (2016) 055301.
[28] A. Foroughi Nematollahi, A. Rahiminejad, B. Vahidi, H. Askarian, A.J.J.o.R. Safaei, S. Energy, A new evolutionary-analytical two-step optimization method for optimal wind turbine allocation considering maximum capacity, 10(4) (2018) 043312.
[29] M. Hamzeh, B. Vahidi, A.F.J.I.T.o.I.I. Nematollahi, Optimizing Configuration of Cyber Network Considering Graph Theory Structure and Teaching-Learning-Based Optimization (GT-TLBO), (2018).
[30] K. Moosavi, B. Vahidi, H. Askarian Abyaneh, A.J.J.o.R. Foroughi Nematollahi, S. Energy, Intelligent control of power sharing between parallel-connected boost converters in micro-girds, 9(6) (2017) 065504.
[31] G.I. Rashed, Y. Sun, H. Shaheen, Optimal TCSC placement in a power system by means of Differential Evolution Algorithm considering loss minimization, in: Industrial Electronics and Applications (ICIEA), 2011 6th IEEE Conference on, IEEE, 2011, pp. 2209-2215. [32] R.S. Rao, K. Ravindra, K. Satish, S. Narasimham,
Power loss minimization in distribution system using network reconfiguration in the presence of distributed generation, IEEE transactions on power systems, 28(1) (2013) 317-325.
Pleasecitethisarticleusing:
A. Rahiminejad, A. Foroughi Nematollahi, B. Vahidi, S. Shahrooyan, Optimal Placement of Capacitor Banks Using a New Modified Version of Teaching-Learning- Based Optimization Algorithm , AUT J. Model. Simul., 50(2) (2018) 171-180. DOI: 10.22060/miscj.2018.14594.5111
electronics, 60(4) (2013) 1700-1708.
[34] R. Sirjani, A. Mohamed, H. Shareef, Optimal allocation of shunt Var compensators in power systems using a novel global harmony search algorithm, International Journal of Electrical Power & Energy Systems, 43(1) (2012) 562-572.
[35] A.A. El-Fergany, Optimal capacitor allocations using evolutionary algorithms, IET Generation, Transmission & Distribution, 7(6) (2013) 593-601.
[36] S. Kansal, V. Kumar, B. Tyagi, Optimal placement of different type of DG sources in distribution networks, International Journal of Electrical Power & Energy Systems, 53 (2013) 752-760.
[37] G.I. Rashed, Y. Sun, K.A. Rashed, H. Shaheen, Optimal location of unified power flow controller by differential evolution algorithm considering transmission loss reduction, in: Power System Technology (POWERCON), 2012 IEEE International Conference on, IEEE, 2012, pp. 1-6.
[38] A.A. El-Fergany, A.Y. Abdelaziz, Capacitor placement for net saving maximization and system stability enhancement in distribution networks using artificial bee colony-based approach, International Journal of Electrical Power & Energy Systems, 54 (2014) 235-243. [39] R. Sirjani, A. Mohamed, H. Shareef, Heuristic
optimization techniques to determine optimal capacitor placement and sizing in radial distribution networks:
a comprehensive review, Przegląd Elektrotechniczny
(Electr. Rev.), 88(7a) (2012) 1-7.
[40] R.A. Gallego, A.J. Monticelli, R. Romero, Optimal capacitor placement in radial distribution networks, IEEE Transactions on Power Systems, 16(4) (2001) 630-637. [41] S. Singh, A. Rao, Optimal allocation of capacitors in
distribution systems using particle swarm optimization, International Journal of Electrical Power & Energy Systems, 43(1) (2012) 1267-1275.
[42] R. Sirjani, A. Mohamed, H. Shareef, Optimal Capacitor Placement in a Radial Distribution System using Harmony Search Algorithm, Journal of Applied Sciences, 10(23) (2010) 2998-3006.
[43] K. Swarup, Genetic algorithm for optimal capacitor allocation in radial distribution systems, in: Proceedings of the 6th WSEAS international conference on evolutionary, Lisbon, Portugal, 2005, pp. 152-159. [43] K. Swarup, Genetic algorithm for optimal capacitor
allocation in radial distribution systems, in: Proceedings of the 6th WSEAS international conference on evolutionary, Lisbon, Portugal, 2005, pp. 152-159. [45] M. Kashem, V. Ganapathy, G. Jasmon, Network
reconfiguration for enhancement of voltage stability
in distribution networks, IEE Proceedings-Generation, Transmission and Distribution, 147(3) (2000) 171-175. [46] J.-R. Shin, B.-S. Kim, J.-B. Park, K.Y. Lee, A new
optimal routing algorithm for loss minimization and voltage stability improvement in radial power systems, IEEE Transactions on Power Systems, 22(2) (2007) 648-657.
[47] M. Aman, G. Jasmon, H. Mokhlis, A. Bakar, Optimal placement and sizing of a DG based on a new power stability index and line losses, International Journal of Electrical Power & Energy Systems, 43(1) (2012) 1296-1304.
[48] M. Chakravorty, D. Das, Voltage stability analysis of radial distribution networks, International Journal of Electrical Power & Energy Systems, 23(2) (2001) 129-135.
[49] G.W. Ault, J.R. McDonald, Planning for distributed generation within distribution networks in restructured electricity markets, IEEE Power Engineering Review, 20(2) (2000) 52-54.
[50] R.V. Rao, V.J. Savsani, D. Vakharia, Teaching–learning-based optimization: a novel method for constrained mechanical design optimization problems, Computer-Aided Design, 43(3) (2011) 303-315.
[51] M. Haque, Capacitor placement in radial distribution systems for loss reduction, IEE Proceedings-Generation, Transmission and Distribution, 146(5) (1999) 501-505. [52] A.D.F. Pires, C.H. Antunes, G. António, An nsga-ii
approach with local search for a var planning multi-objective problem, (2009).
[53] K. Prakash, M. Sydulu, Particle swarm optimization based capacitor placement on radial distribution systems, in: Power Engineering Society General Meeting, 2007. IEEE, IEEE, 2007, pp. 1-5.
[54] M. Chis, M. Salama, S. Jayaram, Capacitor placement in distribution systems using heuristic search strategies, IEE Proceedings-Generation, Transmission and Distribution, 144(3) (1997) 225-230.
[55] R.S. Rao, S. Narasimham, M. Ramalingaraju, Optimal capacitor placement in a radial distribution system using plant growth simulation algorithm, International journal of electrical power & energy systems, 33(5) (2011) 1133-1139.
[56] A. Elmaouhab, M. Boudour, R. Gueddouche, New evolutionary technique for optimization shunt capacitors in distribution networks, Journal of Electrical Engineering, 62(3) (2011) 163-167.
![Fig. 2. Single line diagram of the 34-bus radial test system[51]](https://thumb-us.123doks.com/thumbv2/123dok_us/8944164.1853532/5.595.34.285.188.355/fig-single-line-diagram-bus-radial-test.webp)