Color Image Segmentation Based on Mean Shift and Normalized
Cuts
Asmita Patel 1, Krupali Umaria 2
1 Research Scholar, Electronics and Communications, CGPIT, UTU, Bardoli, India
2Professor, Electronics and Communications, CGPIT, UTU, Bardoli, India
Abstract
Image segmentation is a process of dividing an image into different regions such that each region is nearly homogeneous. In this correspondence, we can develop a novel approach that provides effective and robust segmentation of color images. By incorporating the advantages of the mean shift (MS) segmentation and the normalized cut (Ncut) methods. It requires low computational complexity and is therefore very feasible for real-time image segmentation processing. It preprocesses an image by using the MS algorithm to form segmented regions that preserve the desirable discontinuity characteristics of the image. The segmented regions are then represented by using the graph structures, and the N cut method is applied to perform globally optimized clustering. Because the numbers of the segmented regions is much smaller than that of the image pixels. It allows a low-dimensional image clustering with significant reduction of the complexity compared to conventional graph partitioning methods that are directly applied to the image pixels. In addition, the image clustering using the segmented regions, instead of the image pixels, also reduces the sensitivity to noise and results in enhanced image segmentation performance. Furthermore, to avoid some inappropriate partitioning when considering every region as only one graph node, also we can develop an improved segmentation strategy using multiple child nodes for each region.. Keywords: color image segmentation,graph portioning,mean shift(MS),feature-space,normalized cut(Ncut)..
1. Introduction
Image segmentation is an important topic in computer vision. Generally, it has two objectives. The first objective is to decompose the image into parts for further analysis. The second objective is to perform a change of representation. A wide range of computational vision problems can make good use of segmented images, such as classification and recognition. Although the image segmentation problem is not solved, many excellent algorithms were developed in the past, such as the watershed algorithm, region growing and level set based methods. Recently, two types of algorithms: Graph Cut and Mean Shift were developed and showed verygood results. In this project, now I proposed the algorithm i.e mean shift algorithm and got some insights into them. Image
organization methods based on the fusion of the feature and spatial information. In such approaches, visual group is based on several key factors such as similarity, proximity, and continuation. The common theme underlying these approaches is the formation of a weighted graph, where each vertex corresponds to an image pixel or a region, and the weight of each edge connecting two pixels or two regions represents the likelihood that they belong to the same segment.The weights are usually related to the color and texture features, as well as the spatial characteristic of the corresponding pixels or regions. A graph is partitioned into multiple components that minimize some cost function of the vertices in the components and/or the boundaries between those components. So far, several graph cut-based methods have been developed for image segmentations. For example, Shi and Malik proposed a general image segmentation approach based on normalized cut (Ncut) by solving an eigensystem, and Wang and Siskind developed an image-partitioning approach by using a complicated graph reduction. Besides graphbased approaches, there are also some other types of image segmentation approaches that mix the feature and spatial information.
This correspondence concerns a Ncut method in a large scale. It has been empirically shown that the Ncut method can robustly generate balanced clusters and is superior to other spectral graph partitioning methods, such as average cut and average association . The Ncut method has been applied in video summarization, scene detection , and cluster-based image retrieval . However, image segmentation approaches based on Ncut, in general, require high computation complexity and, therefore, are not suitable for real-time processing .An efficient solution to this problem is to apply the graph representation strategy on the regions that are derived by some region segmentation method. For example, Makrogiannis et al.
developed an image segmentation method that incorporates region based segmentation and graph-partitioning approaches. This method first produces a set of over segmented regions from an image by using the watershed algorithm, and a graph structure is then applied to represent the relationship between these regions. The overall segmentation performance of the region-based graph-partitioning approaches is sensitive to the region segmentation results and the graph grouping strategy. The inherent over segmentation effect of the watershed algorithm used to produces a large number of small but quasi-homogenous regions, which may lead to a loss in the salient features of the overall image and, therefore, yield performance degradation in the consequent region grouping. To overcome these problems, we propose in this correspondence a novel approach that provides effective and robust image segmentation with low computational
complexity by incorporating the mean shift (MS) and the Ncut methods. In the proposed method, we first perform image region segmentation by using the MS algorithm , and we then treat these regions as nodes in the image plane and apply a graph structure to represent them. The final step is to apply the Ncut method to partition these regions. The MS algorithm is a robust feature-space analysis approach [4] which can be applied to discontinuity preserving smoothing and image segmentation problems. It can significantly reduce the number of basic imageentities, and due to the good discontinuity preserving filtering characteristic, the salient features of the overallimage are retained. The latter property is particularly important in the partitioning of natural images, in which only several distinct regions are used in representing different scenes such as sky, lake, sand beach, person, and animal, whereas other information within a region is often less important and can be neglected. However, it is difficult to partition a natural image into significative regions to represent distinct scenes, depending only on the MS segmentation algorithm. The main reason is that the MS algorithm is an unsupervised clustering-based segmentation method, where the number and the shape of the data cluster are unknown a priori. Moreover, the termination of the segmentation process is based on some region-merging strategy applied to the filtered image result, and the number of regions in the segmented image is mainly determined by the minimum number of pixels in a region, which is denoted as
M (i.e., regions containing less than M pixels will be eliminated and merged into its neighboring region). In our proposed approach, therefore, an appropriate value of M is chosen to yield a good region representation in the sense that the number of segmented regions is larger than the number of typical scenes, but is much smaller than the number of pixels in the image, and the boundary information of the typical scenes is retained by the boundaries of the regions.
segmentation much more practically implemental. On the other hand, due to some approximation in the implementation of the Ncut method, the segmentation processing of a graph exploiting the lower dimensional region-based weight matrix also provides more precise and robust partitioning performancecompared to that based on the pixel-based weight matrix.
2. MS and Graph Partitioning
2.1 Image Region Segmentation Based on MS
The computational module based on the MS procedure is an extremely versatile tool for feature-space analysis. In two applications of the feature-space analysis technique are discussed based on the MS Procedure: discontinuity preserving filtering and the segmentation of gray-level or color images.
2.2 Spectral Graph Partitioning
Among many graph theoretic algorithms, spectral graph partitioning methods have been successfully applied to many areas in computer vision, including motion analysis, image segmentation, image retrieval, video summarization, and object recognition . In this correspondence, we use one of these techniques, namely, the Ncut method , for region clustering. Roughly speaking, a graph-partitioning method attempts to organize nodes into groups such that the intra group similarity is high and the intergroup similarity is low. Given a graph G = (V,E,W), where V is the set of nodes, and E is the set of edges connecting the nodes. A pair of nodes u and ν is connected by an edge and is weighted by w(u, ν) = w(ν, u) ≥ 0 to measure the dissimilarity between them. W is an edge affinity matrix withw(u, ν) as its (u, ν)th element. The graph can be partitioned into two disjoint sets A and B = V –A by removing the edges connecting the two parts. The degree of dissimilarity between the two sets can be computed as a total weight of the removed edges. This closely relates to a mathematical formulation of a cut.
∑
∈ ∈=
B v A uv
u
w
B
A
cut
,)
,
(
)
,
(
This problem of finding the minimum cut has been well studied . However, the minimum cut criterion favors grouping small sets of isolated nodes in the graph because the cut defined in (1) does not contain any intra group information [23]. In other words, the minimum cut usually yields over clustered results when it is recursively applied.
This motivates several modified graph partition criteria, including the Ncut.
)
,
(
)
,
(
)
,
(
)
,
(
)
,
(
V
B
assoc
B
A
cut
V
A
assoc
B
A
cut
B
A
Ncut
=
+
where assoc(A,V) denotes the total connection from nodes in A to all nodes in the graph, and asso(B,V) is similarly defined. Unlike the cut criterion that has a bias in favor of cutting small sets of nodes, the Ncut criterion is unbiased. .
3. Proposed Apporoach
3.1 Description of the Algorithm Scheme
We now describe our proposed algorithm. From a data-flow point of view, the outline of the proposed algorithm can be characterized as the following. First, an image is segmented into multiple separated regions using the MS algorithm. Second, the graph representation of these regions is constructed, and thedissimilarity measure between the regions is defined. Finally, a graph-partitioning algorithm based on the Ncut is employed to form the final segmentation map. The regions produced by the MS segmentation can be represented by a planar weighted region adjacency graph (RAG) G = (V,E,W) that incorporates the topological information of the image structure and region connectivity. The majority of region-merging algorithms define the region dissimilarity metric as the distance between two adjacent regions in an appropriate feature space. This dissimilarity metric plays a decisive role in determining the overall performance of the image segmentation process. To define the measure of dissimilarity between neighboring regions, we first define an appropriate feature space. Features like color, texture, statistical characteristics, and 2-D shape are useful for segmentation purposes and can be extracted from an image region.
We adopt the color feature in this paper because it is usually the most dominant and distinguishing visual feature and adequate for a number of segmentation tasks. The average color components are computed over a region’s pixels and are described by a three-element color vector. When an image is segmented based on the MS method into
n regions Ri, i = 1, . . . , n, the mean vector X̄ Ri = {x̄1i, x̄2i, x̄3i} is computed for each region, where x̄1i, x̄2i, x̄3i are the mean pixel intensities of the ith region in the three different color spaces, respectively
L*a*b* have been particularly designed to closely approximate the perceptually uniform color spaces. In both cases, L*, which is the lightness (relative brightness) coordinate, is defined in the same way. The two spaces differ only in the chromaticity coordinates, and in practice, there is no clear advantage of using one over the other.
3.2 Performance Evaluation
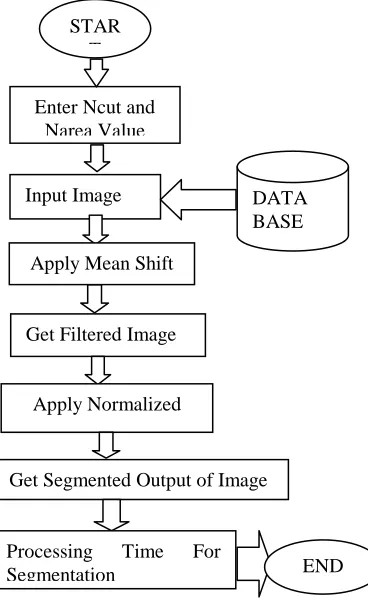
A set of images is used to evaluate the performance of the proposed algorithm as well as some of the commonly used algorithms presented in the literature. The flow chart of the algorithm as shown below.
Fig. 1. Flowchart of color image segmentation on mean shift and normalized cut.
The color input image takes from the data base. Before that set the value of ncut area and ncut. After setting these two value take color image as input for processing. By taking the input value apply the mean shift algorithm, get output of mean shift algorithm as filtered image then apply normalized cuts algorithm with four steps as discussed above section and finally get the output of input image that segmented into number of meaningful images. It also get the processing time.
3.3 RGB Color Model
This model has primary colors like red, green, blue. Most of the CRT monitors and color raster graphics make use of the RGB color model.This model uses Cartesian coordinate system. The colors in this model are called “Additive primaries”, because desired colors can be produced by adding them together.
3.4 HSV Color Model
HSV color model stands for Hue Saturation Value color model. This model describes colors in terms of their shades and brightness (Luminance). This model offers a more intuitive representation of relationship between colors. Basically a color model is the specification of coordinate system and a subspace within that, where each color is represented in single point
3.4.1 HUE
HUE represents the dominant wavelength in light. It is the term for the pure spectrum colors. Hue is expressed from 0º to 360º. It represents hues of red (starts at 0º), yellow (starts at 60º), green (starts at 120º), cyan (starts at 180º), blue (starts at 240º) and magenta (starts at 300º). Eventually all hues can be mixed from three basic hues known as primaries
STAR T
Enter Ncut and Narea Value
Input Image DATA
BASE
Apply Mean Shift
Get Filtered Image
Apply Normalized
Get Segmented Output of Image
Processing Time For
Fig. 2 Colors of HUE
3.4.2 Saturation
Saturation represents the dominance of hue in color. It can also be thought as the intensity of the color. It is defined as the degree of purity of color. A highly saturated color is vivid, whereas a low saturated color is muted. When there is no saturation in the image, then the image is said to be a grey image.
3.4.3 Value
It describes the brightness or intensity of the color. In other words value is defined as a relative lightness or darkness of color.
3.5 Converting RGB to HSV Color Model
HSV colors are said to lie within a triangle whose vertices are defined by the three primary colors in RGB space. The hue of the point P is given by the angle between the line connecting P to the center of the triangle and line connecting the RED point to the center of the triangle.
4. Conclusions
The color image segmentation based on mean shift and normalized cuts good results for image segmentation. Segmentation is an inherently subjective problem and quantitatively measuring performance of different segmentation algorithms is extremely tricky since there is no real “correct” answer to be compared with. Thus, the user should be able to parametrically control the segmentation that is achieved and this is provided for in the parameters of the weight function in all the graph theoretic formulations. The proposed method requires significantly lower computational complexity and, therefore, is feasible to real-time image processing. In this Project, a study of an algorithm for the segmentation of color images is carried out. The proposed algorithm takes the advantages of the MS segmentation method, whereas their drawbacks are avoided. The use of the MS method permits the formation of segments that preserve discontinuity characteristic of an image.
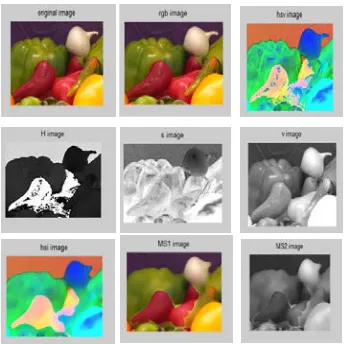
Fig. 3 Results of Mean Shift Algorithm
Fig. 4 RGB to HSV conversion
Acknowledgments
The authors would like to thank for anonymous reviewers for their valuable comments.
References
[1] Y. Cheng, “Mean shift, mode seeking, and clustering,” IEEE Trans. Pattern Anal. Mach. Intell., vol. 17, no.8, pp. 790–799, Aug. 1995. [2] N. Pal and S. Pal, “A review on image segmentation techniques,”
Pattern Recognit., vol. 26, no. 9, pp. 1277–1294, Sep. 1993. [3] J. Shi and J. Malik, “Normalized cuts and image segmentation,”
IEEE Trans. Pattern Anal. Mach. Intell., vol. 22, no. 8,pp. 888– 905, Aug. 2000.
[4] H. D. Cheng, X. H. Jiang, Y. Sun, and J. Wang, “Color image segmentation: Advances and prospects,”Pattern Recognit., vol. 34, no. 12, pp. 2259–2281, Dec. 2001.
[5] Y. Chen, J. Z. Wang, and R. Krovetz, “CLUE: Cluster-based retrieval of images by unsupervised learning,” IEEE Trans. Image Process., vol. 14, no. 8, pp. 1187–1201, Aug. 2005.
[6] Anil k. Jain, fundamentals of digital image processing,pearson education,new jersey, U.S.A.1989.
Rafael c. Gonzalez,Richard E. Woods, digital image processing,third edition, pearson education,2008.
[7] W.K.Pratt, digital image processing,john wiley and sons. S. X. Yu and J. Shi, “Multiclass spectral clustering,” in Proc. Int.
Conf. Comput. Vis., 2003, pp. 313–319.
[8] Y. Chen, J. Z. Wang, and R. Krovetz, “CLUE: Cluster-based retrieval of images by unsupervised learning,”IEEE Trans. Image Process., vol. 14, no. 8, pp. 1187–1201, Aug. 2005.
[9] D. Comaniciu and P. Meer, “Mean shift: A robust approach toward feature space analysis,” IEEE Trans.Pattern Anal. Mach. Intell., vol. 24, no. 5, pp. 603–619, May 2002.
[10] Sumant joshi,& Atul shire, “An Enhanced Algorithm for Color Image Segmentation;” Volume 3, Issue 4, April 2013.