International Journal of Automotive Engineering Vol. 3, Number 4, Dec 2013
Large Lithium Polymer Battery Modeling for the Simulation
of Hybrid Electric Vehicles Using the
Equivalent Circuit Method
M. Esfahanian1, A. Mahmoodian2, M. Amiri2, M. Masih Tehrani4,
H. Nehzati2, M. Hejabi3, A.Manteghi2
1 Mechanical Engineering Dept., Isfahan University of Technology, Isfahan, 84156, Iran 2 VFE Research Institute, University of Tehran, Tehran, 14395-1335, Iran 3 Niru Battery Manufacturing Co., Tehran, Iran4- Assistant Professor Automotive Engineering Department Iran University of Science & Technology
Abstract
In the present study, a model of a large Lithium Polymer (Li-Po) battery for use in the simulation of Hybrid Electric Vehicles (HEVs) is developed. To attain this goal, an Equivalent Circuit (EC) consisting of a series resistor and two RC parallel networks is considered. The accuracy and the response time of the model for use in an HEV simulator are studied. The battery parameters identification and model validation tests are performed in low current with a good accuracy. Similar test process is implemented in high current for another cell and the simulation is verified with experimental results. The validation tests confirm the accuracy of the model for use in HEV simulator. Finally, the battery model is used to model a Vehicle, Fuel and Environment Research Institute (VFERI) hybrid electric city bus using ADVISOR software and its compatibility with other components of the vehicle simulator are demonstrated in a drive cycle test.
Keywords: Battery modeling, Equivalent circuit method, Lithium Polymer battery, High current test, Hybrid electric vehicle
1. Introduction
Growing concerns about energy conservation and
environmental protection have persuaded car
manufacturers to design and produce more fuel efficient vehicles such as Hybrid Electric Vehicles (HEVs). An HEV combines an electric vehicle power-train system with conventional power-train components. The cost and the time taken for the vehicle design process can be reduced significantly through the use of simulation-based design. A predictive vehicle system simulation allows design and test of a virtual vehicle under different conditions. In addition, it is possible to test various power-trains and vehicle control strategies on a computer before testing on the test cell or on proving ground [1].
The fuel efficiency and performance of HEVs are mainly limited by the performance of the energy storage system [2]. Between different kinds of energy storage systems, like ultracapacitors, fly-wheels and fuel cells, batteries are the prevalent ones in the
market due to their low cost, portability, and ruggedness [3]. Many researchers have attempted to develop quick and semi-accurate models for batteries to be used in vehicle simulations [4-10]. Among the researches performed in system stage modeling, some researchers tried to estimate State of Charge (SoC) and State of Health (SoH) online during the vehicle operation. For this purpose, observers and soft computing methods are considered widely [4-6]. Some other researchers tried to develop an EC and identify the circuit parameters to simulate battery behavior [7, 8]. Additionally, another group of researchers performed electro-thermal simulation for HEV batteries [9].
A battery model in vehicle modeling should generally achieve the goals of control and monitoring [11]. In the field of control the main objectives are:
Optimization and control of the charge/discharge process
Design of the battery Management System (BMS) Design of the energy Management System (EMS)
M. Esfahanian, A. Mahmoodian, M. Amiri, M. Masih Tehrani, H. Nehzati, M. Hejabi, A. Manteghi 565
And in the field of monitoring the main objectives are: SoC SoH Battery output variables (such as voltage, current and power)Protection parameters
Battery models can be classified into two main groups: modeling at the material stage and modeling at the system stage. In the former, the composition of electrodes is modeled and a huge amount of
computing time and enormous computational
resources is required to predict the properties of a battery. The latter is based on the input-output data from the battery and can simulate battery dynamics with the lowest processing cost and simulation time. These models can be used in the design processes for BMS or EMS while simulating battery dynamic behavior [12]. Therefore, the system stage battery modeling seems more suitable for use in a vehicle power-train simulation.
The scope of this work is to simulate the voltage-current behavior of a battery while an HEV is completing a drive cycle. For this purpose, many methods of battery modeling are used, such as laboratory and chemistry-dependent methods, electro-chemical modeling, mathematical models and EC models [13, 14]. The EC method is commonly used in HEV simulation [15-17].
In the EC method, the electrical circuit elements are used in order to model battery characteristics. At first, the structure of the EC is proposed, and then the parameters of the circuit elements are obtained experimentally. Many circuit structures have been introduced into the literature [15 and references therein]. The most popular methods for parameter estimation of an EC are the Impedance spectroscopy (IS) tests [18] and I-V methods [14].
The EC method is sufficiently accurate and quick. It does not need much experimental data or deep physical knowledge of the internal environment of the battery. Therefore, this method seems to be suitable for control and monitoring purposes.
A Lithium Polymer (Li-Po) battery possesses a much smaller size and much lower weight for a given
stored energy when compared with most other common battery technologies. Some advantages of Li-Po batteries are listed below [19, 20]:
Low self-discharge rate (about 5% of the capacity per month, compared to 15% for the Valve-Regulated Lead Acid (VRLA) battery and 25% for the NiMH battery),Long life cycle. In the case of the NiMH battery, the cycle life typically drops to 80% of the rated capacity after 500 cycles at the C-rate (one hour charge followed by a one hour discharge). Li-Po batteries can achieve more than 1,200 cycles before reaching 80% of their rated capacity.
Good pulse power density Few Peukert and memory effects
Monotonous and predictable ageing behavior
Capability to be manufactured in any size Use a relatively inexpensive metal oxide that is fabricated in sheet form to allow inexpensive battery production
These advantages have led to growing use of Li-Po batteries in HEVs, but few models of these batteries for use in HEV simulation have been developed yet, and many researchers are working on it.
In this study, an EC model is developed to simulate the dynamic behavior of a Li-Po battery and its working parameters are estimated using the IS and I-V method. This model can monitor battery parameters for use in the HEV simulator and has a quick response to real-time simulations. For a case study, this model has been used in the simulator of an O457 bus which has been converted to a series hybrid vehicle at the Vehicle, Fuel and Environment (VFE) research institute in University of Tehran.
This paper is organized as follows. In section 2, the Li-Po battery EC is introduced. Then the methods of parameter identification and the battery simulation using MATLAB/Simulink are illustrated in sections 3 and 4, respectively. The simulation results are discussed in section 5 and the conclusions are presented in section 6.
Fig1.Equivalent circuit used for simulation of the battery
566 Large Lithium Polymer Battery Modeling……
International Journal of Automotive Engineering Vol. 3, Number 4, Dec 2013
Fig2.Transient response to a step load-current
Fig3.Temperature characteristics of a typical Li-Po
2. Lithium Polymer battery equivalent circuit
The primary and the key step in the battery modeling by EC method, is to decide on an appropriate circuit. Since, a few studies have been done on Li-Po batteries, using the structure of a similar battery such as Li-Ion could be reasonable for groundwork analysis.
The EC which is used in this research for initial study is shown in Fig. 1 [14]. This model contains a resistor in series with two RC parallel networks. The voltage response of a battery to a current step is shown in Fig. 2. The Series resistor (R1) is responsible for the immediate voltage drop in the step response. Two RC parallel networks (R2C2 and R3C3) are responsible for the short- and long-time constants of the step response [14].
Li-Ion battery uses liquid electrolyte between the cathode and anode, while Li-Po uses solid polymer (that resembles plastic, which permits lithium ion flows but otherwise non-conductive) with some added gelled electrolyte for "extra kick" required for high current applications. Li-Po battery can be made thinner and lighter weight compared to a Li-Ion
battery of similar capacity. According to these differences, it seems necessary to study Li-Po batteries accurately and individually. But, as described earlier, one can use Li-Ion EC for initial study and then alters the model according to accuracy and specific behaviors of Li-Po battery.
Generally, the I-V characteristic of a battery is a complicated function of different variables such as SoC, current, temperature and cycle numbers. To simplify modeling, some subordinate parameters which have negligible effects on specific batteries are simplified or ignored [14]. These dependencies add complexity to the model and prolong the test process. Since the operational temperature of batteries in HEVs is in the range of 15-50° C, and the performance of Li-Po batteries is little dependent on temperature within this range (as shown in Fig. 3), one can ignore temperature effects in the modeling. Besides, dependency of battery parameters to current and battery life is ignored in many researches such as [4, 13, 14, and 21]. Furthermore, due to low self-discharge rate and few Peukert and memory effects in Li-Po batteries, the influence of these parameters
could be neglected during modeling.
4.2 4.4
3.8 4.0
3.6
3.4 3.2
3.0 2.8
2.6 2.4
0 10 20 30 40 50 60 70 80 90 100 110 120
@ -20 C° @ -10 C° @ 0 C° @ 25 C° @ 40 C° @ 60 C°
Relative capacity / %
V
o
lt
a
g
e
/
V
M. Esfahanian, A. Mahmoodian, M. Amiri, M. Masih Tehrani, H. Nehzati, M. Hejabi, A. Manteghi 567
3. Parameter Identification
After specifying of EC structure, the next step is to identify the circuit parameters. There are two main methods to achieve this goal:
Impedance Spectroscopy test and, Current-Voltage test
3.1. Impedance Spectroscopy test
In this method, the charge/discharge and impedance data are obtained with a specific device and the IS test is performed in a definite range of frequencies. The battery is discharged at a constant rate while the test is repeated in different SoCs.
The next stage in the IS method is to extract the battery EC parameters. ZView is one of the most flexible and powerful software in electrochemical impedance spectroscopy measurement which could be used for this purpose. To achieve this goal, the structure of the EC must first be selected. Then by changing the parameters, the Z'-Z" curve of the chosen circuit must be fitted to that of the test results [21]. The flowchart of the battery parameter extraction process through the IS method is shown in Fig. 4. Steps 2-5 are repeated for each SoC.
For instance, the Z'-Z" curves of a specific EC (consisting of a resistor in series with one RC parallel network) and test results in Z-View in a definite SoC are depicted in Fig. 5.
Fig4.Flowchart of the extraction process for the battery parameters using the IS method
Fig5.Z'-Z" curves for a specific circuit and test result
3.2. Current-Voltage test
In this method, a specific current profile is introduced to the battery and the terminal voltage is recorded. These input-output data (current-voltage) are used in a system identification method to determine the system parameters. The "System
Identification Toolbox" of MATLAB software is used in the present study for this purpose.
4. Battery Modeling in Simulink
Z
”
(
)
Ω
Z’ ( )Ω
0.010 0.011 0.012 0.013 0.014
0.001 0 -0.001 -0.003
Test Proposed circuit
568 Large Lithium Polymer Battery Modeling……
International Journal of Automotive Engineering Vol. 3, Number 4, Dec 2013
The battery is modeled in MATLAB/Simulink using the extracted parameters from the previous sections and the EC equations.
The battery terminal voltage (Vt) is:
Where It is the battery current, Voc is the open circuit voltage and Z is the equivalent impedance of the battery which is:
where, s is Laplace transform operator. Equation (3) is used to calculate the SoC
∫
+ =
t
C dt I i SoC t SoC
0 0
. (3)
Where, C0 represents the battery nominal capacity. SoCt shows the SoC of the battery at time t and SoCi indicates its initial state of charge.
The Simulink battery model is shown in Fig. 6. The values of R1, R2, R3 and Voc vs. SoC are applied by using look-up tables. Figure 7, shows experimental curves for Voc vs. SoC.
5. Results
For more precise study of the battery behavior at first, a cell is identified, simulated, and then the validation tests are performed, with currents lower than 3 A. After that, this procedure is reiterated for currents between 3 and 20 A (which could be considered as high power range for HEV application). Furthermore, the developed model is utilized in a common HEV simulator for investigating the capability of the model.
5-1. low current tests
The battery upon which measurements are made is a 31 Ah Li-Po, with 3.7 V nominal voltage. The charge/discharge and impedance data are obtained with a Solartron 1470, a multi-channel battery test system, controlled by Solartron cell testTM software. The IS sweeps are conducted from 10 mHz to 100 kHz at an amplitude of 10 mV. The IS is done for 10 different SoCs. The battery is discharged at a C/10 rate and 15 minutes rest time is allowed at each step.
Fig6.The battery model in MATLAB/Simulink
Fig7.Experimental curves for Voc vs. SoC
4.1 4.2
4
3.9
3.8
3.7
3.6
3.5
3.4
0 20 40 60 80 100
SoC (%)
V
(
V
)
o
c
IZ V Vt = oc−
(1)
s C R R s C R R R s Z
3 3
3
2 2 2 1
1 1
) (
+ + +
+
= (2)
M. Esfahanian, A. Mahmoodian, M. Amiri, M. Masih Tehrani, H. Nehzati, M. Hejabi, A. Manteghi 569
5-1. low current tests
The battery upon which measurements are made is a 31 Ah Li-Po, with 3.7 V nominal voltage. The charge/discharge and impedance data are obtained with a Solartron 1470, a multi-channel battery test system, controlled by Solartron cell testTM software. The IS sweeps are conducted from 10 mHz to 100 kHz at an amplitude of 10 mV. The IS is done for 10 different SoCs. The battery is discharged at a C/10 rate and 15 minutes rest time is allowed at each step.
The results of IS test at SoC of 80% is shown in Fig. 8. The Z'-Z" curve, as shown in Fig. 8, is divided into three parts. Part (1) relates to the inductance behavior of the battery impedance and is for frequencies higher than 350 Hz. Part (2) relates to the fast RC loop (R2, C2) of the EC and is for frequencies
in the region of 3 and 350 Hz. Part (3) is for frequencies lower than 3 Hz and relates to the slow response of the battery. It can be seen in Fig. 8 that parts (1) and (2) of the Z'-Z" curve, are good enough while, the noise propagation in part (3) is too severe. Therefore, it can be concluded that the IS method is
not appropriate for finding the long-time constant of the battery and it should be found by the I-V method.
The values of R2 and C2 vs. the SoC are shown in Fig. 9(a) and (b). The product of these two parameters, which is representative of the short time constant of the battery, is less than 10 ms.
For identification of R3 and C3 (the battery’s slow dynamic response), I-V tests were performed. The voltage deviation of a simulated circuit (consisting of R1, R2 and C2) from the experimental data is then calculated. Next, the input current and this voltage error are considered as the input and output of a system, respectively. These input-output data are imported to the "System Identification Toolbox" of MATLAB software and the parameters of the model are identified. The values of R3 and C3 vs. SoC are shown in Fig. 10(a) and (b). The product of R3 and C3 is higher than 70 s.
To validate the battery model, a multi-step discharge and a 3 A charge current was applied to the battery and the experimental results compared with the model results. The multi-step discharge current is shown in Fig. 11
.
Fig8.The Z'-Z" curve of IS test at SoC of 80%
Fig9.Extracted circuit parameters: (a) R2 vs. SoC,(b) C2 vs. SoC
Z
”
0.014 0.015 0.016 0.017 0.018 0.002
0.001 0 -0.002
1 2
3
570 Large Lithium Polymer Battery Modeling……
International Journal of Automotive Engineering Vol. 3, Number 4, Dec 2013
Fig10. Extracted circuit parameters: (a) R3 vs. SoC, (b) C3 vs
Fig11. The Multi-step discharge current for validation
a
b
Fig12. Discharge process: (a) Measured and estimated battery terminal voltage, (b) Error between the measured and estimated battery terminal voltage
0
10x
1 2 3 4 5
0
-0.5
-1
-1.5
-2.5 -2
-3
4.2
4 3.8
3.6
3.4
0 0.5 1 1.5 2 2.5 3 3.5 4 4.5 5
x 104
0.01 0
-0.01 -0.02
0 0.5 1 1.5 2 2.5 3 3.5 4 4.5 5
x 104 0.02
M. Esfahanian, A. Mahmoodian, M. Amiri, M. Masih Tehrani, H. Nehzati, M. Hejabi, A. Manteghi 571
a
b
Fig13. Charge process: (a) Measured and estimated battery terminal voltage, (b) Error between the measured and estimated battery terminal voltage
Fig14. The input battery current and the experimental terminal voltage
The results of simulations in Simulink for a multi step discharge and constant charge modes are shown in Fig. 12 and 13, respectively. It can be seen from Fig. 12(a) and 12(b) that the terminal voltage error in the discharge process is less than 15 mV or 0.4%.
The battery terminal voltage under constant charge current (3 A) is shown in Fig. 13(a) and the error of the terminal voltage, which is less than 30 mV or 0.8%, is shown in Fig. 13(b).
In the next stage, a more realistic test was performed to verify the model accuracy with the HEV simulation. For this purpose, a 50-point portion of the Tehran bus drive cycle [22] was selected and the respective battery current for this portion of the cycle for the O457 hybrid bus was calculated. Since the test
system’s maximum operational current is limited to 3 A, the current is scaled by a factor 1/100 and applied to the battery. The input battery current and the experimental terminal voltage are shown in Fig14. In order to monitor the battery dynamics thoroughly, a 1 ms data acquisition sample rate was selected. The
simulation was performed using different
combinations of resistors and capacitors and the results are indicated in Table 1. According to table 1, a comparison between the circuit No. 1 and 2 and the circuit No. 3 and 4 shows that adding the fast response capacitor C2, does not significantly improve the accuracy of the model. However, the slow response capacitor C3 decreases the Root Mean Square (RMS) of the voltage estimation error of a
0 0.5 1 1.5 2 2.5 3 3.5
x 104 4.2
4
3.8
3.6
3.4
0 0.5 1 1.5 2 2.5 3 3.5
x 104 0.04
0.02
0
-0.02
-0.04
572 Large Lithium Polymer Battery Modeling……
International Journal of Automotive Engineering Vol. 3, Number 4, Dec 2013
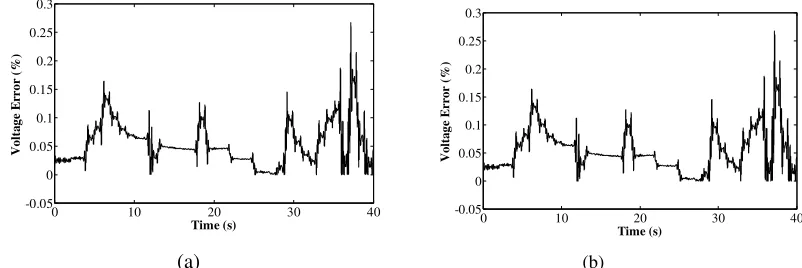
simple model, consisting only of resistors, by about 40% (circuit No. 1 and 3). In Fig. 15(a), the experimental and the simulated terminal voltages of the battery have been presented for the model with the
slow RC loop. Figure 15(b) shows the respective error which is less than 0.15%. Figure 16(a-c) indicates the error of the simulated terminal voltage for three other circuits.
Table 1: Summary of the low current cycle test results
No. Different circuits RMS Max. error (%)
1 R1, R2, R3 0.569 0.27
2 R1, R2, C2, R3 0.568 0.27
3 R1, R2, R3, C3 0.353 0.15
4 R1, R2, C2, R3, C3 0.353 0.15
(a) (b)
Fig15. The experimental and the simulated terminal voltage of the battery,R1, R2, R3, C3 (a) Voltage (b) Error
(a) (b)
Fig16. The error of the simulated terminal voltage of the battery, (a) R1, R2, R3, (b) R1, R2, C2, R3, (c) R1, R2, C2, R3, C3
0 5 10 15 20 25 30 35 40
4.03 4.04 4.05 4.06 4.07 4.08 4.09 4.1 4.11
Time (s)
T
er
m
in
a
l
V
o
lt
a
g
e
(V
)
Simulation (R1 R2 R3 C3)
Experimental
0 10 20 30 40
-0.05 0 0.05 0.1 0.15 0.2 0.25 0.3
Time (s)
V
o
lt
a
g
e
E
rr
o
r
(%
)
0 10 20 30 40
-0.05 0 0.05 0.1 0.15 0.2 0.25 0.3
Time (s)
V
o
lt
a
g
e
E
rr
o
r
(%
)
0 10 20 30 40
-0.05 0 0.05 0.1 0.15 0.2 0.25 0.3
Time (s)
V
o
lt
a
g
e
E
rr
o
r
(%
)
M. Esfahanian, A. Mahmoodian, M. Amiri, M. Masih Tehrani, H. Nehzati, M. Hejabi, A. Manteghi 573
5-2. High Current Test
For high current analysis of the battery, a test setup including a battery cell, a rheostat, and a current sensor is used. An oscilloscope is used to record the battery cell and the current sensor voltage. According to the test setup restrictions, the cycle test is performed just for discharge process, supposing pure electric mode of the HEV. Figure 17, shows the battery test setup.
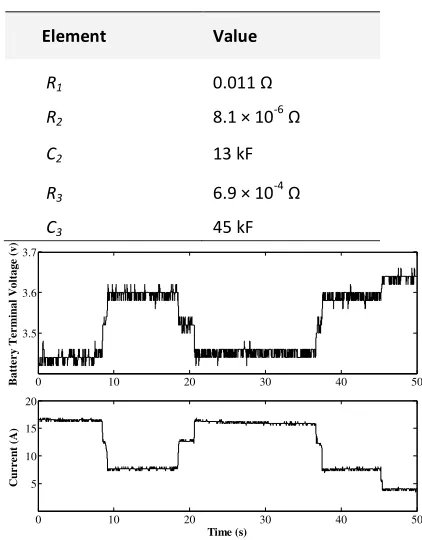
In order to identify the battery model, the voltage-current is measured for 3 different step voltage-current tests. The current in all of them is higher than 3 A. The data
acquisition is performed in two different rates of 5 Hz and 1000 Hz, so that both fast and slow RC loops could be identified. The results of battery identification in a constant SoC of about 70%, is summarized in the table 2.
According to the results of the battery identification, the short-time constant is about 110 ms and the long-time one is 31 s. A cycle test with the data acquisition rate of 25 Hz and the length of 50 s is performed so as to validate the battery model. The input battery current and the experimental terminal voltage are shown in Fig. 18.
Fig17. The battery test setup.
Table 2: The results of battery identification in the high
Element Value
R1 0.011 Ω
R2 8.1 × 10
-6
Ω
C2 13 kF
R3 6.9 × 10
-4
Ω
C3 45 kF
Fig18. The input battery current and the experimental terminal voltage for the high current test.
Rheostat
Li-P o battrey Current sensor
Oscilloscope
Electrical connection Data line
0 10 20 30 40 50
5 10 15 20
C
u
r
re
n
t
(A
)
Time (s)
0 10 20 30 40 50
3.5 3.6 3.7
B
a
tt
e
r
y
T
e
r
m
in
a
l
V
o
lt
a
g
e
(
v
)
574 Large Lithium Polymer Battery Modeling……
International Journal of Automotive Engineering Vol. 3, Number 4, Dec 2013
Fig19. The relative error of the simulated terminal voltage for the model with a resistor
(a) (b)
(c) (d)
Fig20. The battery model in ADVISOR: (a) Driving cycle, (b) SoC, (c) Voltage, (d) Current
The RMS of the voltage estimation error of different structures of the model is compared in Table 3. It is obvious from the table 3 that there is a negligible difference between the RMS of different models. Therefore, it seems that it is possible to use the simplest model, consisting of a resistor without RC loops, in the simulation of the present cell. Figure 19, indicates the relative error between the simulation and experimental voltage for the simplest model in the cycle test.
According to Fig. 19, the error of simulation with the simple resistor model is lower than 2% which is negligible and low enough. Therefore, it is possible to ignore RC loops in battery simulation in the present case, according to accuracy and response time required in HEV simulation.
Also, it was found out from the high current test results that the internal resistance of the battery is a function of its current i.e., the lower the current, the
higher the resistance. However, the effect of current variation on internal resistance is little enough (lower than 2% in the present case) to be neglected.
5-3. HEV Simulator
Finally, the developed battery model is used for the O457 hybrid bus model in ADVISOR [23]. In this test the capability and compatibility of the proposed model for an HEV application is examined. To do this, the Tehran city bus driving cycle is applied to the hybrid electric city bus fitted with 178 Li-Po batteries. The capacity of each battery is 31 Ah, the operational voltage is limited to 2.7 V - 4.2 V, the maximum permitted current for charge is 2C and for discharge is 10C. A thermostatic control strategy is used which switches between the lower limit of 45% and the upper limit of 75%. Figure 20, shows the driving cycle, SoC, voltage and current of the batteries. This
0 10 20 30 40 50
-1 0 1 2
Time (s)
R
e
la
ti
v
e
E
r
ro
r
(
%
)
60
40
20
0
0 200 400 600 800 1000 1200 1400 1600 1800
Time (s)
S
p
e
e
d
(
K
m
.h
-1)
0.6
0.4
S
o
C
(
%
)
0 200 400 600 800 1000 1200 1400 1600 1800
Time (s) 0.8
600
400
V
o
lt
a
g
e
(
V
)
0 200 400 600 800 1000 1200 1400 1600 1800
Time (s)
800 200
0
-200
-400
0 200 400 600 800 1000 1200 1400 1600 1800
Time (s)
C
u
rr
e
n
t
(A
)
M. Esfahanian, A. Mahmoodian, M. Amiri, M. Masih Tehrani, H. Nehzati, M. Hejabi, A. Manteghi 575
case study illustrates that the battery model is compatible with the HEV simulator; as well its response is quick enough.
6. Conclusion
According to increasing use of large Li-Po battery in HEVs and its great capabilities, modeling of this type of battery for use in vehicle simulators is discussed in the present paper. To achieve this goal, an EC consisting of a series resistor and two RC parallel networks was utilized firstly. Subsequently, the accuracy and the response time of the model for use in an HEV simulator were investigated in three case studies.
In the first case, the low current tests (lower than 3 A) were performed. The parameters of the EC were extracted using IS and I-V tests. The model was validated through various I-V tests and it was observed that the structure of the EC is accurate enough in simulation. The investigation was extended by modeling different combinations of resistors and capacitors and the terminal voltage of the battery was compared with the estimated voltage of different circuits. The results confirmed that one RC loop is good enough to simulate the Li-Po battery behavior for use in HEV simulation. The deviation of the simulated voltage of the model, consisting of one RC loop, from the test results was less than 0.15% in the cycle test.
In the second case, high current test were implemented on another Li-Po cell and its parameters were identified by means of I-V tests. In this case, it was observed that the model without RC loops, consisting of just one resistor, could follow the experimental results with a small deviation lower than 2%. Besides, addition of RC loops improves RMS about 1%.
Moreover, it was found out from the battery identification that its internal resistance decreases while increasing of the current. However, the effect of current variation on the internal resistance was small enough to be neglected. It should be recommended to consider the internal resistance of the battery as a function of current as well SoC, in more accurate works or higher current applications.
Finally, in the third case, the proposed model was used in the simulation of the VFERI hybrid electric city bus in ADVISOR. The response time of the model and its compatibility with other components of the vehicle simulator, is verified in this section.
The tests, as described above, confirmed the accuracy and the response time of the model for use in HEV simulator. According to the application, the
response time and the accuracy required, it is possible to use a same or a simpler model than Li-Ion circuit.
References
[1]. M. Amiri, V. Esfahanian, M. R. Hairi-Yazdi, M. Esfahanian, A. M. Fazeli and A. Nabi, Feed-forward modelling and fuzzy logic based control strategy for powertrain efficiency improvement in a parallel hybrid electric
vehicle, J. Mathematical and Computer
Modelling of Dynamical Systems (2009). [2]. M. Amiri, M. Esfahanian, M. R. Hairi-Yazdi
and V. Esfahanian, Minimization of power losses in hybrid electric vehicles in view of the prolonging of battery life, J. Power Sources 190 (2009) 372-379.
[3]. S. M. Lukic, J. Cao, R. C. Bansal, F. Rodriguez
and A. Emadi, Energy Storage Systems for Automotive Applications, IEEE transactions on industrial electronics 55 (2008) 2258-2267. [4]. A. Vasebi , M. Partovibakhsh and S. M. T.
Bathaee, A novel combined battery model for state-of-charge estimation in lead-acid batteries based on extended Kalman filter for hybrid electric vehicle applications, J. Power Sources 174 (2007) 30-40.
[5]. B. S. Bhangu, P. Bentley, D. A. Stone, and C.M.
Bingham, Nonlinear observers for predicting state-of-charge and state-of-health of lead-acid batteries for hybrid-electric vehicles, IEEE Transactions on Vehicular Technology 54 (2005) 783- 794.
[6]. I. S. Kim, Nonlinear State of Charge Estimator for Hybrid Electric Vehicle Battery, IEEE Transactions on Power Electronics 23 (2008) 2027-2034.
[7]. O. Tremblay, L. A. Dessaint and A. I. Dekkiche,
A Generic Battery Model for the Dynamic Simulation of Hybrid Electric Vehicles, VPPC 2007, IEEE, Texas, USA.
[8]. W. A. Lynch and Z. M. Salameh, Electrical Component Model for a Nickel-Cadmium Electric Vehicle Traction Battery, PES General Meeting, IEEE, 2006, Montréal, Canada. [9]. C. Mi, L. Ben, D. Buck and N. Ota, Advanced
Electro-Thermal Modeling of Lithium-Ion Battery System for Hybrid Electric Vehicle Applications, VPPC 2007, IEEE, Texas, USA. [10]. Y. Hu, S. Yurkovich, Y. Guezennec and R.
Bornatico, Model-Based Calibration for Battery Characterization in HEV Applications, AACC 2008, IEEE, Seattle, Washington, USA.
576 Large Lithium Polymer Battery Modeling……
International Journal of Automotive Engineering Vol. 3, Number 4, Dec 2013
[11].V. Esfahanian, F. Torabi and H. Moqtaderi, Introduction of battery modeling methods, J. Iran battery Industry 13 (2004) 10-17.
[12].C. H. Kim, H. S. Park, and G. W. Moon, A Modularized Two-Stage Charge Equalization Converter for Series Connected Lithium-Ion Battery Strings in an HEV, PESC 2008, IEEE, Rhodes, Greece.
[13].G. L. Plett, Extended Kalman filtering for battery management systems of LiPB-based HEV battery packs: Part 2. Modeling and identification, J. Power Sources 134 (2004) 262–276.
[14].M. Chen and G. A. Rincon-Mora, Accurate electrical Battery Model Capable of Predicting
Runtime and I–V Performance, IEEE
transactions on energy conversion 21 (2006) 504–511.
[15].Ch. Ch. Lin, Z. Filipi, Y. Wang, L. Louca, H. Peng, D. Assanis and J. Stein, Integrated Feed-Forward Hybrid Electric Vehicle Simulation in SIMULINK and its Use for Power Management Studies, Society of Automotive Engineers, Inc., SAE 2001-01-1334.
[16].J. V. Mierlo, P. V. Bossche and G. Maggetto, Models of energy sources for EV and HEV: fuel cells, batteries, ultracapacitors, flywheels and engine-generators, J. Power Sources 128 (2004) 76–89.
[17].National Renewable Energy Laboratory.
ADVISOR Documentation, Golden, CO.
[Online]. Available:
http://www.ctts.nrel.gov/analysis/
[18].S. Piller, M. Perrin and A. Jossen, Methods for
state-of-charge determination and their
applications, J. Power Sources 96 (2001) 113-120.
[19].D. Doerffel and S. A. Sharkh, Large Lithium-Ion Batteries – a Review, IN: Electric Vehicle Exhibition, EMA 2006, and Aschaffenburg, Germany.
[20]. S. Dhameja, Electric vehicle battery systems, Newnes Press (an imprint of Butterworth-Heinemann), Boston, 2002, pp. 18-21.
[21].N. Abolhassani, N. Gharib, H. Moqtaderi, M. Hejabi, M. Amiri, F. Torabi and A. Mosahebi, Prediction of state-of-charge effects on lead-acid battery characteristics using neural network parameter modifier, J. Power Sources 158 (2006) 932-935.
[22].M. Naghizadeh, Development of driving cycle for vehicles fuel consumption simulation, M. Sc thesis, Mechanical engineering dep., Iran university of science and technology, Tehran, Iran, 2006.
[23]. M. Esfahanian, V. Esfahanian, F. Sangtarash, M. Amiri, and A. Khanipour, Evaluation of a
Series Hybrid Heavy-Duty Transit Bus
Performance, FISITA 2006, World Automotive Congress.
Nomenclature
Li-Po Lithium Polymer
Li-Ion Lithium Ion
SoC Battery state of charge
SoH Battery state of Health
BMS Battery Management System
EMS Energy Management System
EC Equivalent Circuit
Voc Battery opens circuit voltage
IS Impedance Spectroscopy
RMS Root Mean Square