Testing For Efficiency Wages in Iran
Saeed Moshiri∗ Farhad Malaki ∗∗
Abstract
fficiency wages is one of the recent new Keynesian theoreis providing a micro foundation to explain real rigidities in the labour market and long run involuntary unemployment. There are many empirical studies on efficiency wages in developed economies, but there is not a well documented evidence for this type of market imperfection in less developed economies. In this paper, we test for efficiency wages using the data from the Large Manufacturing Surveys in Iran for the period 1996-2005. In our model, we explain wage differentials in the manufacturing sector by a series of firm and employee characteristics, including ownership, size, industry type, education, skill, and gender. Our panel data estimation results indicate that state owned and large firms pay higher wages than private and smaller firms. They also show that education and skills have positive effects on wages, and that there is gender discrimination in the manufacturing section of the labor market. Finally, there are significant wage differentials in the manufacturing sector, even after controlling for all major variables, confirming the efficiency wages hypothesis in Iran.
Keywords: Efficiency wages, new Keynesian, large manufacturing survey, Iran
1- Introduction
Involuntary unemployment has been one of the major macroeconomic problems that has been subject to many theoretical and empirical studies. According to classical paradigm, there should not be any involuntary unemployment in the long run, because of wage adjustment that would bring any disequilibrium in the labour market back to its equilibrium where all
∗ Assistant Professor,STM College, University of Saskatchewan. ∗∗ Master of Economics, University of Allameh Tabataba’i.
observed unemployment is voluntary. Keynesian paradigm, however, argues that the wages are not flexible enough to clear the labour market, hence prolonged involuntary unemployment. Both paradigms have shortcomings and could not explain the problem satisfactorily. The former denies the existence of the involuntary unemployment and rejectes the idea of irrational and non-optimizing agent that is implied by non-clearing market in the long run. The latter could not provide a convincing theory as to how and why agents behave in an apparently irrational and non-optimal manner. Recent new Keynesian paradigm has been trying to reconcile between the two views by providing models based on classical assumptions of rational and optimizing agents, but with Keynesian outcome. One of the prominent new Keynesian models explaining involuntary unemployment is the family of efficiency wages models that was introduced in the 1980s.
The main idea in the efficiency wages models is that the labour productivity is dependent on not only the traditional production factors such as capital, but also real wages. The efficiency wages models intend to explain why the profit-seeking firms are willing to pay wages higher than the market clearing wages. This apparently non-rational firm behaviour is explained by factors such as turn over costs, shirking and monitoring cost, asymmetric information about the ability of the workers, and sociological factors. In classical approach, labour as an input treated like capital, whereas there is a subtle difference between labour and other physical inputs. Firms are rather free on how to use their physical capital, but face restrictions beyond formal regulations in using labour. For instance, firms have to find a way to increase the workers’ loyalty and to encourage them to put forth effort. Offering wage premium is one of the means to raise workers’ effort and productivity1.
There are extensive empirical studies in the literature to test for efficiency wages in developed countries. Little is known, however, about the efficiency wages in developing economies. In this paper, we investigate the efficiency wages in manufacturing industry sector in Iran using a panel data consisting
1- The idea of wage efficiency is apparent in this line of Saadi’s (the prominent 13th century Persian poet) poem:
of the large manufacturing survey data for the period 1996-2003. Our approach is to estimate a wage equation controlling for the firm and employee characteristics and test for unexplained wage differentials across the firms. In this approach, if firms pay different wages that cannot be explained by the observed firm and employee characteristics, then we may ascribe to efficiency wages. The efficiency wages imply that some firms pay wages higher than the market clearing wages contributing to involuntary unemployment. Our study, as far as we know, is the second study in Iran, which uses the micro data to test for efficiency wages1. The first study by Souri (1985) uses a limited data set for the period 1994-1997 and focuses on the wage differentials between the private and public sectors. Our data set is much longer and our model control for more firm and employee characteristics. The rest of the paper is organized as follows. In section 2, we discuss the theoretical background of efficiency wages, and in section 3, we review the empirical literature review. We present the model and estimation results in section 4 and conclude the paper in section 5.
2- Theoretical Background
In general, the efficiency wages short run production function can be written as
where y is the output, N labour and e the labour effort or efficiency which depends on real wages (w): e = e(w), e’>0, . α is the production shift factor (Yellen, 1984). This labour augmented production function is different from the classical production function, where e is assumed one, representing full efforts. In the efficiency wage models, the efforts level at the market wages (w) is less than one, implying that a real wage higher than the market wage is required to induce higher efforts by workers. The profit maximizing firm will hire labour up to the point where its marginal product equals the efficiency wages (w*). w* is efficiency wage as it minimizes the wage costs per efficiency unit of labour (Katz, 1986).
There are various models providing a rationale for efficiency wages. The recent models include shirking, turn over costs, asymmetric information, and sociological norms. We review these hypotheses briefly here. In shirking models, it is assumed that employees optimal behaviour in the market clearing wage is to shirk. In these models, it is assumed that workers and employers are homogeneous. The efficiency wages depend on the following factors:
a. What is the possibility of detection of shirking? Shirking takes place particularly where detection is not easy and monitoring is highly costly. Therefore, the shirking problem is expected to be more serious in large firms than small firms, in firms with inefficient monitoring system, and where the nature of job, such as team work, does not easily lend itself to detection (Katz, 1986).
b. How serious are the consequences of shirking by employees to employers? If the damage caused by shirking is significant, employers will be willing to pay a higher wage premium to avoid such damage (Milkovich and Newman, 1984).
c. How much is the expected income from unemployment? The
higher the expected income from unemployment, such as (un)employment insurance, the higher will be the required wage premium to keep shirking low (Shapiro and Stiglitz, 1985).
d. How much is the unemployment rate and duration of unemployment? If the unemployment rate is high, and therefore, the duration of unemployment for a discharged worker is long, the wage premium to induce effort will be low. In other words, as the cost of being fired and unemployed increases for an employee, the possibility of shirking becomes lower (Shapiro and Stiglitz, 1985).
e. How much is the wages offered by other employers? When the wages offered by other employers are high, the required wage premium will be higher (Bulow and Summers, 1986).
The efficiency wages postulates that firms pay wages higher than market clearing wages in order to raise the cost of job loss and induce workers to put forth required effort1. There are also other alternative incentive mechanisms, such as deferred payments and employment fees, to reduce with shirking. In deferred payment scheme, workers are promised to get paid extra based on their long term performance. Employment fee functions as a security deposit which is paid by a worker when hired and will be claimed by the employer if the worker gets caught. The empirical studies indicate that these alternative incentive mechanisms are not as strong as efficiency wages scheme in reducing shirking (Katz, 1986).
The second rationale for efficiency wages is turnover costs. Costs of hiring and training employees are significant and partly born by employers. If firms pay higher wages than market clearing wages and if unemployment rate and other costs of unemployment are high, the quit rate will become lower. Salop (1979) and Stigliz (1974) show that if the quit rate is a decreasing function of wages, firms would offer wages higher than market clearing wages to encourage workers to stay and therefore to avoid the turnover costs. The turnover costs hypothesis predict that firms that offer efficiency wages would have lower turnover costs and firms that offer market clearing wages would bear higher turnover costs.
The third explanation for efficiency wages is adverse selection due to asymmetric information. The asymmetric information model suggests that efficiency wages reduces the likelihood of hiring labour with low ability and low productivity. The model is based on the fact that firms offer market clearing wages corresponding to workers observed characteristics. However, workers ability and loyalty which affect their productivity and therefore wages are not observable before employment. Therefore, firms will likely have to hire workers from a pool of low ability workers, who have more
incentives to work at the market clearing wages than workers with high ability. The problem arises because firms do not have information about the ability of workers, but workers have full information about themselves. If information on workers’ ability is symmetric between the employers and the employees, then firms would offer wages based on not only the observed employees characteristics, but also their level of ability. In other words, there will be two market clearing wages, one for low ability workers and another for high ability workers. However, since information is asymmetric, market would fail as firms could not distinguish between these two types of workers and thus its offering of average market clearing wages would encourage low ability workers to apply. Efficiency wages can overcome the imperfect information problem since they will increase the likelihood of hiring high ability workers from the applicant pool (Stiglitz, 1974, Weiss, 1980).
The fourth models providing a rationale for efficiency wages are the sociological factors. Akerlof (1982, 1984) develops a model in which the wage structure of the firm and internal consistency and perceived fairness of wage system by workers are as important as the market wage structure. This model is based on sociological studies indicating that a worker’s effort level depends on the norms of his/her work group. Firm can raise the group work norms and the worker’s morale and loyalty by offering wages above the market clearing wages. In this approach, the wage premium is perceived as a gift by an employer to employees and the employees return the gift by raising their efforts. The workers productivity will also be higher when they feel that firm shares its rents with its employees.
3- A Review of Empirical Studies
approach for testing efficiency wages is the direct test using production function. In this approach, factors that are implied to have an effect on productivity through efficiency wages are included in the production function and their significant coefficients are taken as evidence for efficiency wages. The rationale for wage efficiency varies based on the approaches presented in section 2. For instance, shirk models imply that large firms would pay higher wages, because monitoring is more costly in large firms than small firms. Furthermore, firms with expensive machinery will pay wage premium to avoid large damages. Turnover cost models predict that firms with high training and turnover cost will pay efficiency wages to lower quit rate. Finally, sociological models imply that firms that require high level of team work would pay wages higher than market clearing wages to raise the workers morale and loyalty. In this section, we review some empirical studies using approaches above.
much larger than that can be explained by the training effect. Gera and Grenier (1994) study the wage differentials in the Canadian non-agricultural sector. Using the data for 1989 and controlling for factors such as human capital, they report significant differences among firms that cannot be explained by observed factors. Specifically, they show that firms in industries such as construction, minerals, transportation and communication, and financial services pay higher wages than average and firms in industries such as whole sale and retail sale pay lower wages than average.
Konings and Walsh (1994) use a different approach to test for efficiency wages. They argue that the market shares of firms that pay efficiency wages should be higher than firms that pay market clearing wages. Using the data from UK firms over the period 1973-1982, they show that the effect of efficiency wages on market shares depends on unionization. In low unionized firms, efficiency wages have led to higher market shares, but in high unionized firms, efficiency wages has weakened the market share performance. Wadhwani and Wall (1991) also follow the same approach, but use two different proxies for efficiency wages. They use unemployment rate and relative wages in production function to test for efficiency wages. If efficiency wages hypothesis holds, unemployment rates and relative wages should significantly explain productivity. Therefore, they include both unemployment rates and relative wages in a classical production function and test for their significance. Using 219 UK manufacturing companies over the period 1972-1982, they show that both unemployment rates and relative wages contribute to productivity significantly.
4-Estimation Model and Results a. Methodology
We specify a demand for labour in which the log of wages depend on two groups of variables. The first group includes a series of variables on firm characteristics such as firm type, size, and ownership. The second group of variables is individual characteristics including skill, education, and gender. Our test for efficiency wages follows the Krueger and Summers (1998) methodology in which the firm and individual characteristics should be able to explain the observed wage differentials among employees. If, however, there remain wage differentials unexplained by the observed factors, it can be ascribed to efficiency wages. The model is as follows:
where wit is the logarithm of wages paid to an employee by firm i at time
b. Data
Our data source is the longitudinal Large Manufacturing Survey that is produced by the Iranian Statistical Centre. The data include detailed information about firms that are categorized by two-digit ISIC codes. Since the data is at firm level, the individual characteristics variables are averaged over individuals in each firm. The period of study is 1998-2005.
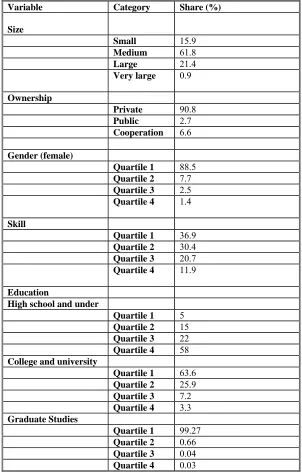
The dependent variable is the logarithm of annual average wages. The better measurement would be wages per hour, which is not available in the data. If the proportion of females working part time is more than males, the average wage would generate biased estimation of gender effect. Therefore, the coefficient of gender in our model should be interpreted cautiously. The independent variables are firm and individual characteristics. The former includes industry type, ownership, and size, and the latter gender, education, and skill. The summary statistics of the variables used in the model is presented in Table 1. We use industry dummies to capture the industry effects on wages, which represent wage differentials unexplained by firm and individual observed characteristics. The ownership is divided in three groups: Private, public, and cooperation. As the summary data in Table 1 shows, about 91 percent of firms are private, 7 percent public, and 3 percent cooperation. The firm size is one of the firm characteristics that is measured by the number of employees. We categorize firms in four groups and use dummy variables for each group. The number of employees in small firms is fewer than 10, medium firms between 10 to 50, large firms between 50 to 1000, and very large more than 1000. The majority of firms are in medium size comprising about 62 percent of the total firms, followed by large and small firms with the shares of 21 and 16 percent, respectively. The share of very large firms is about 1 percent.
quartiles. As the summary statistics in Table 1 show, the ratios of firms in the first category (high school and under) is increasing in each quartile, but decreasing in the second (college and university) and the third categories (graduate studies). Specifically, five percent of firms are in first quartile and two-third in fourth quartile in the high school and lower category, but more than two-third of firms in the second category and 99 percent in the third category are in the first quartile.
5- Estimation Results
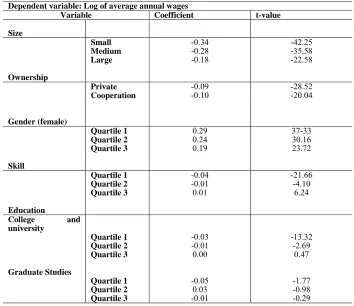
The estimation results are presented in Table 2. The estimation method is random effects method that allows us to estimate the time-invariant industry effects on wages. To avoid multicolinearity, one dummy from each category is removed. The results indicate that the larger firms pay higher wages, given other things constant. Specifically, the wages paid in small, medium, and large firms are 34 percent, 28 percent, and 18 percent less than wages paid in very large firms. The ownership coefficients show that state-owned firms pay more than both private and cooperation firms (public firms are the reference group). Specifically, private firms paid on average 9 percent less and cooperation 10 percent less than public firms.
workers pay more than the reference group. Contrary to the gender coefficients, the wage variations due to skill differences are not noticeable (at most 4 percent), and therefore the level of skill has not been very significant in wage differentials. The last individual characteristic is education. As the results indicate, firms with higher ratios of educated employees pay higher wages. Specifically, firms with less than 25 percent of their employees having college and university education pay lower wages on average than firms with more than 75 percent of their employees having the same level of education. The wage differentials among firms vary between zero to 3 percent for the college and university education and 1 to 3 percent for the graduate education level.
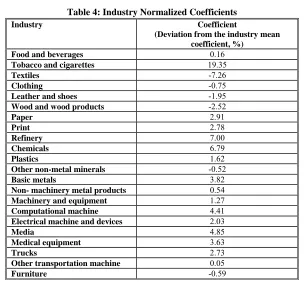
We report the industry effects on wage differentials separately in Table 3. There are 23 industries classified by 2-digit ISIC codes. We use recycling industry as a reference industry. As the results indicate all industries, except for textile, pay on average significantly higher wages than the recycling industry. The results in Table 3 only allow us to compare the wages of each industry with the recycling industry, as a reference industry. To compare wages among industries and with the average wages, we report the normalized coefficients in Table 4. The results indicate that there remain significant wage differentials among firms, which are not explained by the observed firm and employees characteristics. Specifically, they show that industries such as paper, print, refinery, chemical, plastic, basic metal, machinery, computational machines, communication devices, medical products, and transportation equipment pay higher and industries such as clothing, leather and shoes, wood products, non-metal minerals, and furniture pay less than the total average wages. The wage differentials not explained by firm and employees characteristics are an indication of efficiency wages in the Iranian manufacturing labour market.
6-Conclusion
characteristics, they can be ascribed to efficiency wages. We capture the efficiency wages through the industry effects. If a firm pays to an employee a higher wage than the employee can receive in other similar settings, i.e. market wage, it would be beyond the individual and firm observed characteristics, and therefore can be explained by the efficiency wages hypothesis.
Our results indicate that there are significant wage differentials among the Iranian manufacturing industries, after controlling for all the classical observed determinants of wages. This indicates that some Iranian firms on average pay a significant wage premium to encourage effort and loyalty or to avoid costs involved in turnover and training. The results can then be interpreted as an evidence for efficiency wages. In particular, firms in industries such as textiles, leather and shoes, wood and wood products, non-metal minerals, and furniture pay less than the average wages, and the rest of industries pay wages above the average wages. The wage premiums paid by efficiency wages industries range from 0.05 percent in transportation equipment to 19.35 percent in tobacco industry. Among industries exercising efficiency wages, tobacco, refinery, chemical, and media industries pay the highest premiums by offering wages 19.35, 7, 6.8, and 4.85 percent above the market average, respectively. These industries include large and established firms with high degrees of concentration that employ relatively high skilled employees. They are also well connected to the state and enjoy political, legal, and even financial supports from government. For instance, in tobacco industry, there is only one firm in the market, producing and importing all the products. In the refinery industry, the firms receive their main input, i.e. petroleum, at a negligible cost. The media industry is also monopolized by either state or state-backed firms. The high wage premiums estimated for these industries may be explained by considerations such as turnover cost or shirking and monitoring problem as suggested by the efficiency wages hypothesis. Alternatively, they may be explained by the high rents directed to these firms. That is, the higher wage premiums are simply the result of the rent sharing behaviour by the firms.
wages than firms owned by private and cooperation structure and smaller firms. The results are also consistent with the literature that individual characteristics (education, skill, and gender) can explain part of the wage differentials. In our study, however, the gender factor is more pronounced than other two factors that comprise human capital. The gender coefficient shows a significant high wage discrimination against female employees, but since the results are not adjusted for part time employers, which are more probably females rather than males, they are subject to bias and should be interpreted more carefully. Among other observed characteristics, one may include regional factor. Since Iran is a relatively large country with diverse culture in different regions, they may partially explain wage differentials as well. We did not include the regional variable because the data was not available to us.
References
1- Akerlof, G .A .(1982), “Labor contracts as partial gift exchange”,
Quarterly Journal of Economics 87, November, 543- 569.
2- Akerlof, G .A .(1984), “Gift exchange and efficiency wages :Four views”, American Economic Review 74, May, 79-83.
3- Bulow, Jeremy I & Summers, Lawrence H. (1986), "A Theory of Dual Labor Markets with Application to Industrial Policy, Discrimination, and Keynesian Unemployment," Journal of Labor Economics, University of Chicago Press, vol. 4(3), pages 376-414, July.
4- Dickens, W .T .and Katz, L .F .(1987, “'Inter-Industry Wage Differences and Industry Characteristics” , in K .Lang and J .S .Leonard
(eds ).Unemployment and the Structure of Labor Markets, Oxford :Basil
Blackwell.
5- Gera, S. Grenier,G .(1994), “Interindustry wage differentials and efficiency wages: some Canadian evidence”, The Canadian Journal of
Economics, Vol. 27, No. 1. (Feb.,1994), pp. 81-100.
6- Iran Statistic Center, Large Manufacturing Firms Survey, 1998-2005. 7- Katz, L .F .(1986 )b .'Efficiency Wage Theories :A Partial Evaluation',
NBER Macroeconomics Annual, Cambridge, Mass., 235-276.
9- Konings, J., P. P. Walsh (1994 ), “Evidence of Efficiency Wage Payments in UK Firm Level Panel Data”, The Economic Journal, Vol .104, No .424, May,542 -555.
10-Krueger, A. and Summers, L. H. (1988), “Efficiency Wages and the Inter-Industry Wage Structure,” Econometrica, Vol. 56, No. 2, March. 11-Krueger, A. and Summers, L. H. (1989), “Efficiency Wages and the Wage Structure”, NBER working paper W1952.
12-Levine, David I .(1992), “'Can Wage Increases Pay for Themselves? Tests with a Production Function”, Economic Journal, Vol .102, no .414, pp .1102–1115
13-Milkovich G. T. and Newman, J. M. (1984). Compensation. New York: McGraw Hill.
14-Salop, S .(1979 ), “A model of the natural rate of unemployment,”
American Economic Review 69, March, 117-125.
15-Shapiro, C .and J .E .Stiglitz (1985), “Equilibrium unemployment as a worker discipline device,”American Economic Review 74, June, 433 -444. 16-Souri, Ali (2005), “Wage Differentials in Public and Private Large Manufacturing Firms and Efficiency Wages”, Journal of Economic Research (Farsi with English Abstract), 75
17-Stiglitz, J .E .(1974), “Alternative Theories of Wage Determination and Unemployment in L.D.C.'s :The Labor Turnover Model”,Quarterly Journal of Economics 88, May, 194-227.
18-Wadhwani, S .and Wall, M .(1991), “'A Direct Test of the Efficiency Wage Model Using UK Micro-Data”, Oxford Economic Papers, New Series, Vol .43, No .4, October, 529 -548.
19-Weiss, A .(1980 ), “Job Queues and Layoffs in Labor Markets with Flexible Wages”, Journal of Political Economy, 88, 526-538.
20-Yellen, J .(1984) , “Efficiency wage models of unemployment”,
Table 1: Summary Statistics of Large Manufacturing Firms Data(1998-2005)
Variable Category Share (%)
Size
Small 15.9
Medium 61.8
Large 21.4
Very large 0.9
Ownership
Private 90.8
Public 2.7
Cooperation 6.6
Gender (female)
Quartile 1 88.5
Quartile 2 7.7
Quartile 3 2.5
Quartile 4 1.4
Skill
Quartile 1 36.9
Quartile 2 30.4
Quartile 3 20.7
Quartile 4 11.9
Education High school and under
Quartile 1 5
Quartile 2 15
Quartile 3 22
Quartile 4 58
College and university
Quartile 1 63.6
Quartile 2 25.9
Quartile 3 7.2
Quartile 4 3.3
Graduate Studies
Quartile 1 99.27
Quartile 2 0.66
Quartile 3 0.04
Quartile 4 0.03
Table 2: The Random Effects Estimation Results (1998-2005)
Dependent variable: Log of average annual wages
Variable Coefficient t-value
Size
Small -0.34 -42.25
Medium -0.28 -35.58
Large -0.18 -22.58
Ownership
Private -0.09 -28.52
Cooperation -0.10 -20.04
Gender (female)
Quartile 1 0.29 37-33
Quartile 2 0.24 30.16
Quartile 3 0.19 23.72
Skill
Quartile 1 -0.04 -21.66
Quartile 2 -0.01 -4.10
Quartile 3 0.01 6.24
Education
College and university
Quartile 1 -0.03 -13.32
Quartile 2 -0.01 -2.69
Quartile 3 0.00 0.47
Graduate Studies
Quartile 1 -0.05 -1.77
Quartile 2 0.03 -0.98
Tab le 3: Industry Coefficients
Industry Coefficient Standard Error
Food and beverages 0.08 0.019
Tobacco and cigarettes 0.27 0.019
Textiles 0.00 0.017
Clothing 0.07 0.019
Leather and shoes 0.05 0.018
Wood and wood products 0.05 0.018
Paper 0.10 0.020
Print 0.10 0.018
Refinery 0.14 0.018
Chemicals 0.14 0.018
Plastics 0.09 0.018
Other non-metal minerals 0.07 0.018
Basic metals 0.11 0.019
Non- machinery metal products 0.08 0.021
Machinery and equipment 0.09 0.017
Computational machine 0.12 0.019
Electrical machine and devices 0.09 0.019
Media 0.12 0.002
Medical equipment 0.11 0.018
Trucks 0.01 0.019
Other transportation machine 0.07 1.143
Furniture 0.07 0.019
Table 4: Industry Normalized Coefficients
Industry Coefficient (Deviation from the industry mean
coefficient, %)
Food and beverages 0.16
Tobacco and cigarettes 19.35
Textiles -7.26
Clothing -0.75
Leather and shoes -1.95
Wood and wood products -2.52
Paper 2.91
Print 2.78
Refinery 7.00
Chemicals 6.79
Plastics 1.62
Other non-metal minerals -0.52
Basic metals 3.82
Non- machinery metal products 0.54
Machinery and equipment 1.27
Computational machine 4.41
Electrical machine and devices 2.03
Media 4.85
Medical equipment 3.63
Trucks 2.73
Other transportation machine 0.05