Cost Appraisal of Municipal Solid Waste Transfer to Disposal Site
Using Visual Basic Program
Olukanni, D.O.1*, Iroko, T.S. 1 and Aremu, A.S.2 1
Department of Civil Engineering, Covenant University, P.M.B. 1023, Ota, Ogun State, Nigeria.
2
Department of Water Resources and Environmental Engineering, University of Ilorin, Nigeria
Received: 15 Mar. 2015 Accepted: 18 May. 2015
Abstract: Collection of Municipal Solid Waste (MSW) accounts for a significant proportion of most municipal budgets, and has drawn some degree of researchers‟ interest. This study was conducted in Ota, Southwest Nigeria, to explore the use of Visual basic program as an innovative tool to select the most economic haulage system among three systems found in literature (conventional-, modified- and Stationary- hauled system) for collection and transfer of MSW to disposal sites. Factors that affect the costs of collection and transportation of waste such as: vehicle cost, total time spent on waste collection, and gross travel cost, were considered in the analysis. The result of the study shows that the stationary hauled method of waste collection is the optimal and economical method of collection. This method recorded a 56% and 43% reduction in total cost of daily travel per waste collection, as compared to the conventional and the modified systems, respectively. The application of visual basic program proffers implementable solutions to reduce the cost of MSW transportation to disposal sites. This would reduce travel time and costs of vehicle fueling, and increase the prompt collection of waste which would in turn facilitate the development of an aesthetically balanced and environmentally friendly municipality that would perhaps boost economic development. Keywords: environmental sustainability, haulage systems, municipal solid waste, optimal collection cost, visual basic.
.
INTRODUCTION
The growing complexities in Municipal Solid Waste (MSW) management have
necessitated the development and
application of new tools. These
complexities are seen in the form of waste composition and the ever-increasing per capita waste generation that poses a challenge to effective waste collection. Some of the challenges that characterize the ineffective management of MSW in
*Corresponding author Email:
[email protected], Tel: +234-8030726472
deal with domestic waste due to lack of a cohesive collection and disposal system,
and frequent breakdown of waste
collection trucks. Zurbrugg (2003) expressed that one to two thirds of generated solid waste in developing countries are not collected. Also, Agunwamba et al. (2003) and Nguyen and Wilson (2010) revealed that the cost of labor, purchase and maintenance of vehicles involved in the collection and disposal of solid wastes, have risen so high that many sanitation agencies are already finding it increasingly difficult to collect and dispose all wastes generated.
Primary collection of waste is one of the essential steps of solid waste management activity. This is necessary to ensure that waste stored at source is collected regularly and does not constitute environmental
menace. Although households and
institutions are often provided with waste collection bins for domestic refuse disposal, these collection bins, sometimes remain unattended to because of diverse transport problems (Chang and Wei, 2002; Olukanni et al., 2014). Ogwueleka (2009) stressed that the volume of solid waste being generated continues to increase at a rate faster than the ability of waste management agencies to improve on the financial and technical resources needed to parallel this growth. The cost of solid waste collection has been reported to form a large component of the final solid waste management cost (Chang and Wei, 2002; Agunwamba et al., 2003; Arebey et al., 2012; Olukanni et al., 2014). It was also noted in the study of Ogwueleka (2003), that in developing countries, local authorities spend 77-95% of their revenue on collection and the balance on disposal, but can only collect about 50-70% of municipal solid waste (MSW).
Several studies have been conducted on the development of a simple approach for solid waste collection and minimization of the collection cost (Huang et al., 2011;
Aremu et al., 2012; Nithya et al., 2012; Rada et al., 2013; Kao et al., 2013; Di Felice, 2014a; Teixeira et al., 2014). Among the several factors affecting collection costs are; quantity of solid waste generated, vehicle scheduling, fleet size, truck size, container combination, vehicle routing, and the location of transfer stations and disposal sites (Stessel, 1996; Ojiako and Nwosu, 1989; Chang and Wei, 2002; Agunwamba et al., 2003). This study emanated from the challenge with waste collection and the indiscriminate disposal of waste in Ota which is a concern to the local government waste management agency and the inhabitants. The study was therefore aimed at churning out a cost effective way of collecting and transporting MSW from source to disposal points. The specific objectives of this study are to: a) identify the main waste collection and disposal points in the study area, and b) utilize Visual Basic program as an innovative tool to select the best haulage
system among three systems
(conventional-, modified- and Stationary-hauled system) of MSW collection and transfer to disposal sites, as found in literature (Tchobanoglous et al., 1993; Agunwamba, 2001).
MATERIALS AND METHOD Study Area
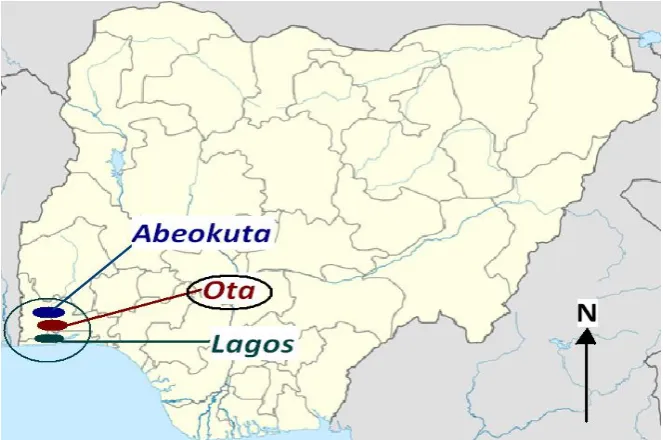
“Canaan Land” Headquarters of the mega church Winner‟s Chapel, a place renowned for housing the world‟s largest single auditorium. Ota is gradually becoming a busy place because of its proximity to Lagosthereby increasing the migration of people into it (Olukanni and Akinyinka, 2012). The management of solid waste in Ota is the primary responsibility of the Ogun State Environmental Protection Agency (OGSEPA). Figure 1 shows the geographical location of Ota on the Nigeria map.
In a resolve to forestall sanitation issues, waste bins were provided by the local government and placed along the road side for ease of collection. Collection involves the removal of solid waste and transfer from the stored facilities directly to the disposal sites. The volume of each of the waste container provided by the local government waste management authority is 7 m3 (Olukanni, 2013). These bins are used by residents as waste storage facilities. Figure 2 shows the waste collection bin at one of its location in the study area.
Fig. 1. Map of Nigeria showing the study area and adjacent cities to it
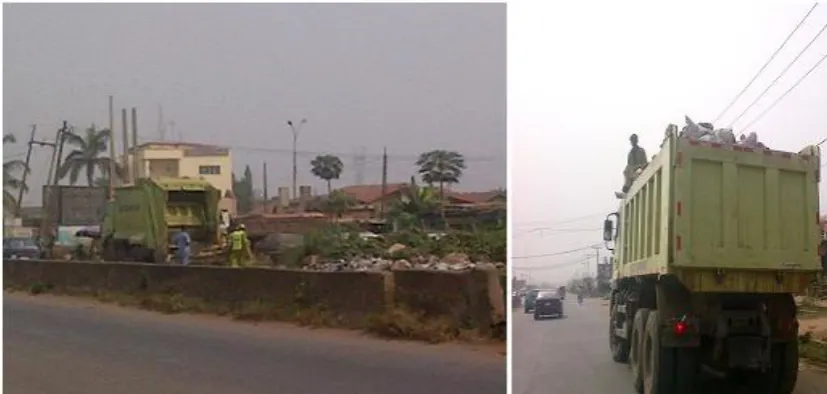
It was established that informal solid waste collection operations exist in parallel with official agencies in the municipality and solid waste collection are done spontaneously. This approach contributes to the high cost of solid waste collection. Waste are collected by residents and deposited in the storage container for the trucks to come and pick. Different types of vehicles such as: compactor trucks, mini trucks, tippers and open back trucks are the commonly used collection trucks to collect
the waste. Preliminary investigation reveals that the few available trucks breakdown frequently due to overuse and most of the collection vehicles are in a state of disrepair. Figure 3 shows the example of the collection trucks in operation during a field survey. Crew size selection is largely influenced by the amount of waste per stop, number and location of collection points, type of storage containers, and hauls time to unloading and final disposal point.
Fig. 3. Compactor and the open trucks in operation during the field survey
Approach to the Study
Three known method of municipal waste transfer were evaluated in the study (conventional, modified- and Stationary- hauled system) (Agunwamba, 2001). Methods of data collection include: One-on-one interview with relevant authorities in the ministry of environment, with personnel responsible for waste collection and transfer to disposal sites. Dumpsites in the municipality were also visited in order to assess transportable routes that the waste vehicles ply to dispose waste. Random survey that involves interviewing people about how often the wastes at the key locations are collected was also carried out. A single type of truck, the medium-duty truck was considered during analysis for the three methods of collection systems.
This is the type that collects waste from the 7 m3 bin from the source point to the disposal site.
Application of Visual Basic
Visual Basic is a high level programming language that evolved from the earlier DOS version called Beginners' All-purpose Symbolic Instruction Code (BASIC). The visual basic program is made up of many subprograms with each one having its own program codes that can be executed independently and at the same time, can be
linked together (McDonald, 2009;
The first interface of the program was designed to calculate costs of waste collection and optimal mode of collection of waste. Provision for currency exchange rate was made while developing the coding and when a numerical input is declared, the program converts the declared numerical input into other currencies existing in the database of the program. Issues addressed in the forms created include: waste density and generation rates, population density, waste generated by residents, number of waste bins and average waste volume per bin, volume and mass of waste bin, carrying capacity and required number of trips by the collection vehicle.
Objectives for Program Development
i) Obtain quantity of waste generated by residents (kg/day);
ii) Obtain required number of collection trips per day to ensure an aesthetically
balanced environment (optimal
frequency of waste collection);
iii) Determine the gross cost of daily travel for waste collection and transportation using different collection methods; iv) Determine total time required to
complete waste collection considering factors of on-site timing, pick-up timing and off-route factors;
v) Obtain daily costs of labor
(remuneration of waste workers); vi) Determine efficiency, economical
and operational costs of each of the modes of collection thus obtaining the best mode/method for waste collection and transportation.
Forms Developed in the Program
i) „frm.wastegeneration‟: This form considers the quantity of waste generated
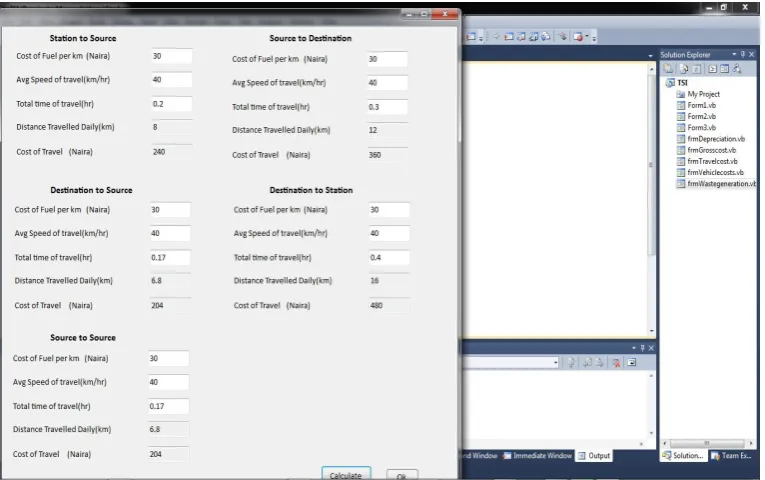
ii) „frmtravelcosts‟ takes into consideration different travel relationships and determine the cost of travel of each trip
taking different routes into
consideration. The affected trips include: Station-source relationship;
Source- source relationship; Source- destination relationship; Destination- source relationship; and Destination-station relationship.
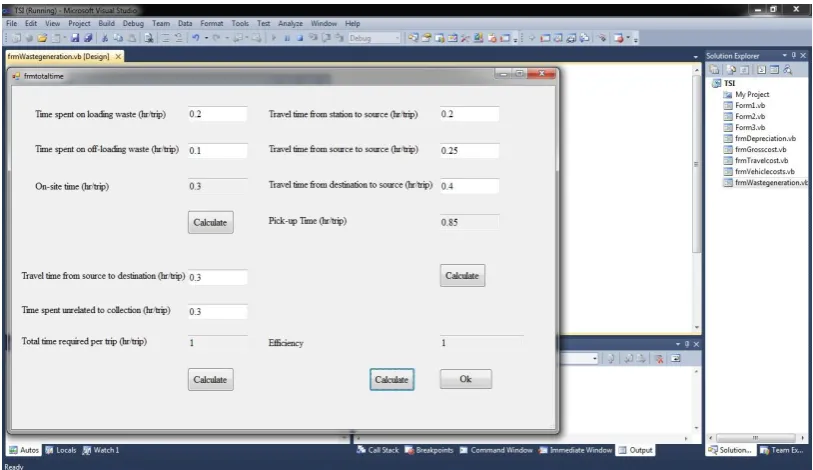
iii) “frmtotaltime”: when calculating/ estimating the cost of collecting and transporting waste, the time spent during the collection process is important to the progress of the collection process.
iv) “frmtcostofworkday”: considers total cost of work per day.
Relationships amongst the Labels
W aste generated by residents
waste ge kg h
kg
day neration rate da population density h
y (1) .. .. .. . . . kg day kg waste generation by residents
day Average quantity of w
number of waste b aste per i bin ns (2)
3 3 .. .. .. .. kg waste density m voMass of waste bin kg
lume of waste bin m
(3)
( . . .( ) 10)
1000
The weight of the waste bin in ton weight of bin
n kg es (4)
.. .. .. ..( )
.. .. .. ..( )weight of waste bin tonnes trips
day carrying capacity Required numbe
of vehicle r of trip
tonne s s (5) /
Distance travelled daily km
speed of vehicle km hr time of travel hr
(6)
Cost of travel per trip
distance travelled km cost of fuel per km of travel
(7)
quantity of wastes collected per stop results in a bigger crew size.
MODELED COLLECTION SYSTEMS Conventional Hauled Container System
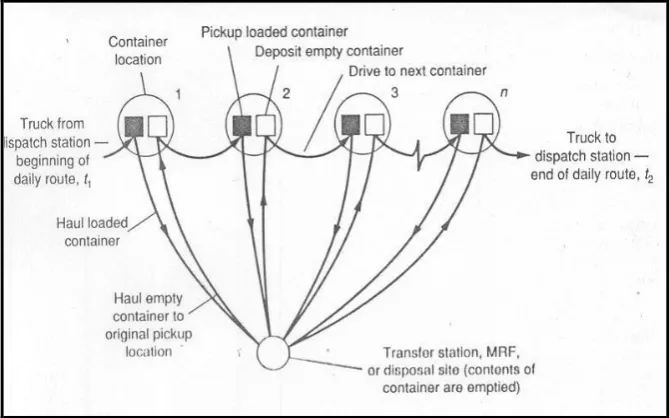
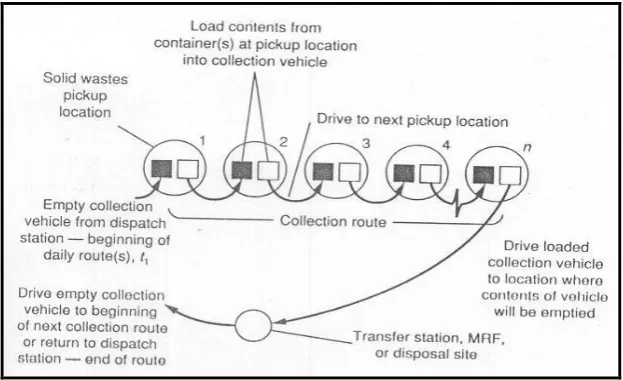
Figure 4 shows the operation for the conventional hauled container system. In this method, the collection truck picks up the filled container of waste from the source point and moves straight to the disposal site, and then returns the emptied container back to its original point of collection.
This implies that; for every waste collection trip made from a service point, there is a trip back to that same source. However, it can be observed from Figure 4 that there are connectors between the waste sources. These connectors represent the source-source relationships amongst the waste collection points. This means that after the waste has been emptied at the destination point and the empty bin has been returned to the source point, the waste collection vehicle moves to the next waste source to be collected. Therefore, the general expression for the conventional hauled container system to determine its total cost was developed as:
1 .
. . . .Total cost of travel p s n s d d s
n s s d p
(8)
where:
p.s = cost of travel from parking station to source point
n = number of waste collection trips made s.d = cost of travel from source to destination d.s = cost of travel from destination to source s.s = cost of travel from source to source d.p = cost of travel from destination to parking station.
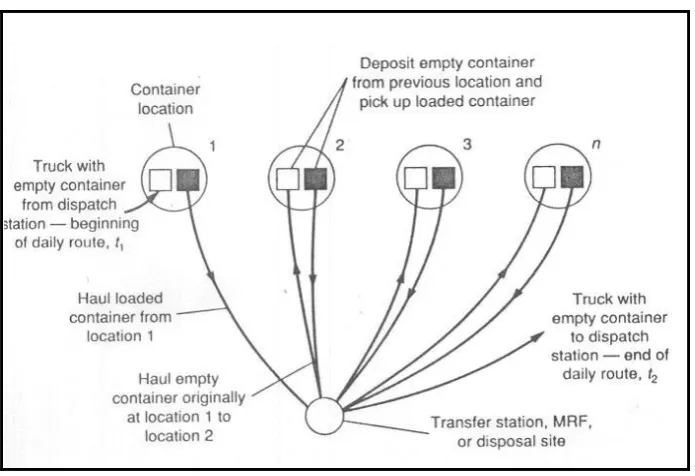
Modified Hauled Container System
Figure 5 shows the modified hauled container system. In this method of collection, the collection crew sets out of the station with an empty bin and at the first station, the bin is dropped off while the filled bin at the site is collected and taken to the disposal point. The filled waste bin whose content has been disposed from the previous site, is then taken to the next source and dropped off as the new empty bin for that source. Then, the filled bin on site is taken for disposal and then dropped off at the next source. This loop continues for as many sources as there are in the collection plan.
Fig. 4. Operational sequences for Conventional Hauled Container System.
Fig. 5. Operational sequence for modified hauled container system
Source: Adapted from Tchobanoglous et al., 1993; Agunwamba, 2001 (p. 307)
As shown in Figure 5, there are four downward arrows indicating source to destination trips, and three upward arrows indicating destination to source trips. Therefore, the mathematical expression for the total cost was developed as:
1 .
. . .Total cost of travel p s n s d n d s d p
(9)
where:
p.s = cost of travel from parking station to source point
n = number of waste collection trips made s.d = cost of travel from source to destination
d.s = cost of travel from destination to source
d.p = cost of travel from destination to parking station.
Stationary Container Systems
Figure 6 shows the third mode of waste collection which is the stationary container system. It is characterized by continuous collection of waste from source to source until all the sources for which waste is to be collected from have been exhausted and the waste vehicle is ready to return to the disposal site. The vehicle is limited by
capacity constraints; it may have to go to the disposal site when it is full to capacity.
Figure 6 shows the illustration of the collection process and the interface from one point to the other. This indicates four connectors joining the five waste sources. This implies that the collection vehicle leaves the station and heads to the first station where the waste workers empty the waste contained in the bin into the vehicle and replace the bin back to its original position (same site) then moves onto the next waste location and collects the waste there using the same process. This continues for as many waste locations as are indicated in the waste collection route.
1 .
. . .Total cost of travel p s s d
n s s d p
(10)
where:
p.s = cost of travel from parking station to source point
n = number of waste collection trips made s.d = cost of travel from source to destination
Fig. 6. Operational sequence for stationary container system
Source: Adapted from Tchobanoglous et al., 1993; Agunwamba, 2001 (p. 307)
The values used for analyses for total time for collection were obtained from field study. In order to determine the optimal mode of waste collection in terms of cost efficiency, the same values of p.s, s.d, d.s, s.s, d.p and n were used to avoid discrepancies. The naira (₦) cost value, the Nigerian currency was considered in the analysis. Although, the exchange rate fluctuates, this is currently valued at an approximate rate of ₦200 and ₦240 to one dollar ($) and euro (€), respectively. The functionality button is used to define the
most economical method of waste
collection after calculations.
Determining the Pickup Time
This interface allows the calculation of the pick-up time (hr. /trip).
The pickup time Phcs is expressed by
hcs c c bc
P P U d (11)
where Pc is the time required to pick up
loaded container (h/trip); Uc is time
required to unload empty container (h/trip), and dbc is the time required to drive
between containers. The last aspect in the interface addresses total time spent on collection per trip. The time required per trip for the hauled container system Thcs, is
expressed in Equation 12 (Agunwamba, 2001, p. 308).
w h S P
T hcs
hcs
1 (12)
where Phcs = Pick-up time; time spent
driving to the next container after the empty container has been deposited plus the time spent picking up the loaded container plus the time required to redeposit the container after its content have been emptied, hr./trip
S = On-site time per trip, hr./trip h = Haul time per trip, hr./trip
w = Off-route factor, expressed as fraction. It includes all the time spent on activities that are non-productive with respect to the actual collection.
The off-route factor (w) is represented by the label „time spent unrelated to collection‟.
The haul time per trip (h) is represented by the label „travel time from source to destination‟.
Fig. 7. Screenshot of the VB showing Total time required for waste collection and transport
Program Interface (frmtcostofworkday)
This form is used to estimate the cost of the total collection process. This is achieved by first estimating the total length of an average workday (hr/day). An important aspect of solid waste collection and transportation cost analysis is labor. Labor cost is important in order to give a value for the amount of money to be spent on hiring labor for any of the three collection methods. Major factors that influence labor costs are; length of
workday, time required per collection and disposal trip, number of daily trips, number of waste workers and remuneration per waste worker. After determining the length of a single workday, it is used alongside the money paid daily to the waste workers in order to determine the total cost of labor. Equations 13 and 14 show the relationships among all the listed factors required to obtain the daily cost of labor;
day trips daily trips of number trp
hr trip per required time
day hr workday of
length.. .. .. .. .. .. .. .. (13)
dcl lwd nww rpww (14)
where:
dcl = daily cost of labour lwd = length of workday
nww = number of waste workers rpww = remuneration per waste worker The cost of fuel per km was obtained by determining the fuel consumption rate of the type of vehicle used for waste collection. The rear loader consumes 0.21 litres/km of travel. Thus, the amount of fuel consumed per km (x litres) is expressed mathematically as shown below:
litres km
litres km
litres
x 0.21
100 . 21 . 1
. (15)
Thus, the cost of fuel per kilometer is gotten by multiplying the amount of fuel required/km of travel by the cost of fuel per litre.
0.21 litres × ₦120/litre of fuel = ₦25.2 ($0.13 USD) per km of travel
The speed and time of travel used in analysis were obtained empirically by personal trips to the various waste collection points. It should however be noted that some values are approximated by using a margin to cater for unforeseen conditions like traffic jam, condition of the road surface thus retarding travel speed and route selection.
RESULTS AND DISCUSSION
Solid waste collection vehicles are assigned to districts without any serious waste analysis. Route selection is left for drivers, and the vehicles are more than full on most trips to the disposal site. The collection in Ota is designed to be on a daily basis but unfortunately, the daily basis is not adhered to, which then causes indiscriminate disposal around the waste bin and individuals hipping up bags of waste along the road side. The collection system is also not efficient, this due to the inadequate collection vehicle. There is no house-to-house service and in most cases, people store their waste in bags and sacks by the road sides awaiting collection by the municipal authorities. The following findings were made after interviewing
necessary personnel in the State Ministry
of Environment as well as some
individuals amongst the waste workers: i) There are four trucks available for
waste collection: two 26 ton trucks and 2 compactor trucks
ii) Maximum quantity of collectible waste per trip: 26 tons
iii) Number of waste personnel (refuse loaders) per truck was set at a minimum of 3 waste operators. iv) Waste collection is not frequent
v) There are 6 private waste managers, Private sector partnership (PSP) which is solely non-governmental. vi) Monthly levy per household for PSP
waste management is ₦1000 ($5 USD). However, the populace seems to disagree with this monthly fee as they presume it to be outrageous. vii) The parking station for all waste
disposal trucks is at Pan-mill in Ota. Figures 8 and 9 show the travel cost analysis and the optimal mode of collection. The waste generation rate for Ogun State is estimated at 0.6kg/capita/day
(Ogwueleka, 2009; Olukanni and
Akinyinka, 2012).
Fig. 9. Screenshot of the VB showing optimal mode of collection (Economic consideration)
Cost Comparisons
The Naira (₦) cost value, and the Nigerian
currency were considered in cost
estimation. This is valued at an approximated rate of ₦200 and ₦240 to one dollar ($) and euro (€), respectively. From the application of collected data in the analysis, the values obtained for total cost of daily travel per waste collection mode are:
Conventional: ₦ 4,356 daily ($22 USD) Modified Hauled: ₦ 3,336 daily ($17 USD)
Stationary: ₦ 1,896 daily ($9.5 USD) Therefore, the method with the lowest gross cost of daily collection of waste is the stationary hauled method. The result of the study shows that the stationary hauled method of waste collection is the optimal and economical method of collection with 56% and 43% reduction in gross cost of daily travel per waste collection, as compared to conventional and modified systems, respectively.
CONCLUSION
The scope and magnitude of waste collection may often exceed the budgetary capacity that local authorities have to put in
place to effectively resolve issues of waste collection, transfer and disposal. The study however, proposes an optimal and efficient method of waste collection and transfer to the disposal site. The input parameters used in the model in estimating the total cost include the distance travelled from source point to disposal site, number of intersections and maneuvering during each collection trip. The result of the study shows that the stationary hauled method of waste collection is the optimal and most economical method of collection with 56% and 43% reduction in total cost of daily travel per waste collection, as compared to conventional and modified systems, respectively.
available to waste management personnel for the purchase of more waste disposal containers and vehicles, as this would help in curbing the menace of roadside dumping, and ii) Waste collection should be regularly done provided there is adequate number of waste collection vehicles for disposal as this would be cost-effective, time-saving and would lead to an aesthetically sound environment.
ACKNOWLEDGEMENTS
Special thanks are extended to the personnel who were of great help in acquiring the field data: The secretary to the Ministry of Environment, community people and the persons who work with the waste management authority in the study area.
References
Agunwamba, J.C. (2001). Waste Engineering and Management Tools. Immaculate publications Ltd, Enugu. pp. 307.
Agunwamba, J. C. (2003). Optimization of Solid Waste Collection System in Onitsha, Nigeria, Int. J. of Environmental Issues, 1(1), 124-135.
Agunwamba, J.C., Egbuniwe, N., and Ogwueleka, T.C. (2003). Least cost management of solid waste collection. Journal of Solid Waste Technology and Management, 29 (3), 154-167.
Arebey, M. Hannan, M.A., Begum R.A. and Basri, H. (2012). Solid waste bin level detection Using graylevel co-occurrence matrix feature extraction approach, J Env Management, 104, 9-18.
Aremu, A.S., Sule, B.F., Downs, J. and Mihelcic, J.R. (2012). Framework to determine the optimal number and spatial location of municipal solid waste bins in a developing world urban neighborhood, Journal of Environmental Engineering, Vol. 138 (6), 645–653.
Chang, N.B. and Wei, Y.L. (2002). Comparative study between heuristics algorithm and optimization technique for vehicle routing and scheduling in the solid waste management system. Civil Engineering and Environmental System, 19 (1), 41-65.
Di Felice, P. (2014a). Integration of Spatial and Descriptive Information to Solve the Urban Waste Accumulation Problem. Procedia - Social and Behavioral Sciences, 147, 182-188.
Kao, J., Tsai, Y. and Huang, Y. (2013). Spatial Service Location-Allocation Analysis for Siting Recycling Depots. J. Environ. Eng.-ASCE, 139(8), 1035–1041.
Kyessi, A and Mwakalinga, V., (2009). GIS Application in Coordinating Solid Waste collection: The Case of Sinza Neighborhood in Kinondoni Municipality, Dar es Salaam City, Tanzania. Unpublished Paper Presented in to Surveyors Key Role in accelerated Development, Eilat, Israel, 3-8 May 2009.
McDonald, M. (2009). Microsoft Visual Basic.Net Programmers Cookbook. ISBN 9780735637436. Published by O‟Reilly Media.
National Population Census (2006). Volume 1 of the national population census. Pp15, Date Accessed: 10/12/2012.
Nguyen, T.T. and Wilson, B.G. (2010). Fuel Consumption Estimation For Curbside Municipal Solid Waste (MSW) Collection Activities. Waste Management & Research, 28 (4): pp.289–297.
Nithya, R., Velumani, A. and Kumar, S.R.R. (2012). Optimal location and proximity distance of municipal solid waste collection bin using GIS: A case study of Coimbatore city, WSEAS Transactions on Environment and Development, 8(4), 107-119.
Ogwueleka, T.C. (2003). Analysis of urban solid waste in Nsukka, Nigeria. Journal of Solid Waste Technology and Management, 29 (4), 239-246.
Ogwueleka, T. C. (2009). Route Optimization for Solid Waste Collection: Onitsha (Nigeria) Case Study. J Appl Sci Environ Manag, 13 (2), 37- 40.
Ojiako, G.U. and Nwosu, A.D. (1989). Optimal Strategy for Solid Waste Collection in Nigeria Urban Towns. A Case Study Proc. of Eng. Research for Develop., Sept. 25-28, p 38-43.
Olukanni, D. O. and Akinyinka, O. M. (2012). Environment, Health and Wealth: Towards an analysis of municipal solid waste management in Ota, Ogun State, Nigeria. Presented at the International Conference on Clean Technology and Engineering Management, Covenant University, Ota, Nigeria, ICCEM (2012) 51 – 71.
Olukanni, D. O. (2013). Analysis of Municipal Solid Waste Management in Ota, Ogun State, Nigeria: Potential for Wealth Generation. Proceedings of the International Conference on Solid Waste Management (ICSW), Widener University, Chester, Philadelphia USA, 10th –13th March, 2013.
Akinwumi, I. I. and Ajanaku, K. O. (2014). Appraisal of Municipal Solid Waste Management, Its Effect And Resource Potential In A Semi-Urban City: A Case Study, Journal of South African Business Research , Vol. 2014, Article ID 705695, DOI: 10.5171/2014.705695
Petroutsos, E. (2010). Mastering Microsoft Visual Basic 2010 Wiley Publishers ISBN: 978-0- 470-53287-4.
Purkayastha, D., Majumder, M. and Chakrabarti, S. (2015). Collection and recycle bin location- allocation problem in solid waste management: A review. Pollution, 1(2), 175-191.
Rada, E.C., Ragazzi, M. and Fedrizzi, P. (2013). Web-GIS oriented systems viability for municipal solid waste selective collection optimization in developed and transient economies. Waste Manage. 33(4), 785-792.
Salako, R. A. (1999). Ota: The Biography of the Foremost Awori Town. Penink and Co. pp. 85- 87.
Stessel, R. I., (1996). Recycling and Resource Recovery Engineering. Principle of Waste Processing. Springer, Pp. 155-180.
Teixeira, C.A., Avelino, C., Ferreira, F. and Bentes, I. (2014). Statistical analysis in MSW collection performance assessment. Waste Management 34(9), 1584-1594.
Tchobanoglous, G., Theisen, H., and Vigil, S. A. (1993) Integrated Solid Waste Management: Engineering Principles and Management Issues. McGraw-Hill, 978 pages
Zak, D. (2013). Programming with Microsoft Visual
Basic. ISBN 9781285077925. Published by
Cengage Learning.